Associations between baseline BH3 (from DBP) and drug responses (Individual concentrations)
Junyan Lu
2020 Sept 3
Last updated: 2020-09-30
Checks: 5 2
Knit directory: BH3profiling/analysis/
This reproducible R Markdown analysis was created with workflowr (version 1.6.2). The Checks tab describes the reproducibility checks that were applied when the results were created. The Past versions tab lists the development history.
The R Markdown is untracked by Git. To know which version of the R Markdown file created these results, you'll want to first commit it to the Git repo. If you're still working on the analysis, you can ignore this warning. When you're finished, you can run wflow_publish to commit the R Markdown file and build the HTML.
Great job! The global environment was empty. Objects defined in the global environment can affect the analysis in your R Markdown file in unknown ways. For reproduciblity it's best to always run the code in an empty environment.
The command set.seed(20200826) was run prior to running the code in the R Markdown file. Setting a seed ensures that any results that rely on randomness, e.g. subsampling or permutations, are reproducible.
Great job! Recording the operating system, R version, and package versions is critical for reproducibility.
- lasso all
To ensure reproducibility of the results, delete the cache directory drugResponse_baseBH3_analysis_cache and re-run the analysis. To have workflowr automatically delete the cache directory prior to building the file, set delete_cache = TRUE when running wflow_build() or wflow_publish().
Great job! Using relative paths to the files within your workflowr project makes it easier to run your code on other machines.
Great! You are using Git for version control. Tracking code development and connecting the code version to the results is critical for reproducibility.
The results in this page were generated with repository version 90ada8f. See the Past versions tab to see a history of the changes made to the R Markdown and HTML files.
Note that you need to be careful to ensure that all relevant files for the analysis have been committed to Git prior to generating the results (you can use wflow_publish or wflow_git_commit). workflowr only checks the R Markdown file, but you know if there are other scripts or data files that it depends on. Below is the status of the Git repository when the results were generated:
Ignored files:
    Ignored:    .DS_Store
    Ignored:    .Rhistory
    Ignored:    .Rproj.user/
    Ignored:    analysis/.DS_Store
    Ignored:    analysis/.Rhistory
    Ignored:    analysis/drugResponse_baseBH3_analysis_cache/
    Ignored:    analysis/landscape_baseBH3_fromBase_analysis_AUC_cache/
    Ignored:    analysis/manuscript_drugResponses_cache/
    Ignored:    analysis/manuscript_overview_cache/
    Ignored:    data/.DS_Store
    Ignored:    output/.DS_Store

Untracked files:
    Untracked:  analysis/Annexin_rawInput.Rmd
    Untracked:  analysis/BH3baseline_analysis_fromBase.Rmd
    Untracked:  analysis/BH3baseline_analysis_fromDBP.Rmd
    Untracked:  analysis/BH3baseline_rawInput.Rmd
    Untracked:  analysis/BH3dynamic_rawInput.Rmd
    Untracked:  analysis/based_pep_var.pdf
    Untracked:  analysis/clinialTrial_analysis.Rmd
    Untracked:  analysis/compareBaseline.Rmd
    Untracked:  analysis/compareBaseline.pdf
    Untracked:  analysis/deprecated/
    Untracked:  analysis/drugResponse_baseBH3_analysis.Rmd
    Untracked:  analysis/drugResponse_baseBH3_analysis_AUC.Rmd
    Untracked:  analysis/dynamicBH3_analysis.Rmd
    Untracked:  analysis/dynamicBH3_analysis_AUC.Rmd
    Untracked:  analysis/landscape_baseBH3_analysis.Rmd
    Untracked:  analysis/landscape_baseBH3_analysis_AUC.Rmd
    Untracked:  analysis/landscape_baseBH3_fromBase_analysis_AUC.Rmd
    Untracked:  analysis/manuscript_clinicalAnalysis.Rmd
    Untracked:  analysis/manuscript_drugResponses.Rmd
    Untracked:  analysis/manuscript_dynamicBH3.Rmd
    Untracked:  analysis/manuscript_overview.Rmd
    Untracked:  analysis/manuscript_overview_fromBaseBH3.Rmd
    Untracked:  analysis/outcome_baseBH3_analysis.Rmd
    Untracked:  analysis/outcome_baseBH3_analysis_AUC.Rmd
    Untracked:  analysis/patBack.csv
    Untracked:  analysis/platePlot.pdf
    Untracked:  analysis/platePlot_dynamic.pdf
    Untracked:  analysis/predictOutcomes.Rmd
    Untracked:  analysis/pretreatment_effect_estiamtion.csv
    Untracked:  analysis/tableS1_sampleSummary.csv
    Untracked:  code/utils.R
    Untracked:  data/13092020 Patient Outcome Analysis - IBR plus FCR - for Junyan.xlsx
    Untracked:  data/Data for Thorsten .xlsx
    Untracked:  data/Raw data Baseline for Junyan.xlsx
    Untracked:  data/Raw data DBP for Junyan.xlsx
    Untracked:  data/T. Zenz data for Junyan.xlsx
    Untracked:  data/Zenz Project overview cell counts etc.xlsx
    Untracked:  data/commonFiles/
    Untracked:  figures/
    Untracked:  manuscript/
    Untracked:  output/baseBH3.RData
    Untracked:  output/dataAnnexin.RData
    Untracked:  output/dynamicBH3.RData

Unstaged changes:
    Modified:   _workflowr.yml
    Modified:   analysis/_site.yml
    Deleted:    analysis/about.Rmd
    Modified:   analysis/index.Rmd
    Deleted:    analysis/license.Rmd
Note that any generated files, e.g. HTML, png, CSS, etc., are not included in this status report because it is ok for generated content to have uncommitted changes.
There are no past versions. Publish this analysis with wflow_publish() to start tracking its development.
Load and preprocess BH3 profiling data
Load
Use baseline level from DBP profiling
Prepare sample background annotations
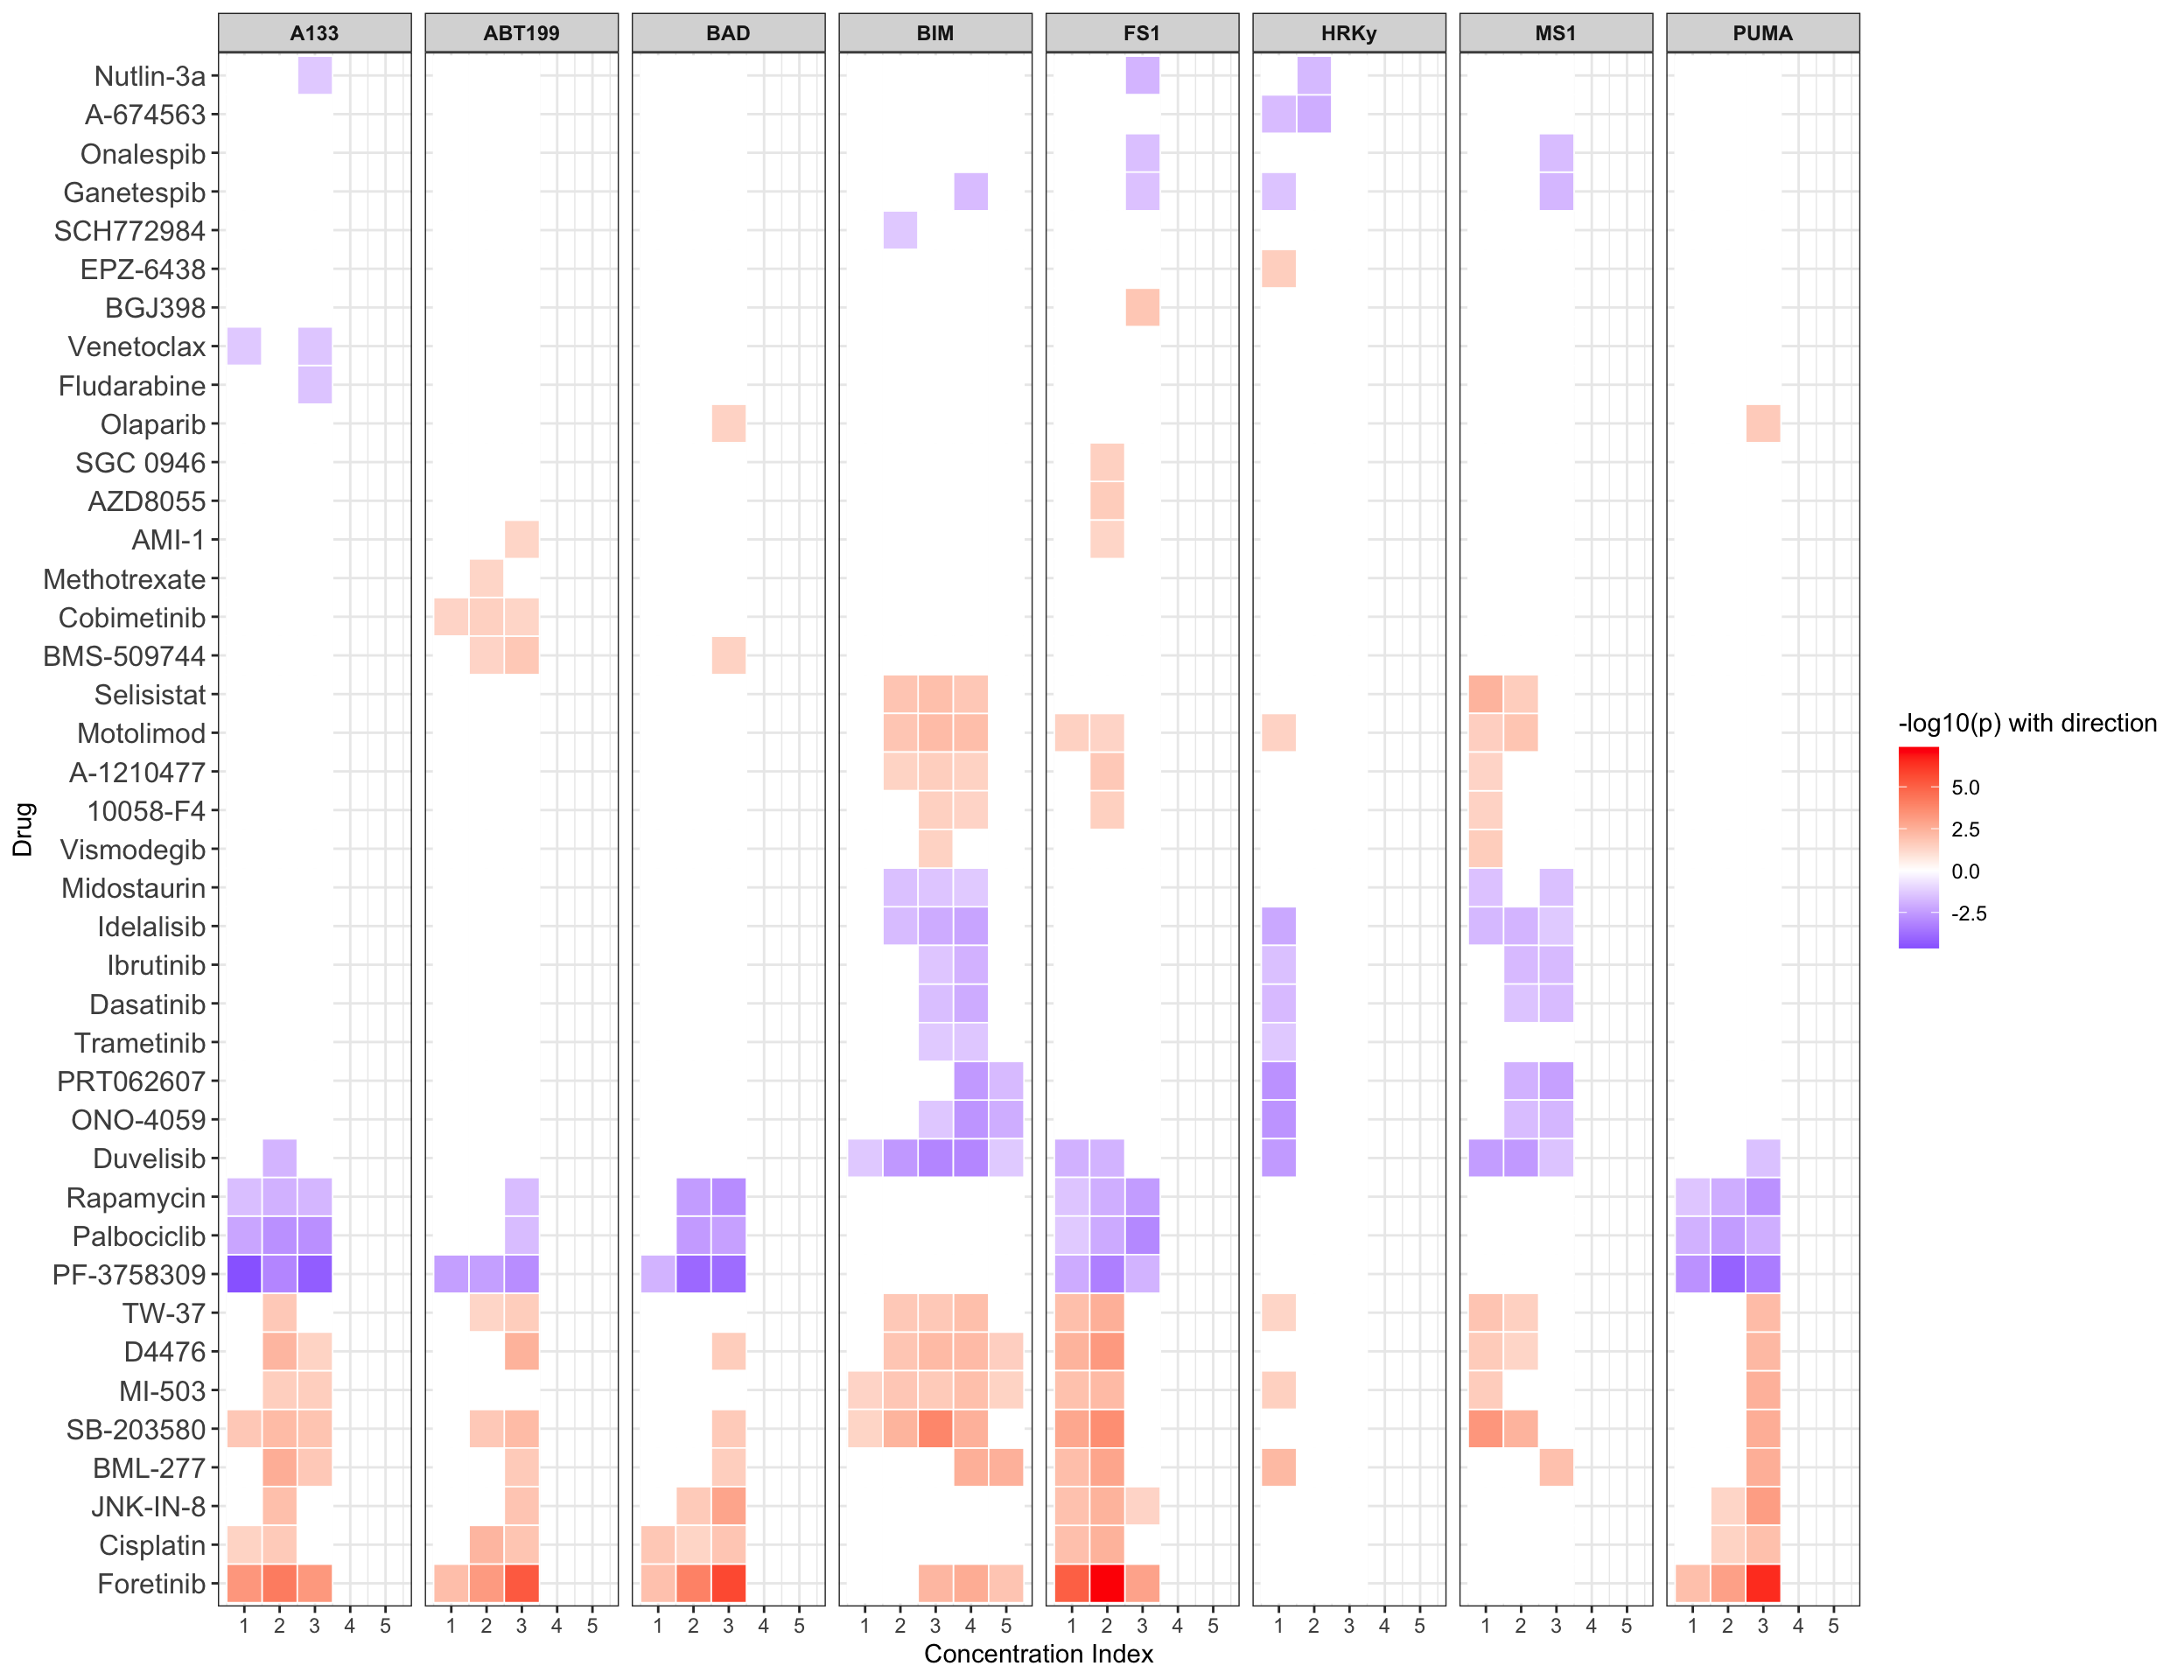
Association with ex-vivo drug responses (IC50 screen)
Preprocessing
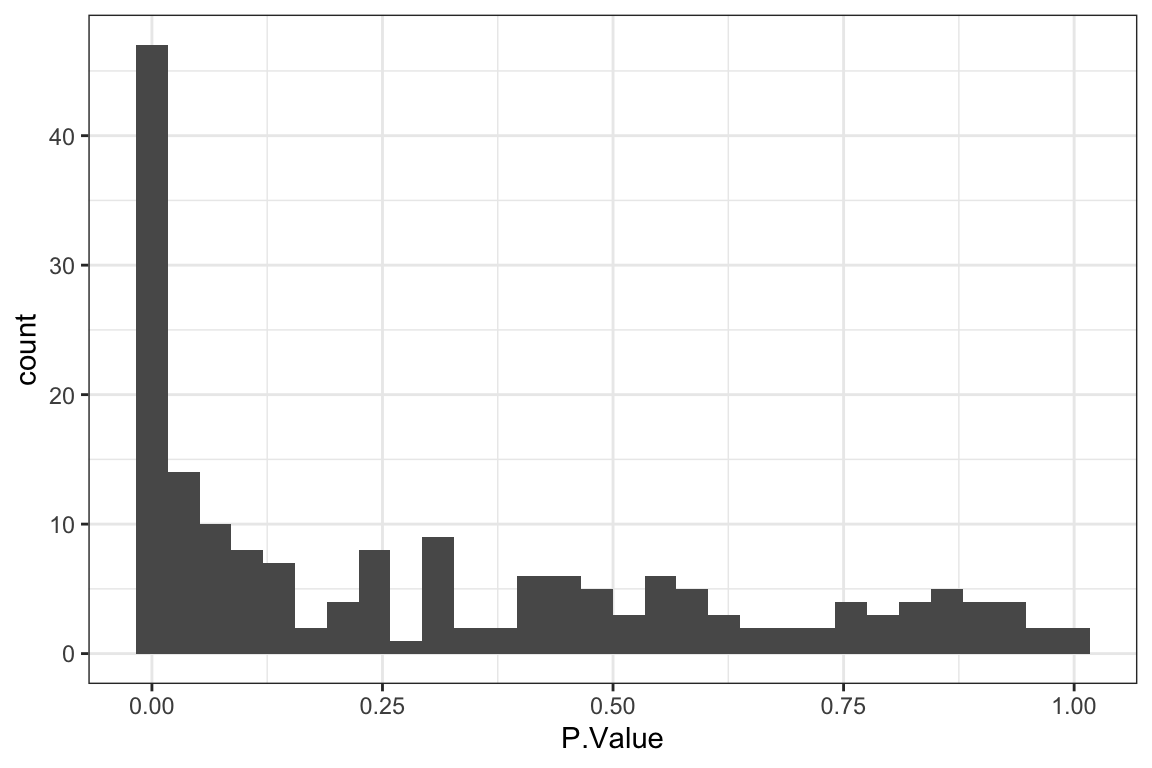
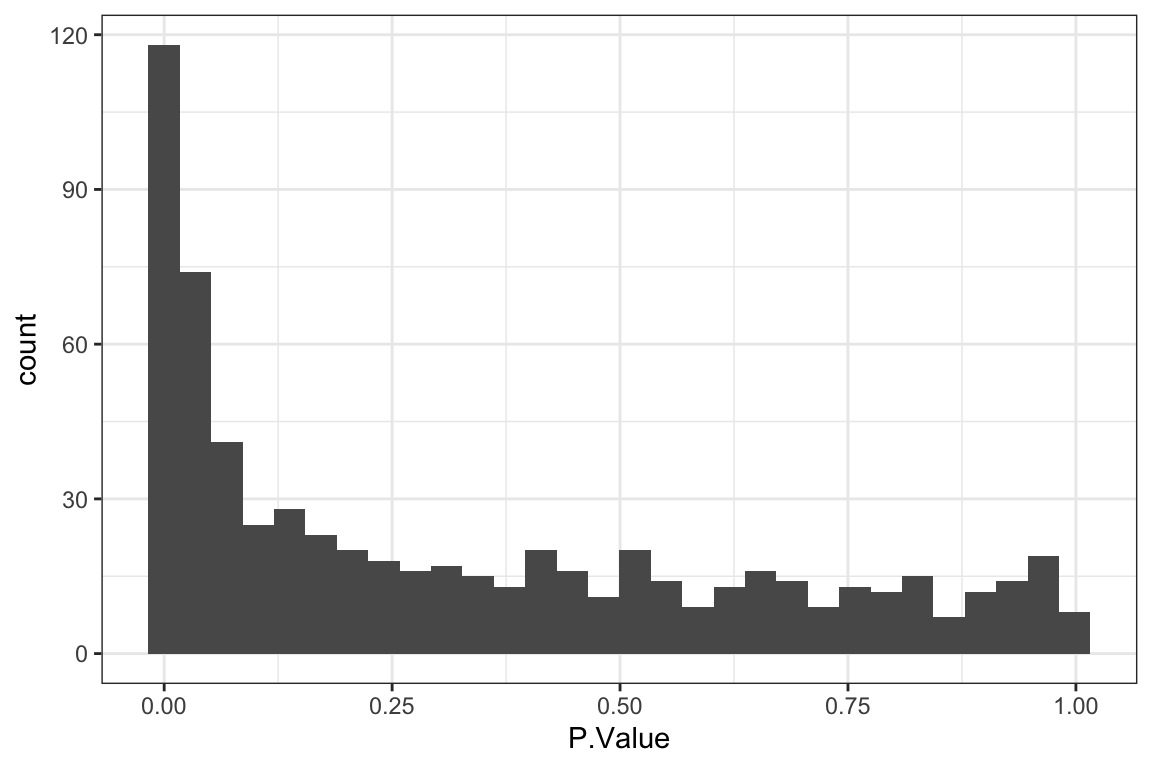
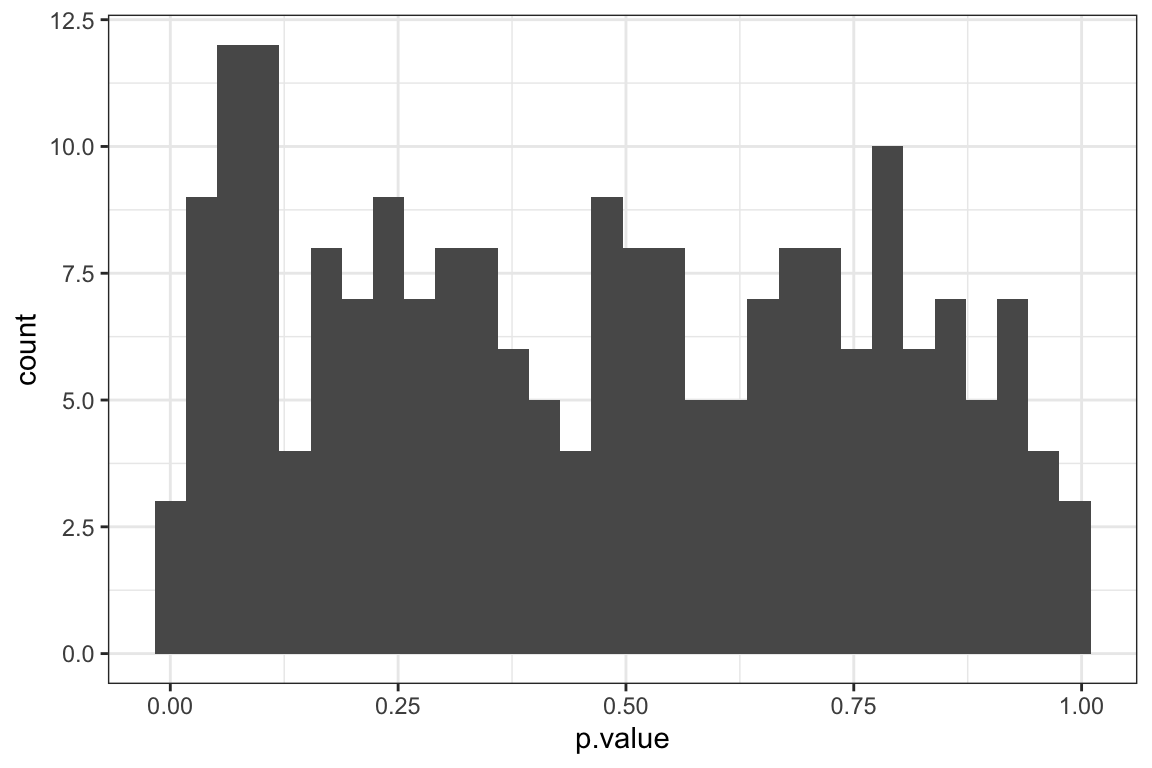
[1] 52P-value histogram
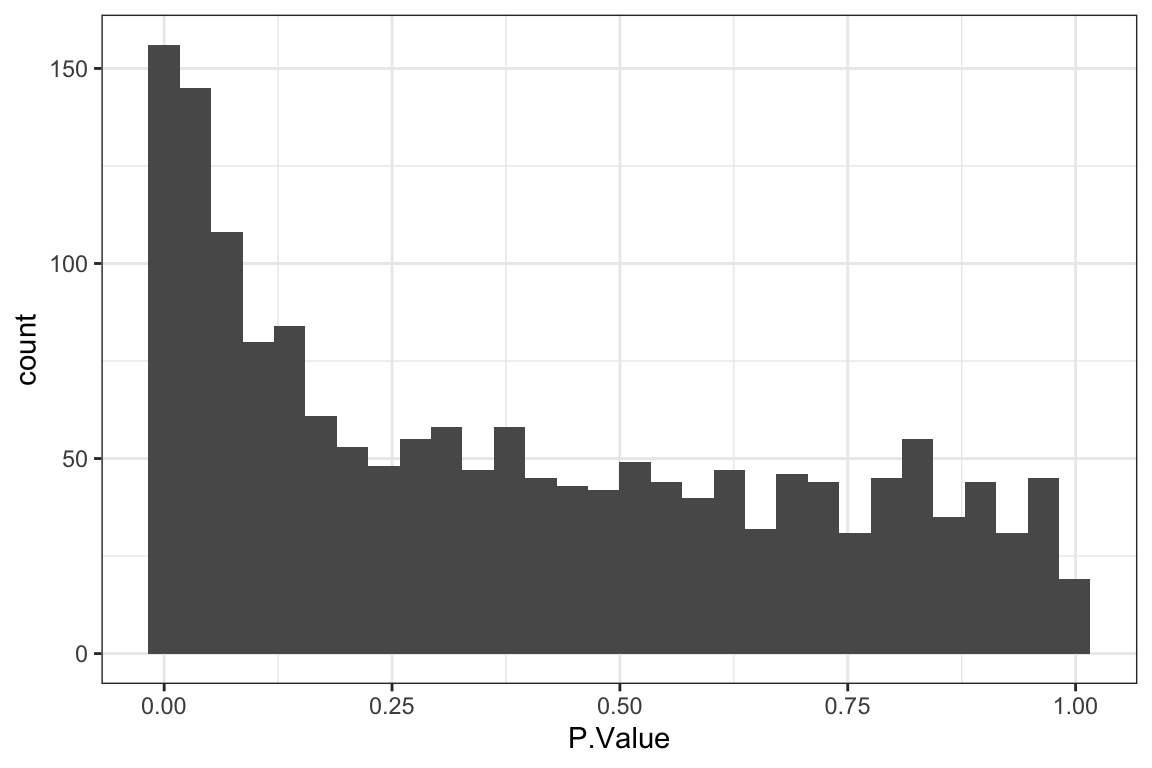
Table of significant correlations
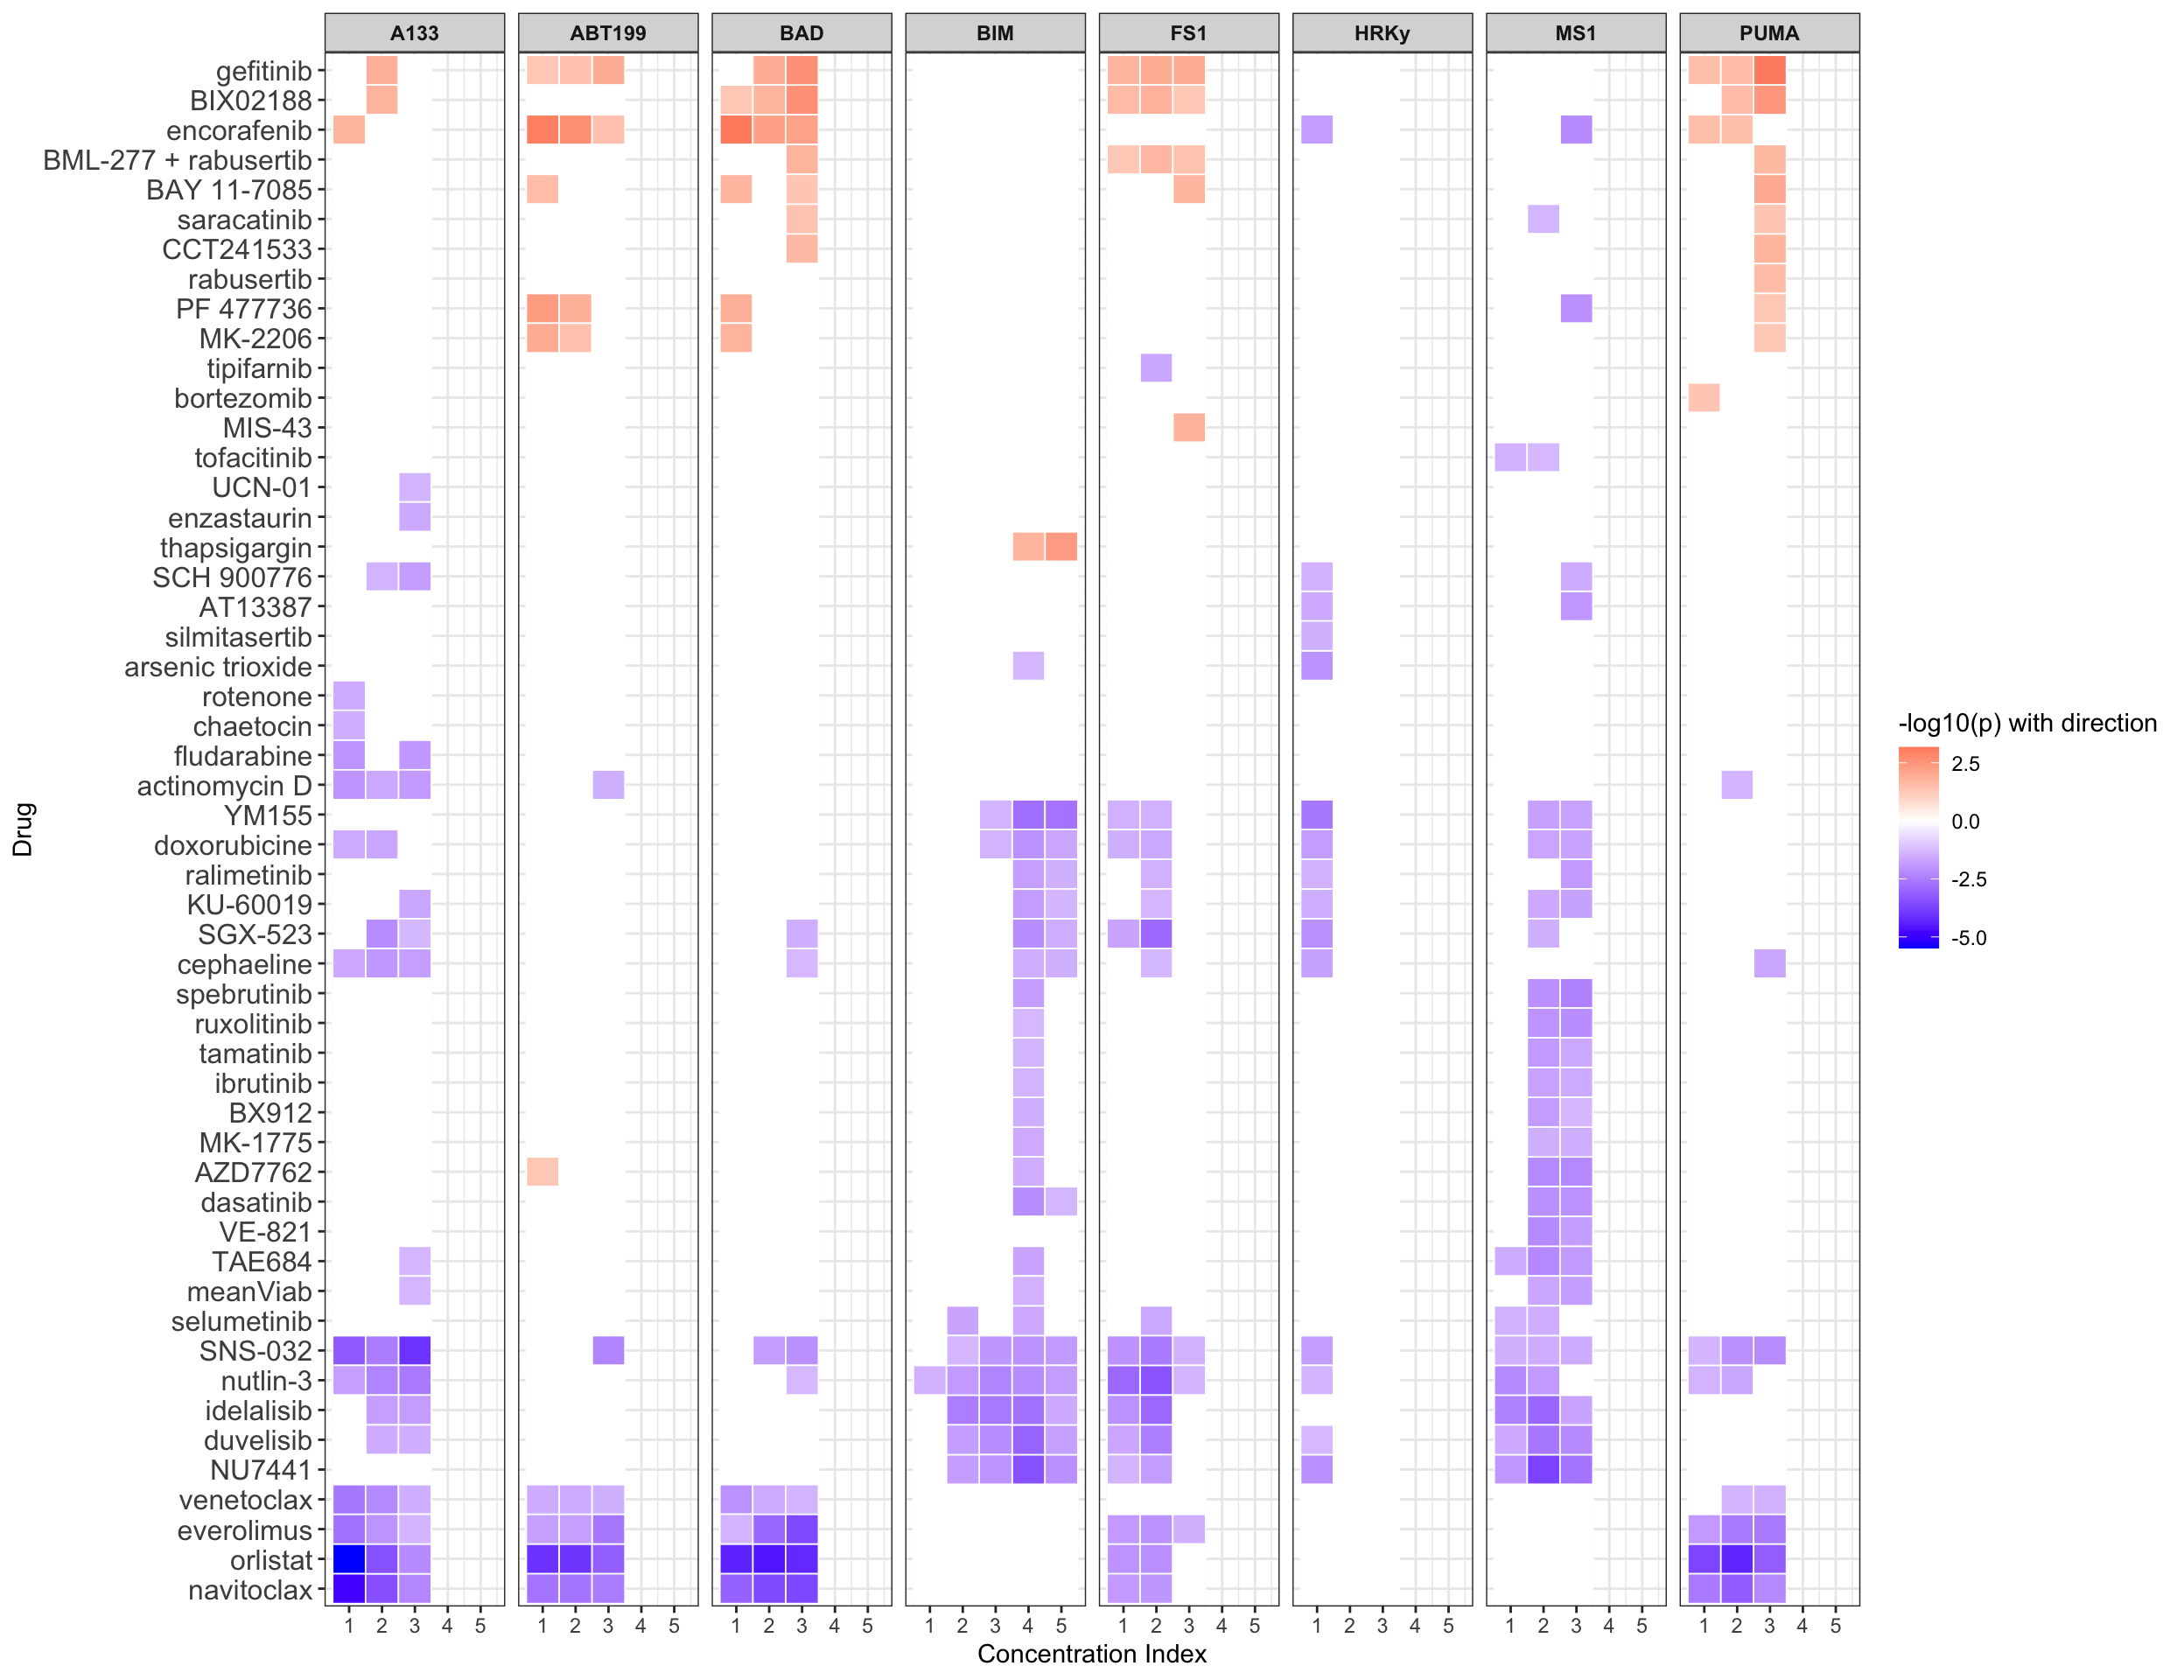
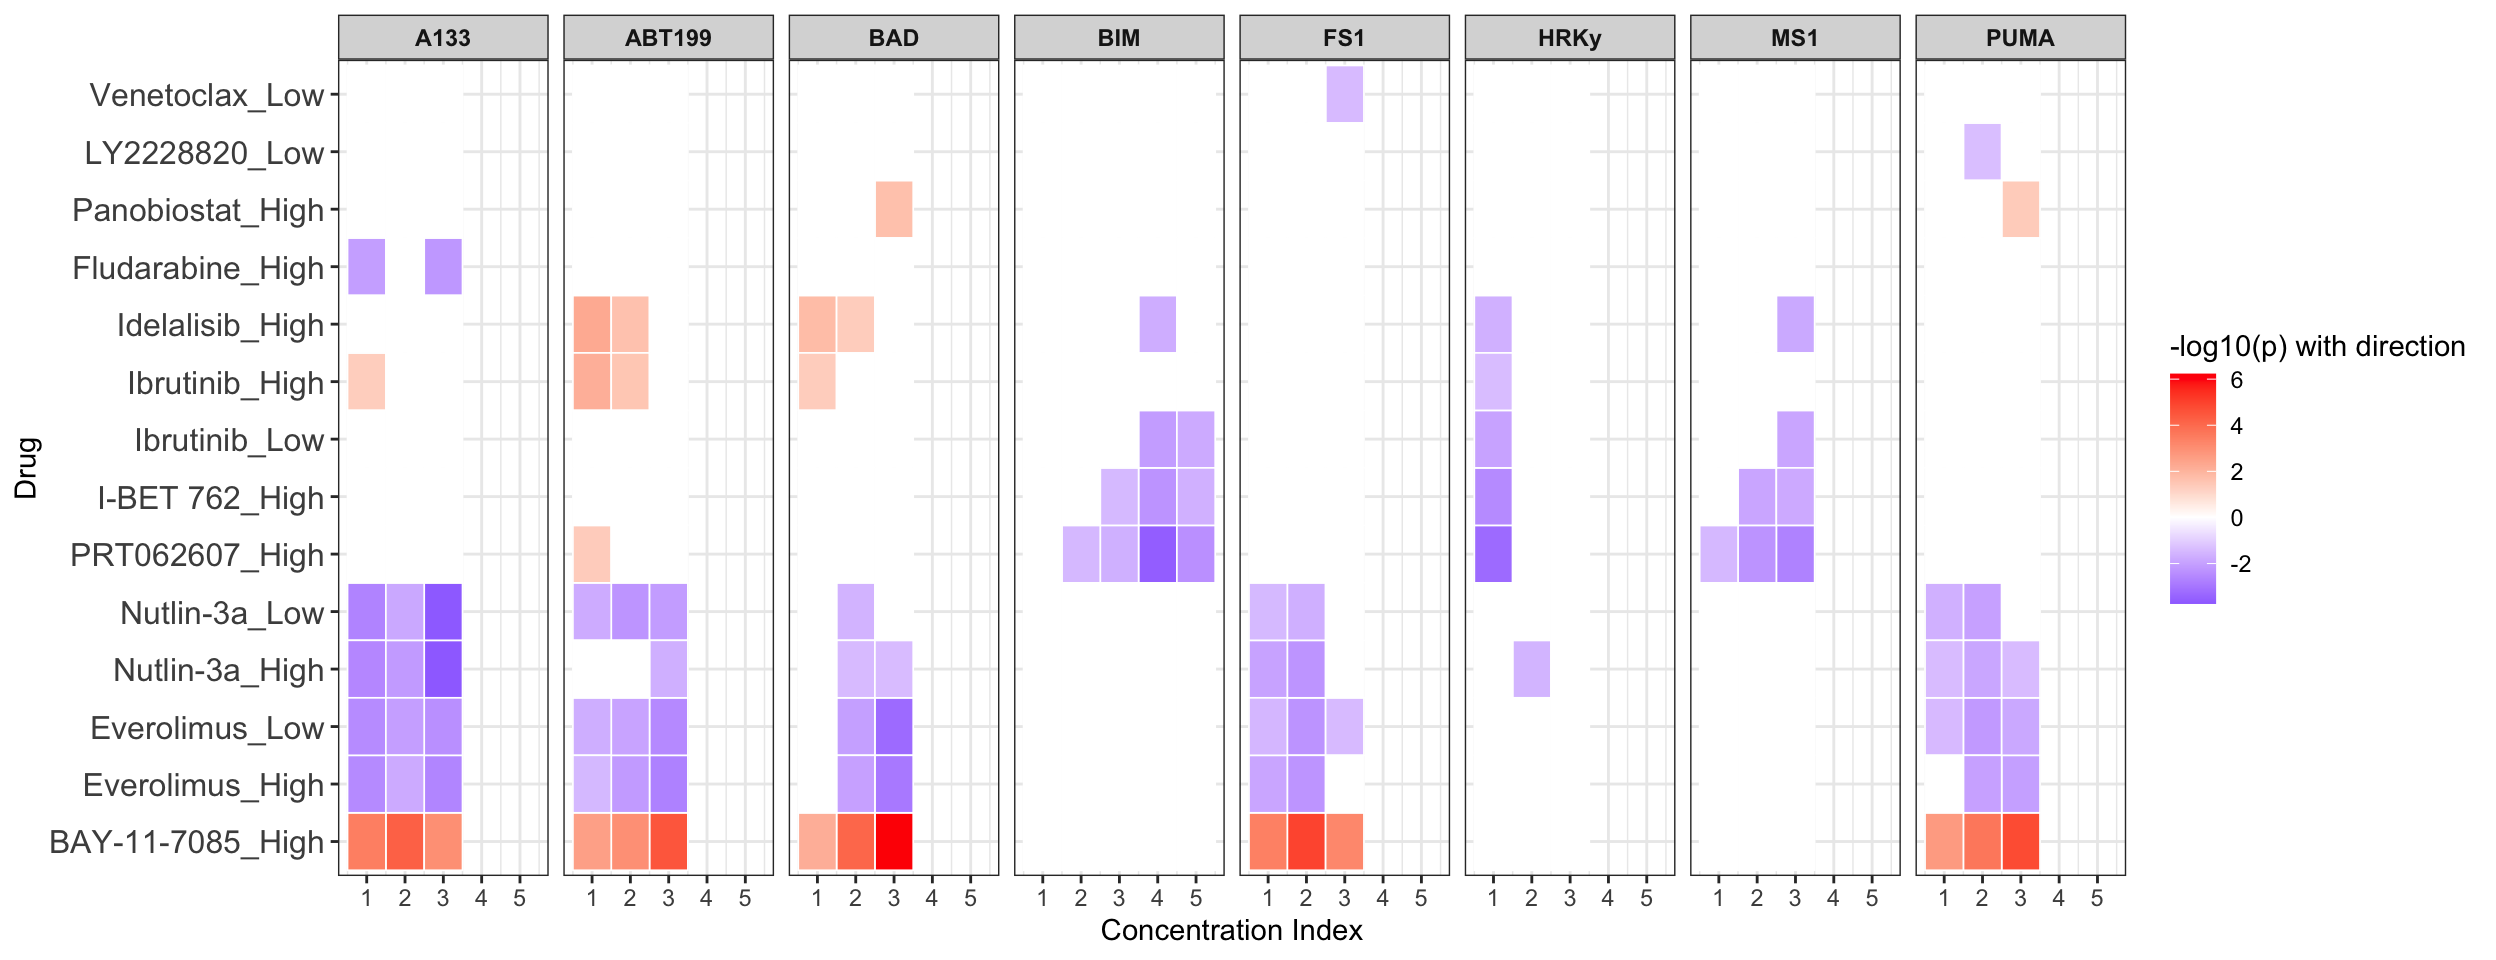
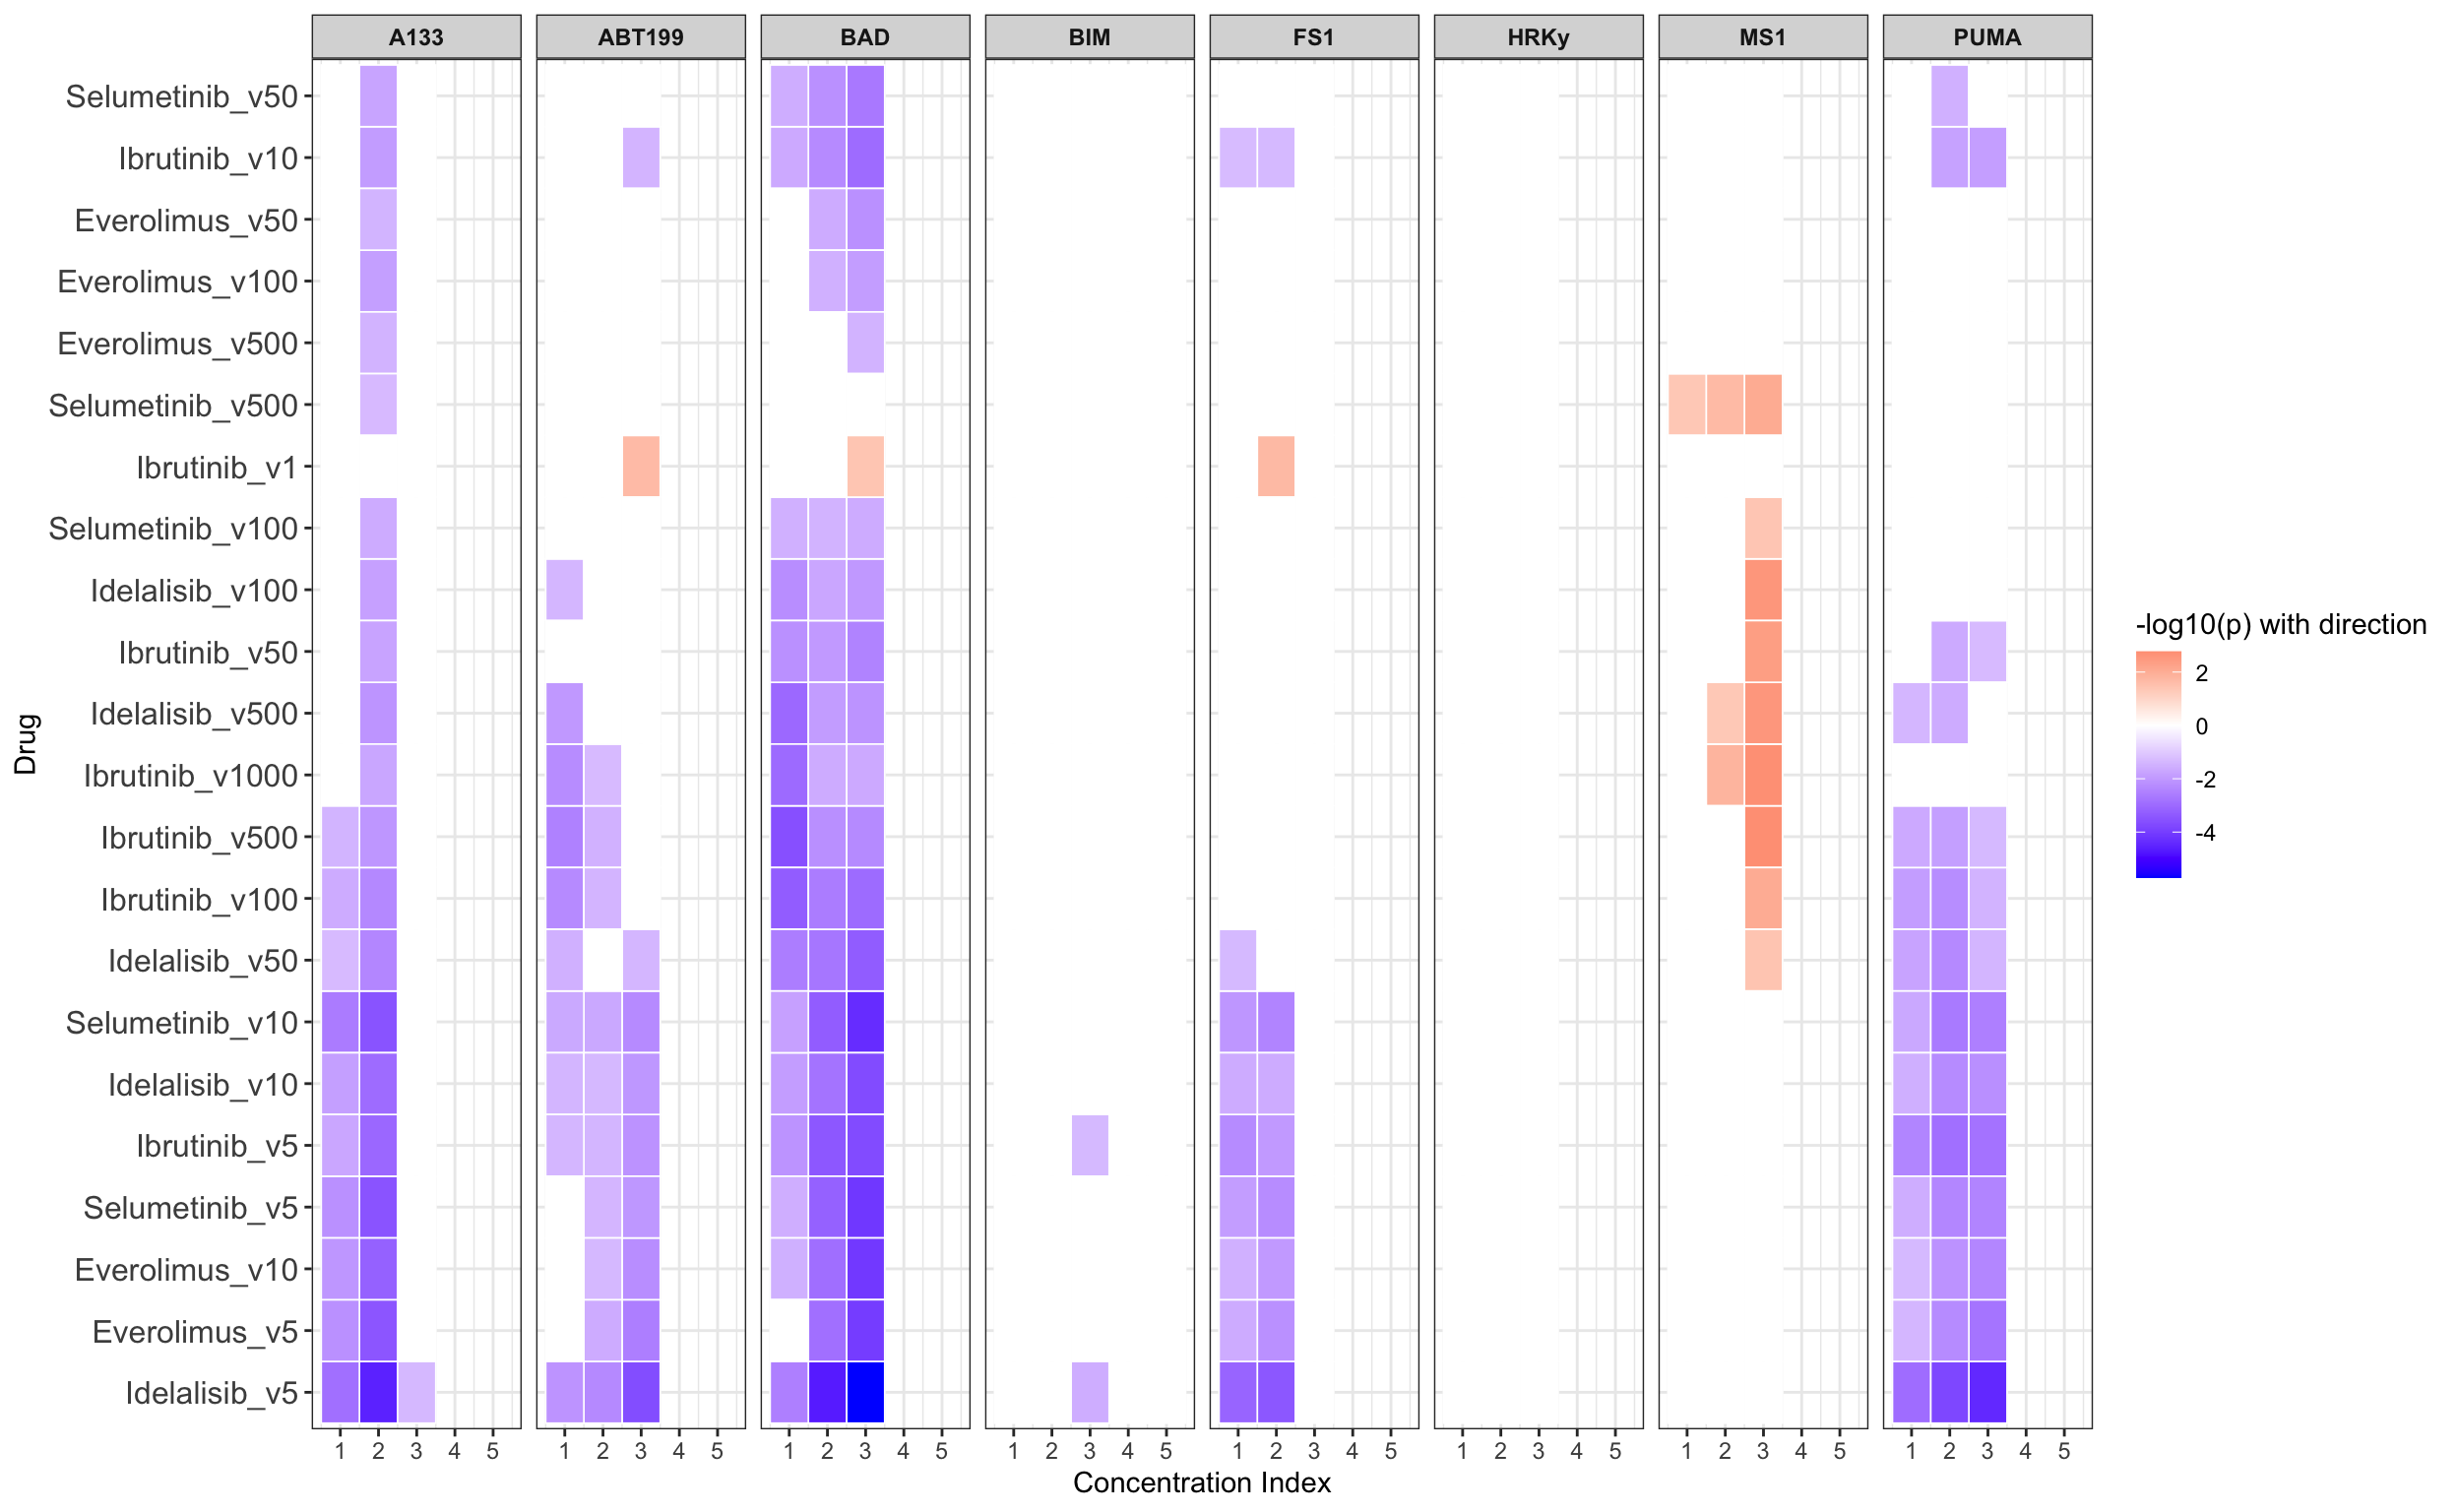
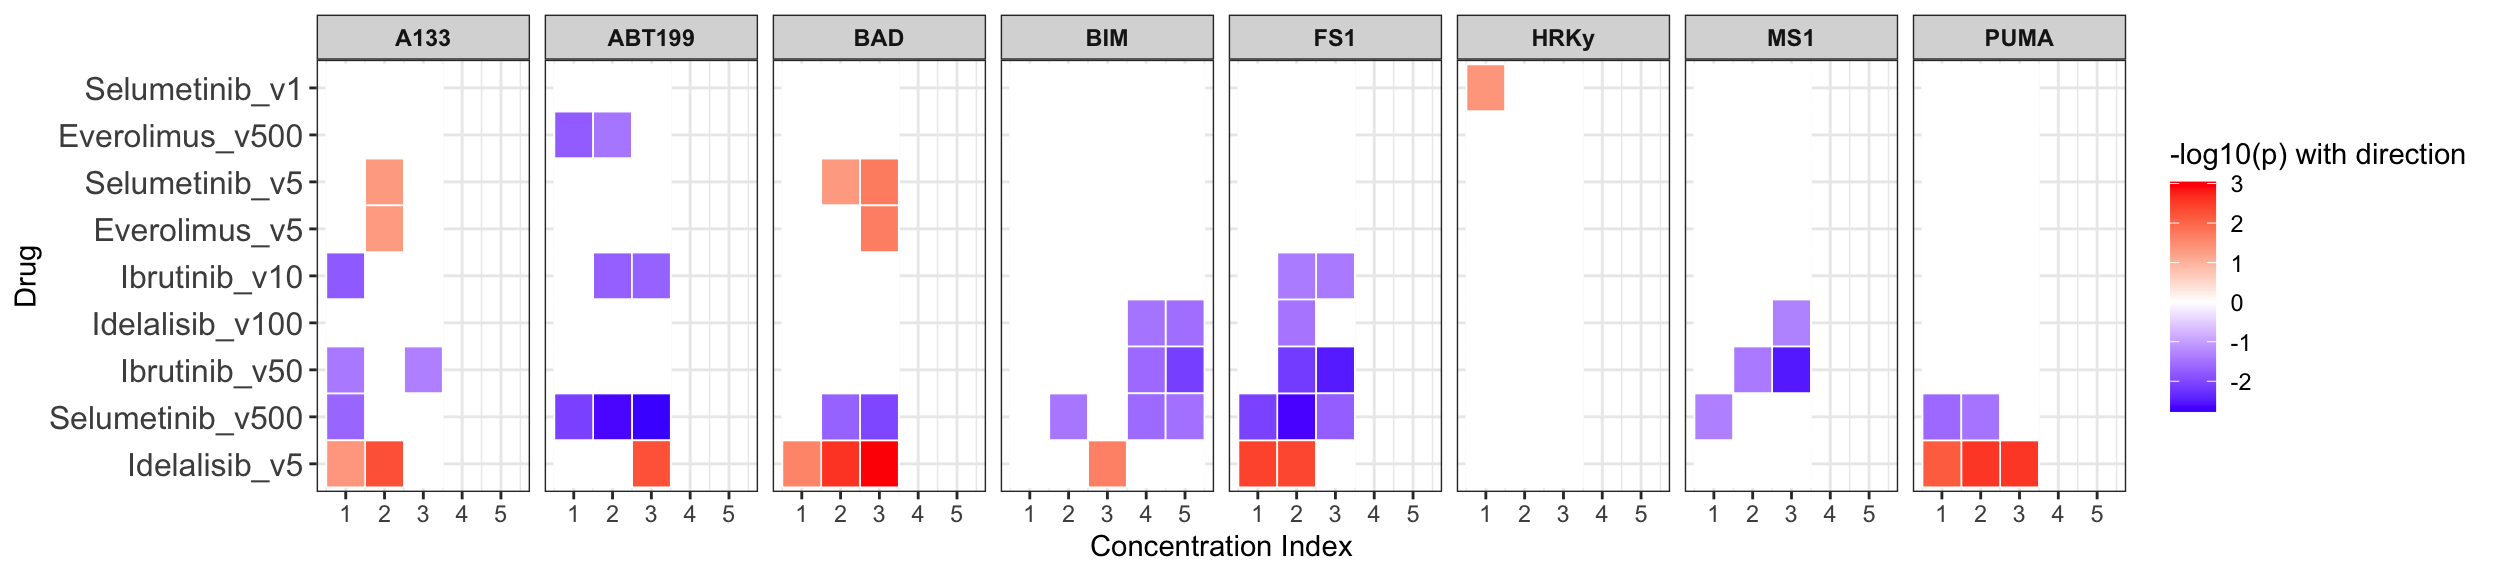
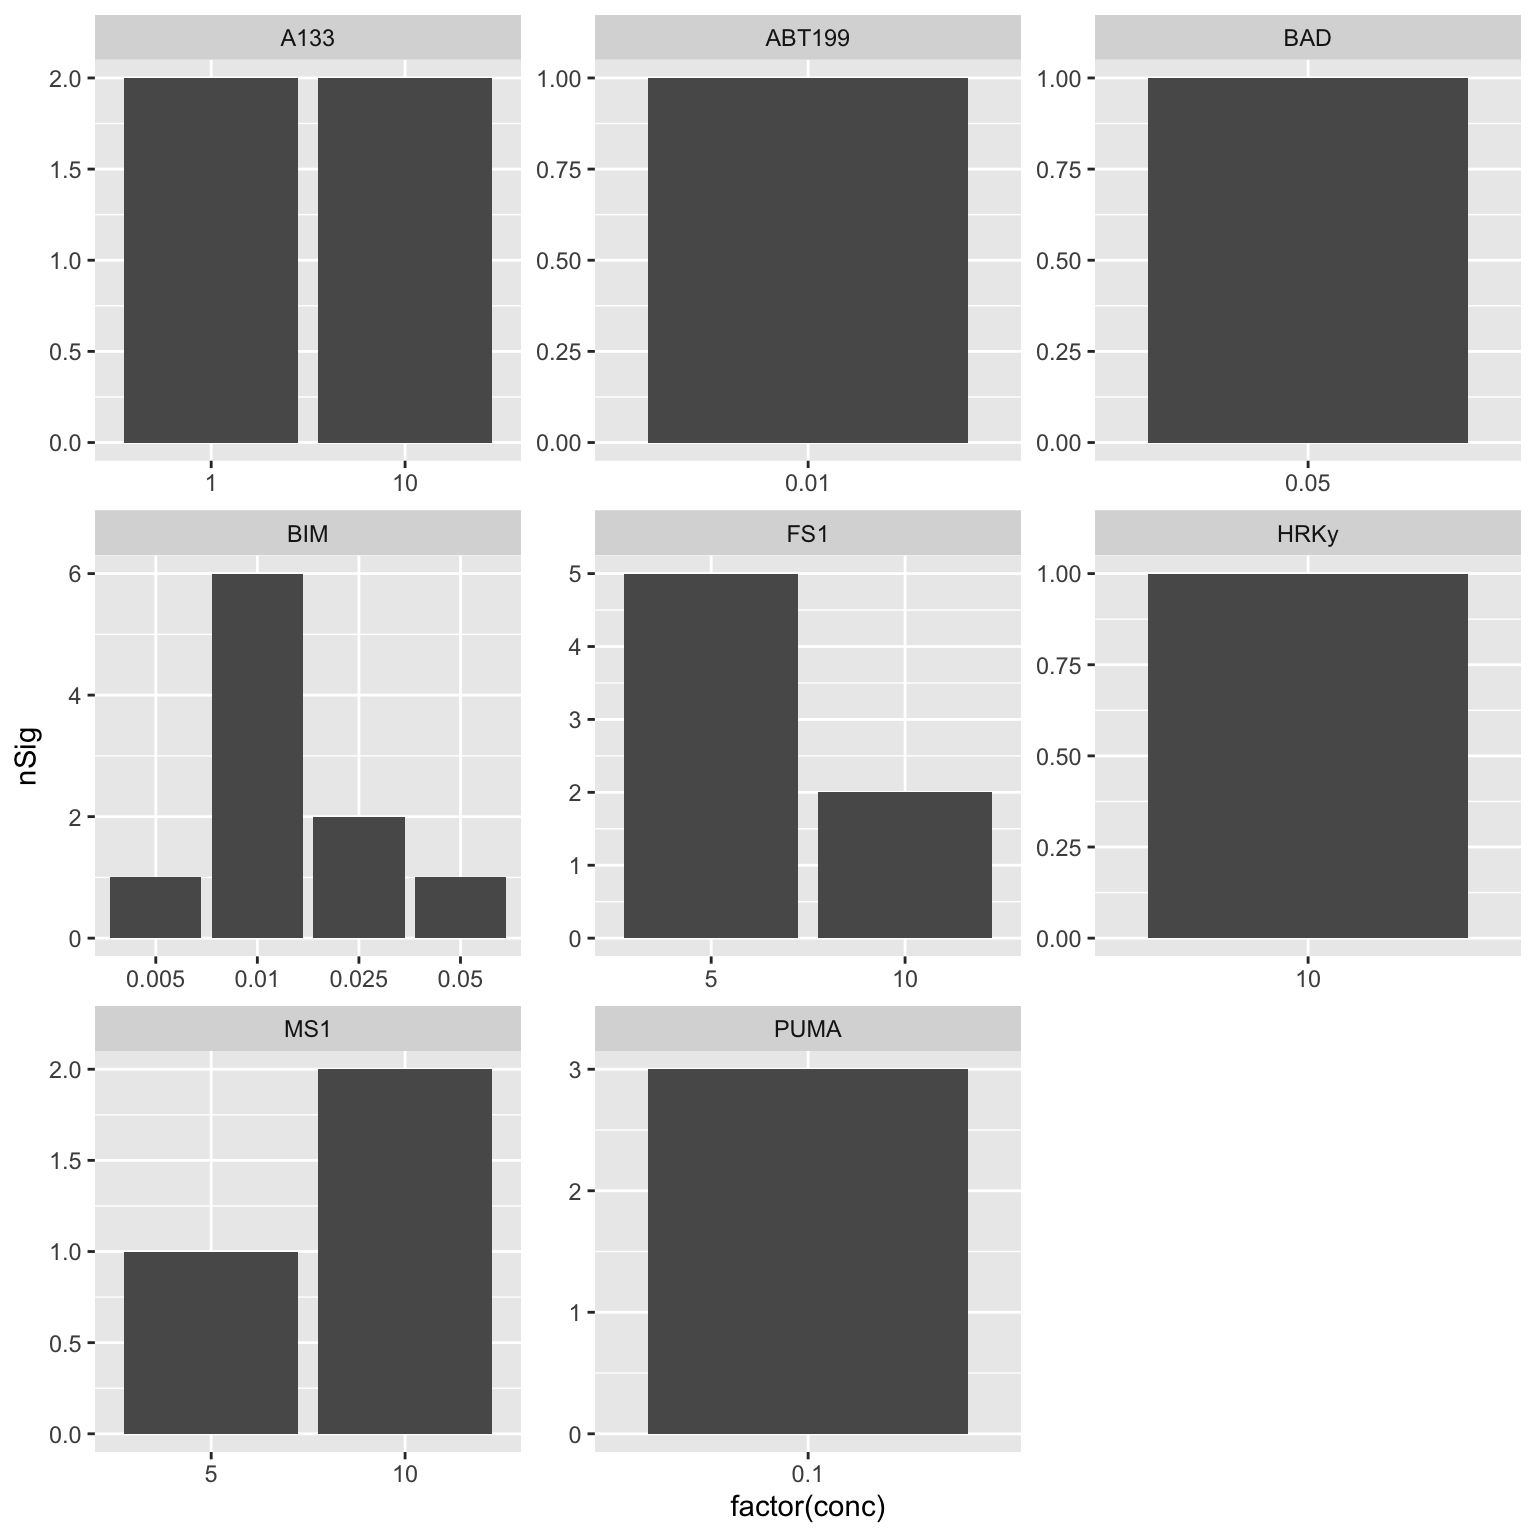
Summarise plot for all concentrations
Scatter plots showing significant correlations (1% FDR)
If multiple concentrations are identified as significant, only show the most significant concentration. 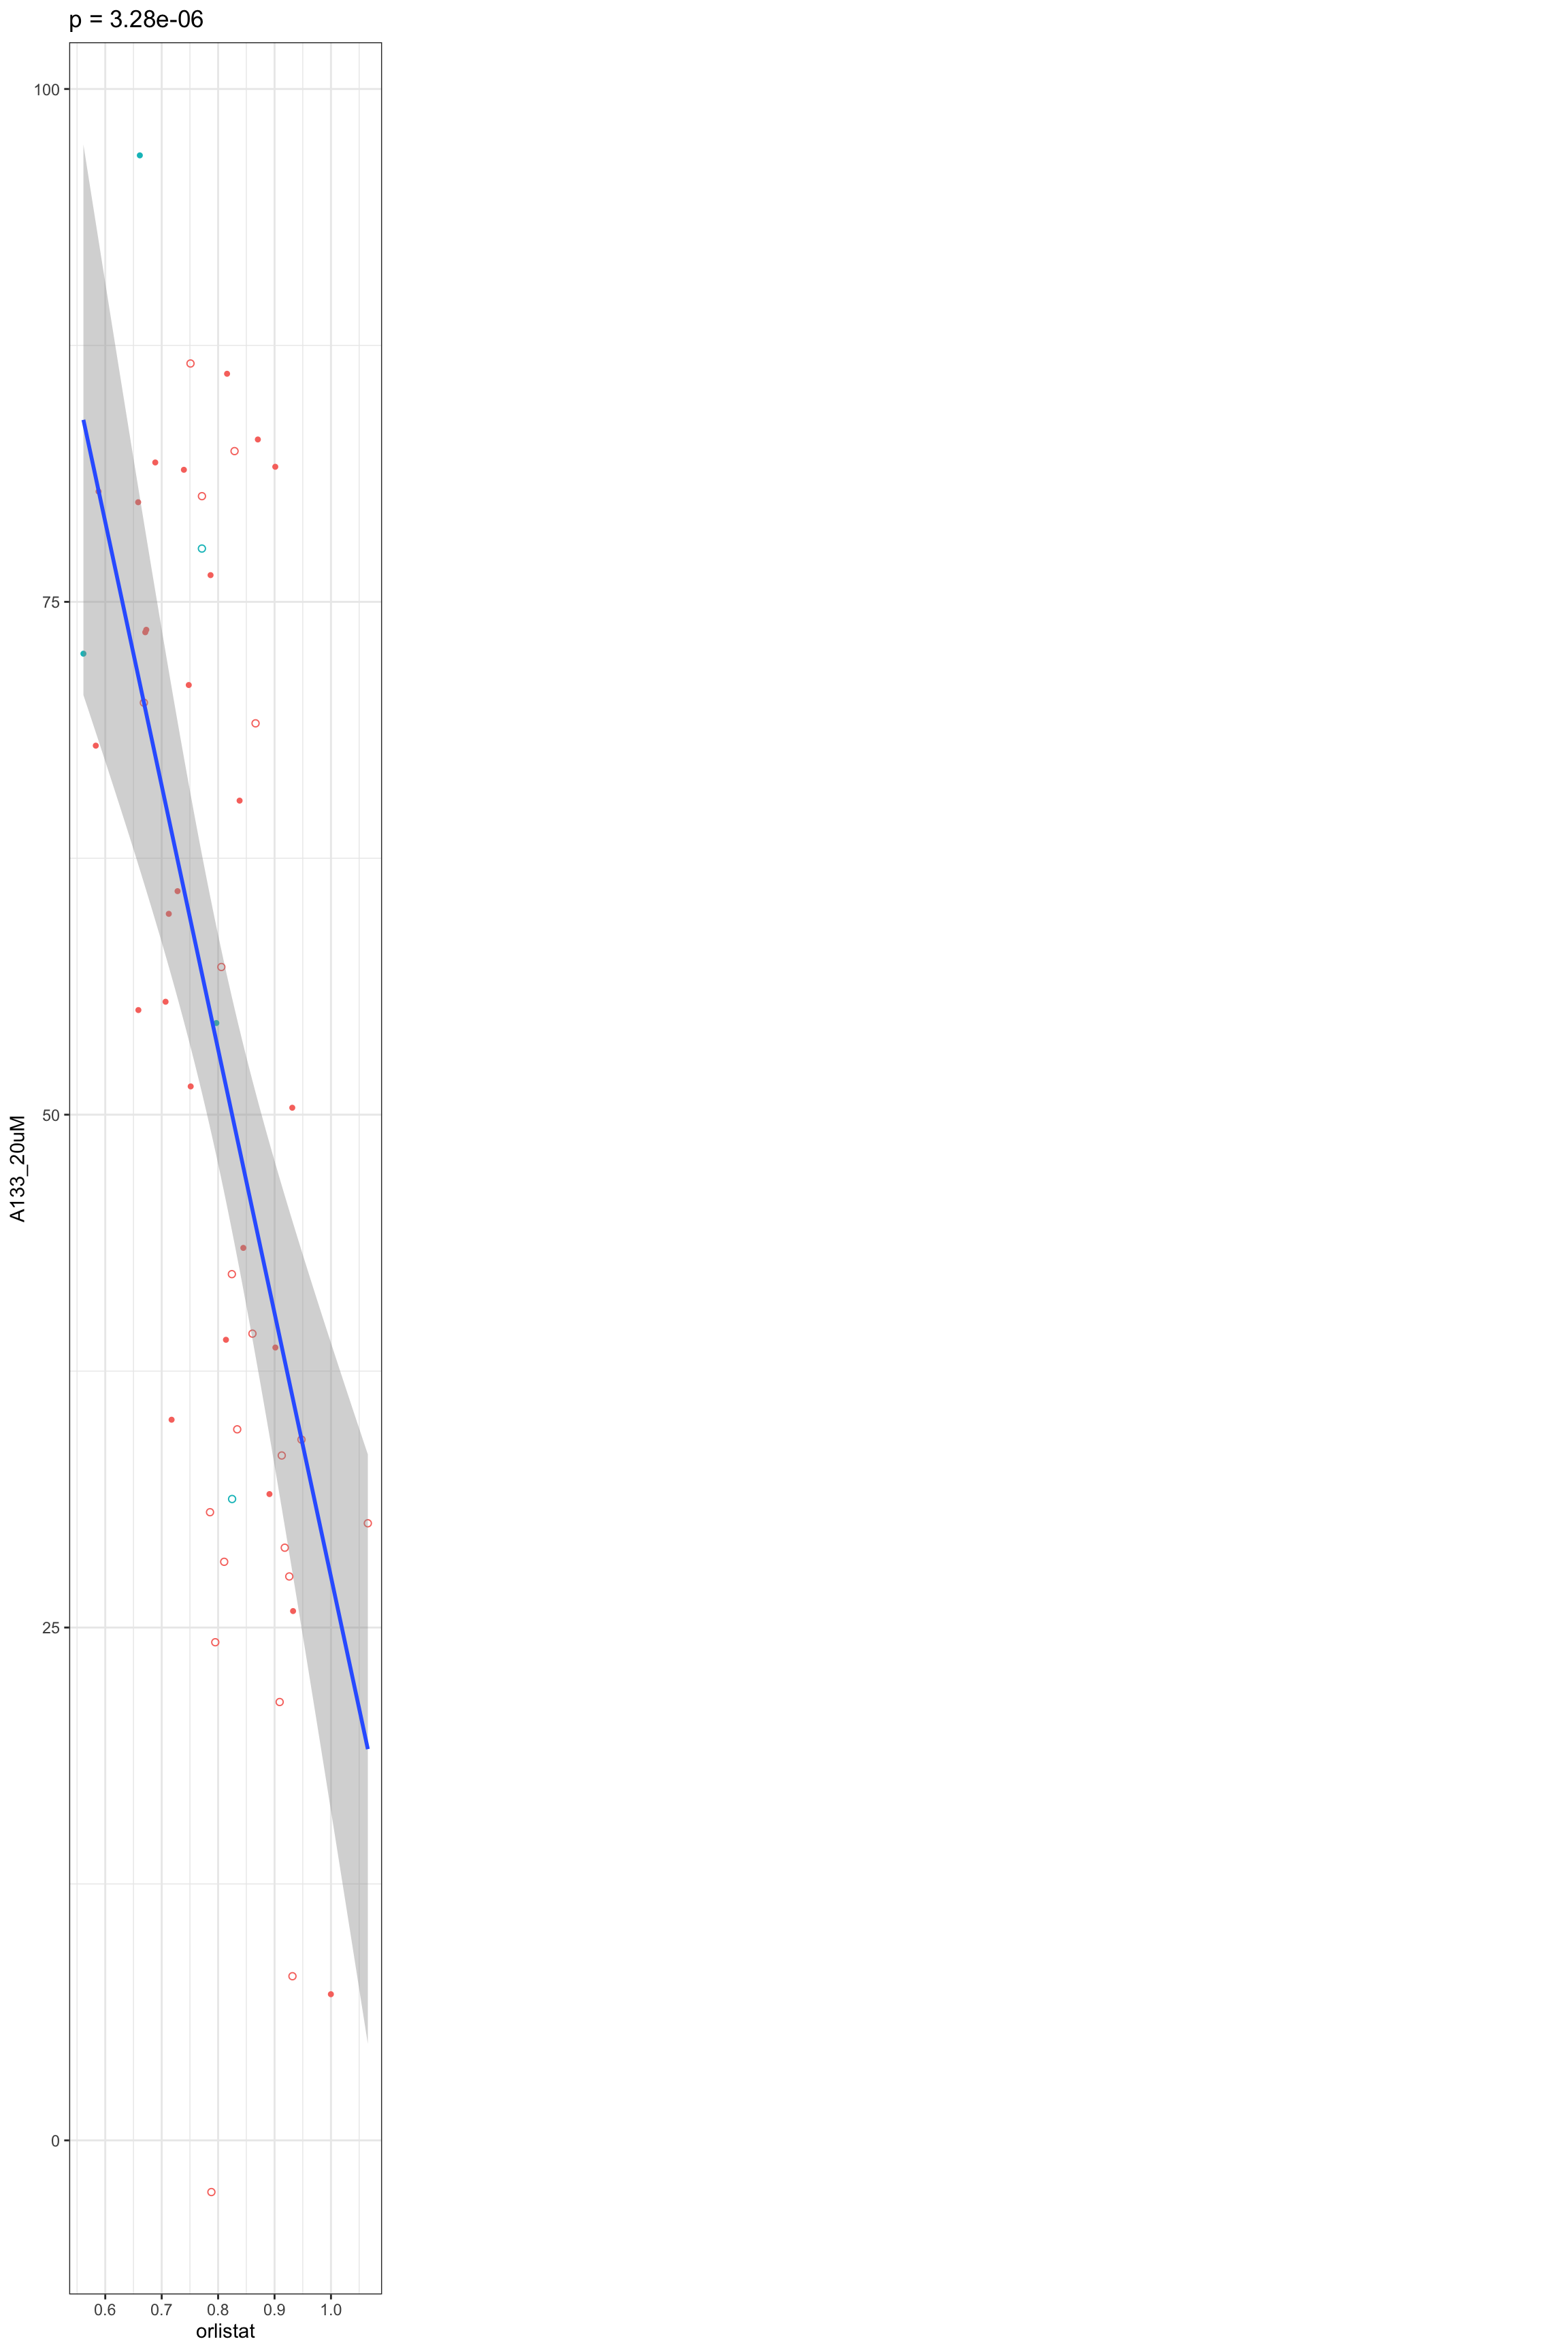 x-axis is the cell viability after drug treatment, so higher values mean higher drug resistance
Association with ex-vivo drug responses (1000CPS screen)
Preprocessing
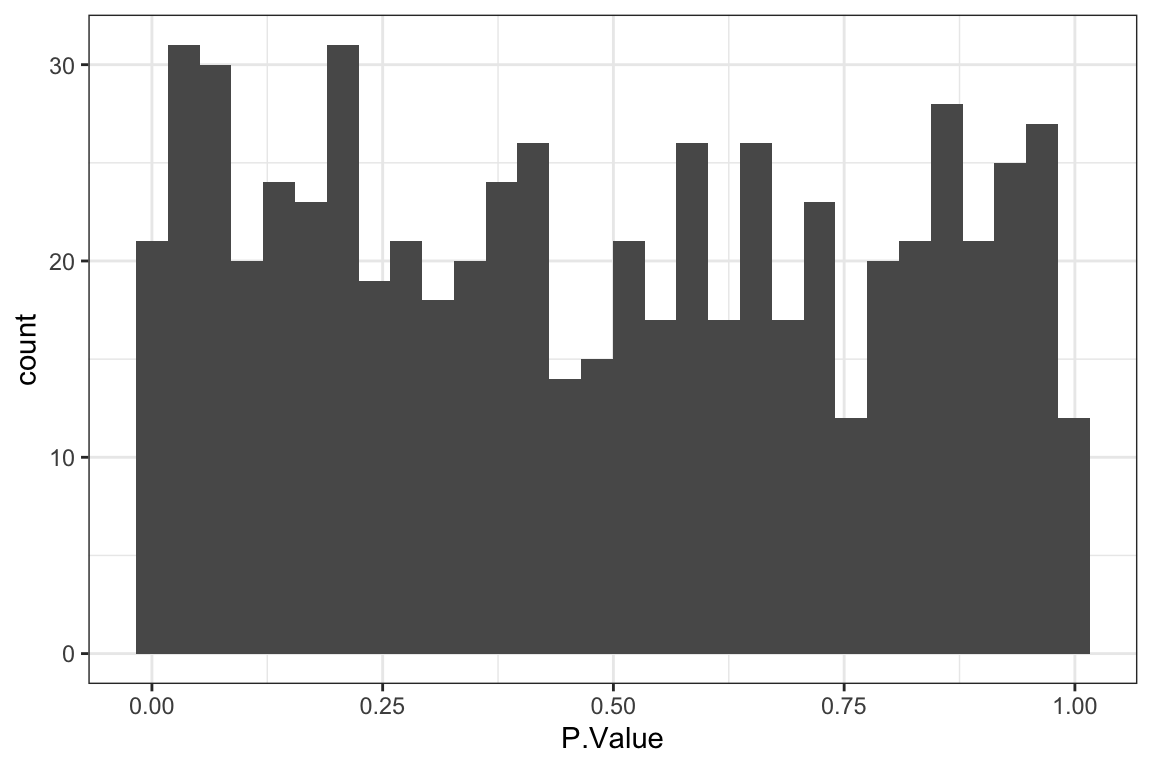
[1] 59[1] 26 59P-value histogram
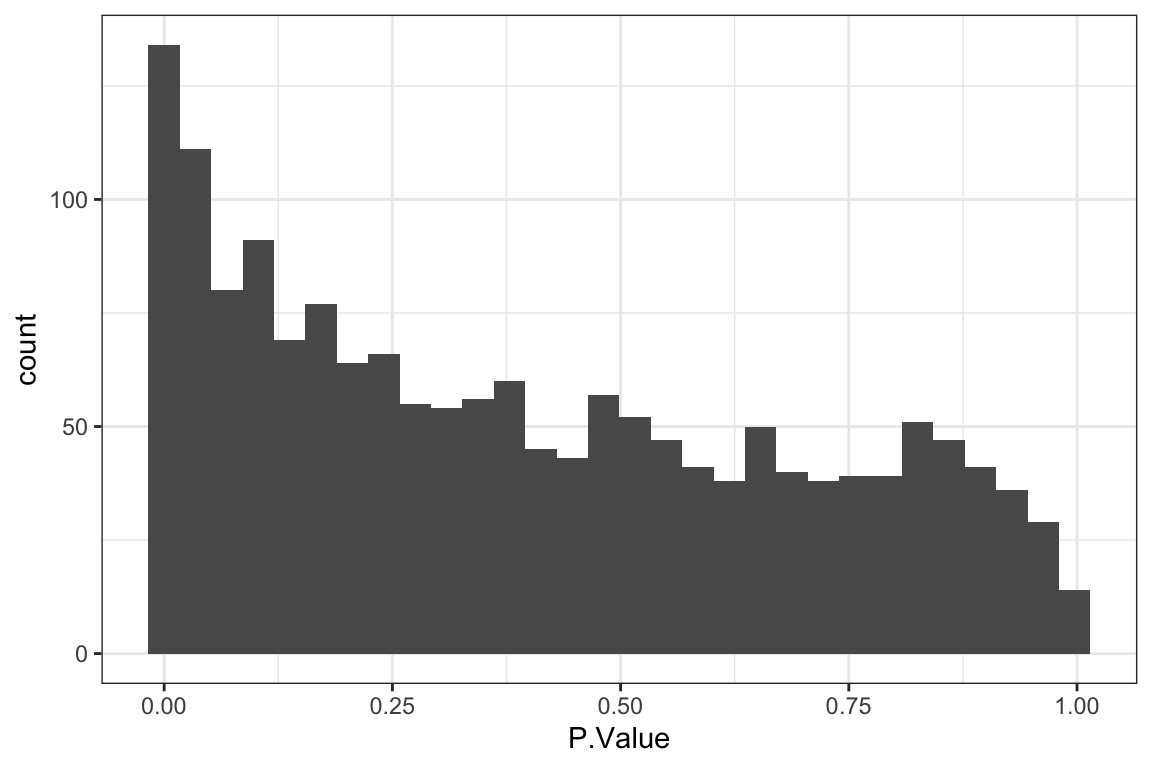
Table of significant correlations
Summarise plot for all concentrations
Scatter plots showing significant correlations (5% FDR)
If multiple concentrations are identified as significant, only show the most significant concentration. 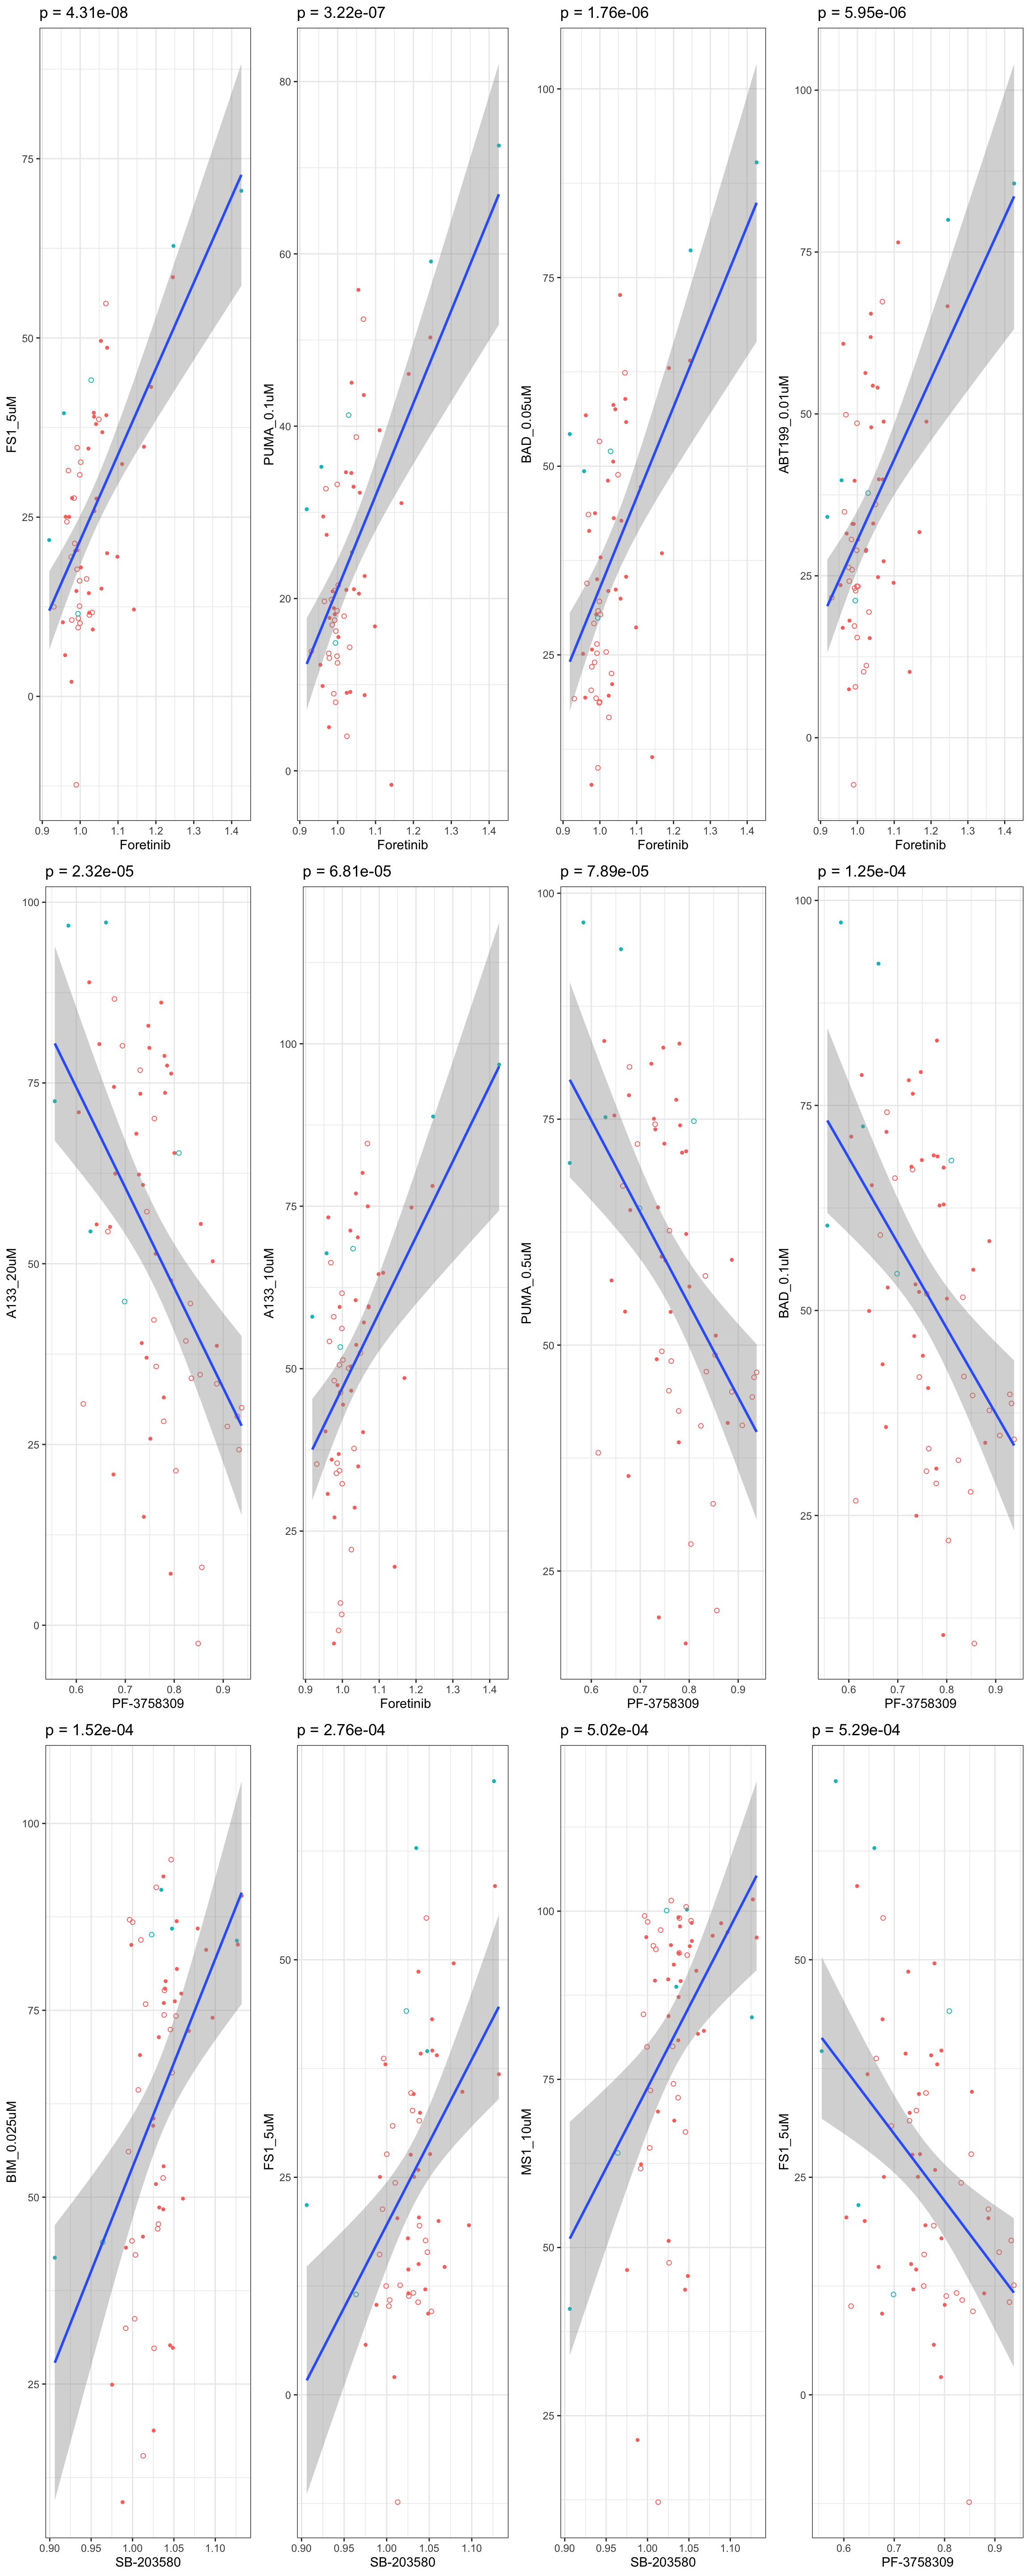 x-axis is the cell viability after drug treatment, so higher values mean higher drug resistance
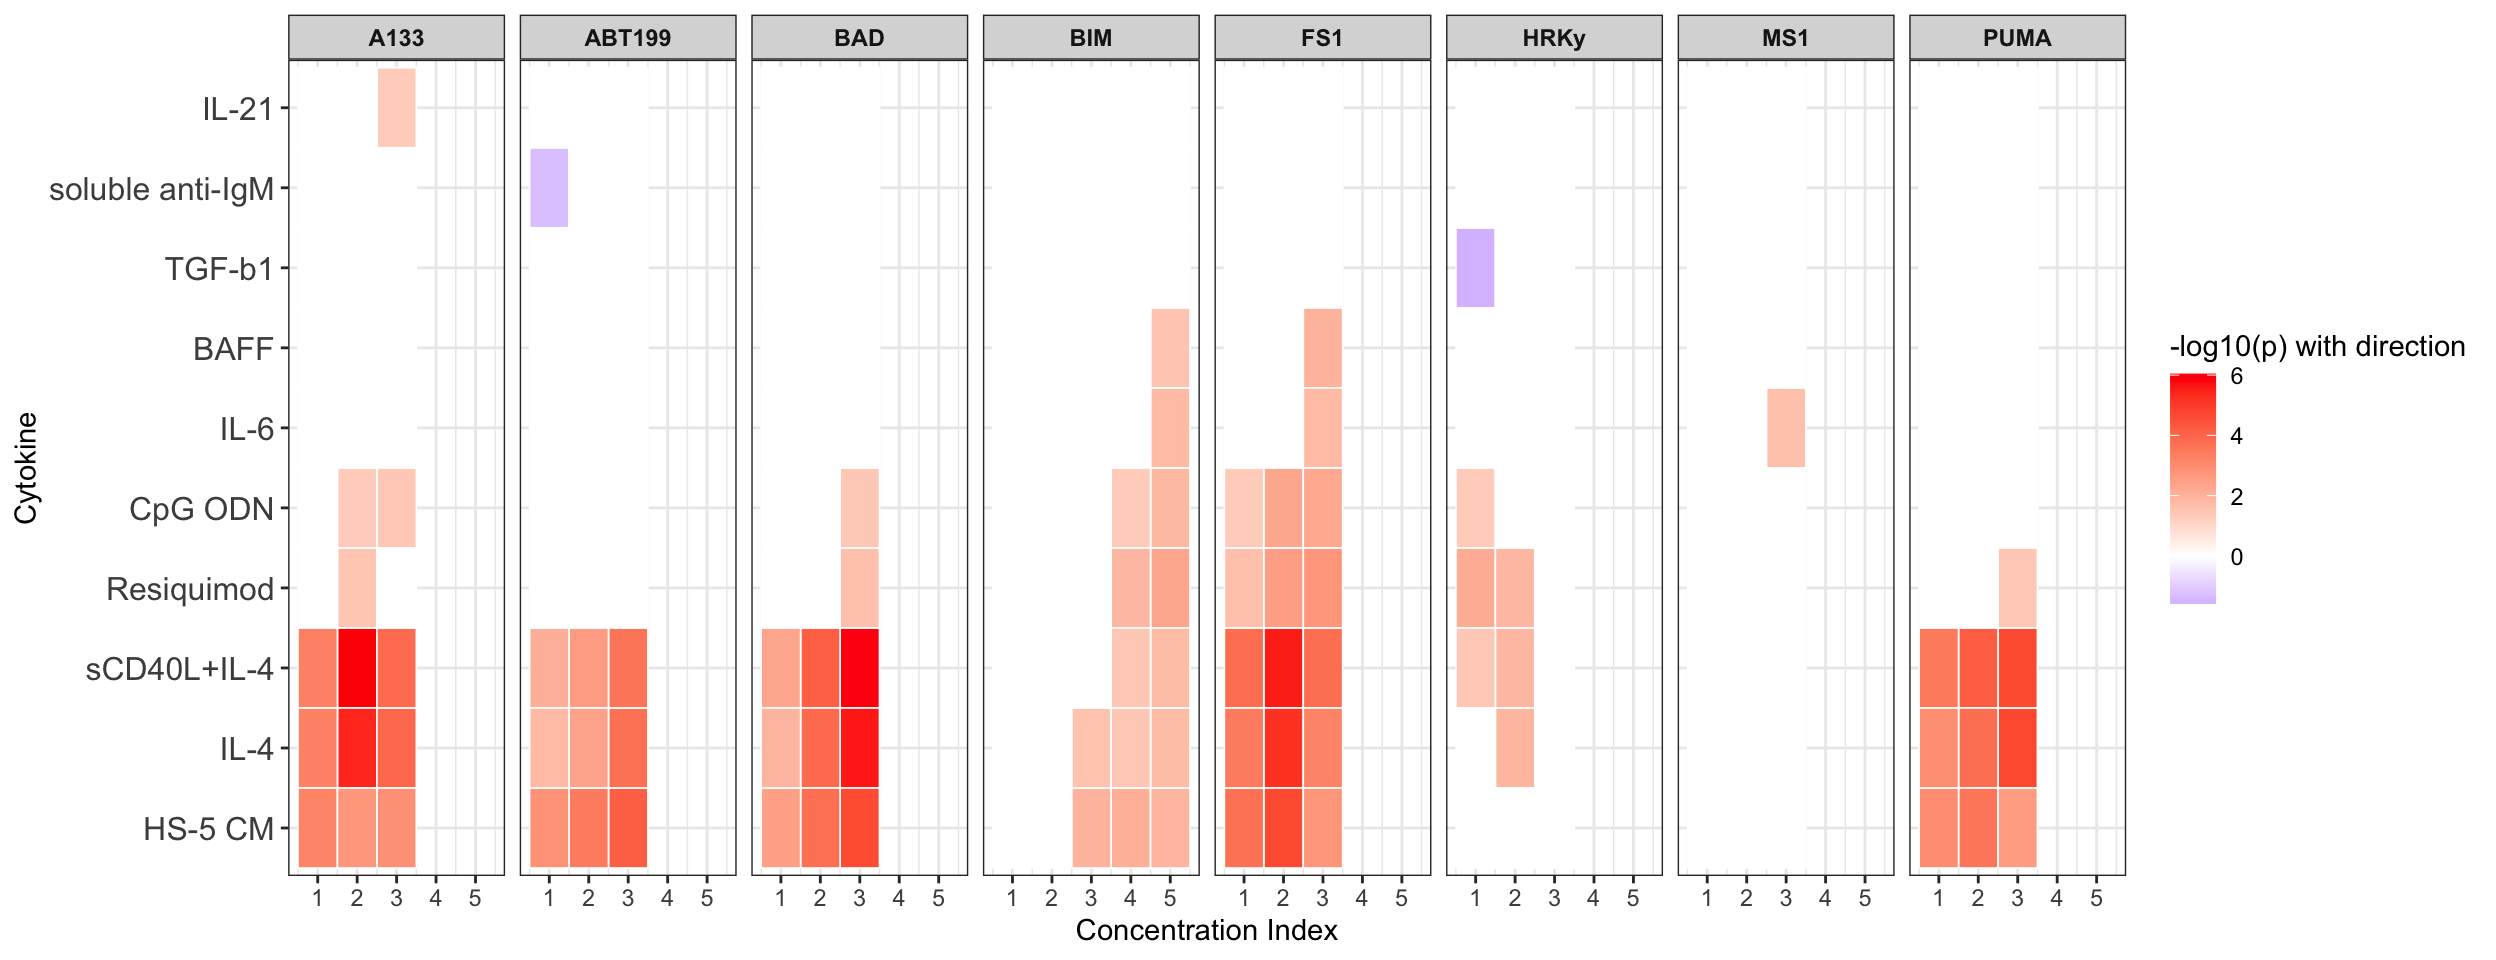
Association with cytokine screen
Preprocessing
[1] 60[1] 521 60[1] 26 60P-value histogram
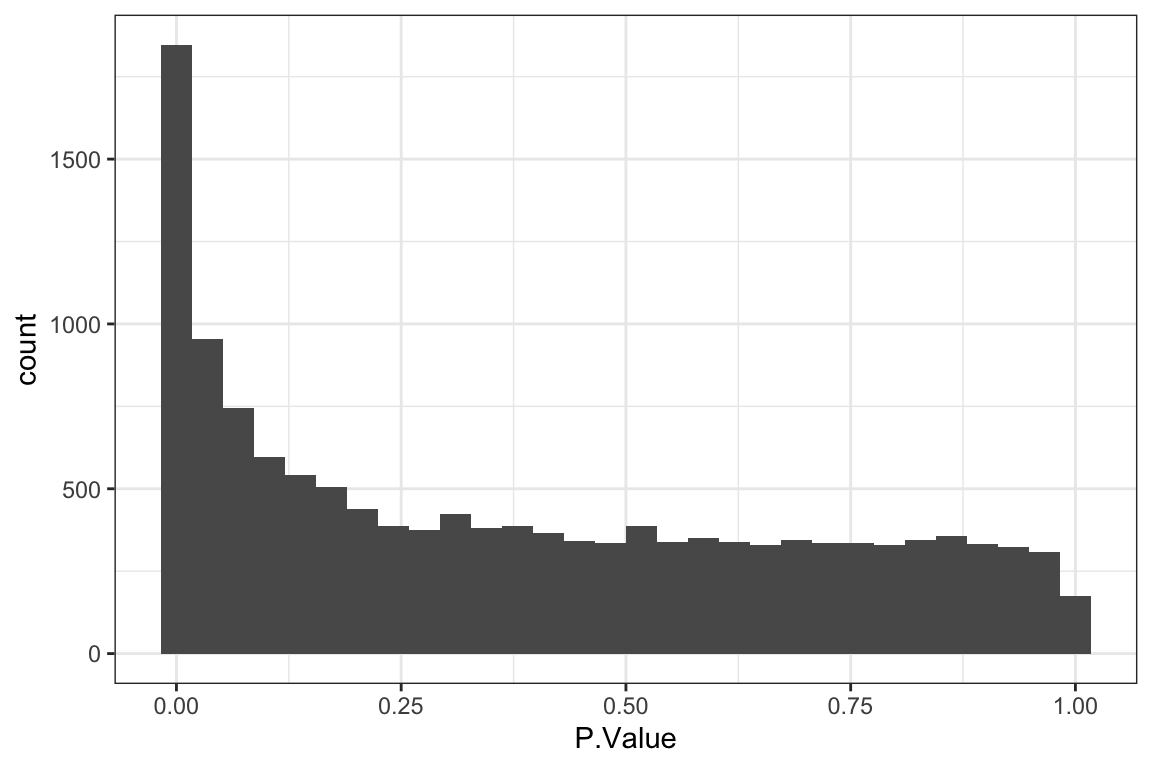
Table of significant correlations
Summarise plot for all concentrations (Cytokines alone)
Scatter plots showing significant correlations (5% FDR)
If multiple concentrations are identified as significant, only show the most significant concentration. 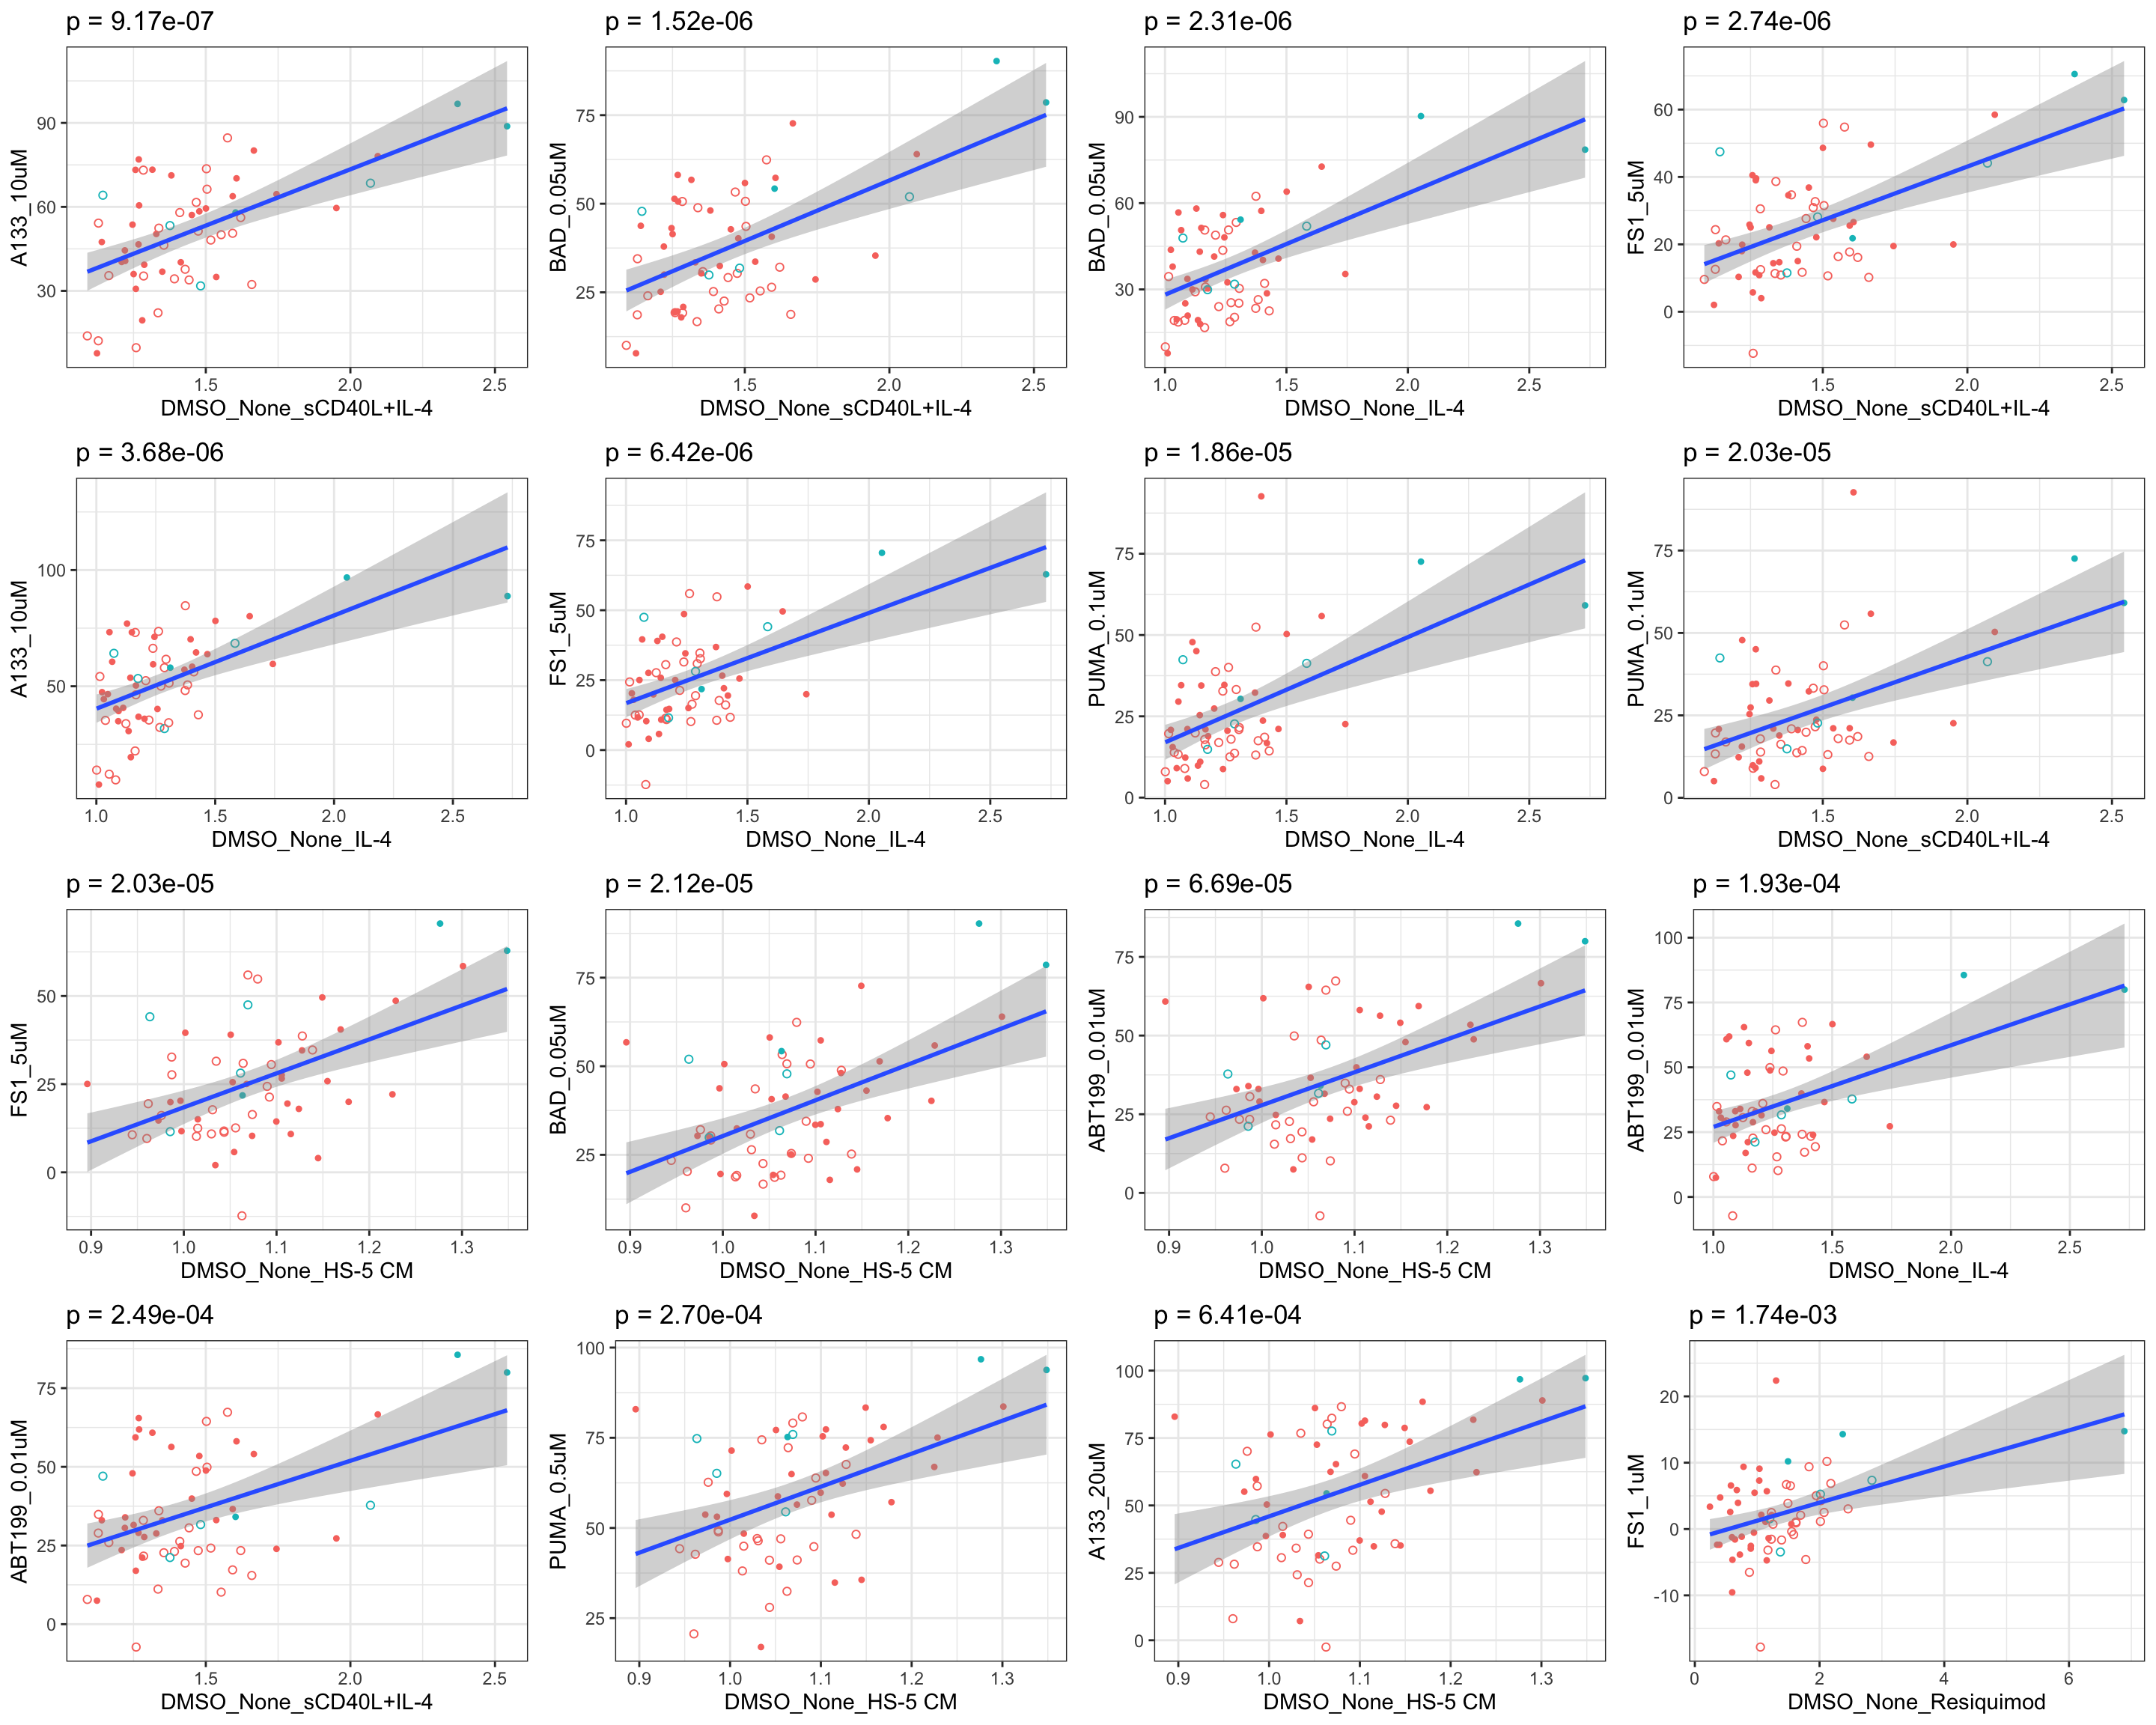 x-axis is the cell viability after drug treatment, so higher values mean higher drug resistance
Summarise plot for all concentrations (Drug alone)
Scatter plots showing significant correlations (5% FDR)
If multiple concentrations are identified as significant, only show the most significant concentration. 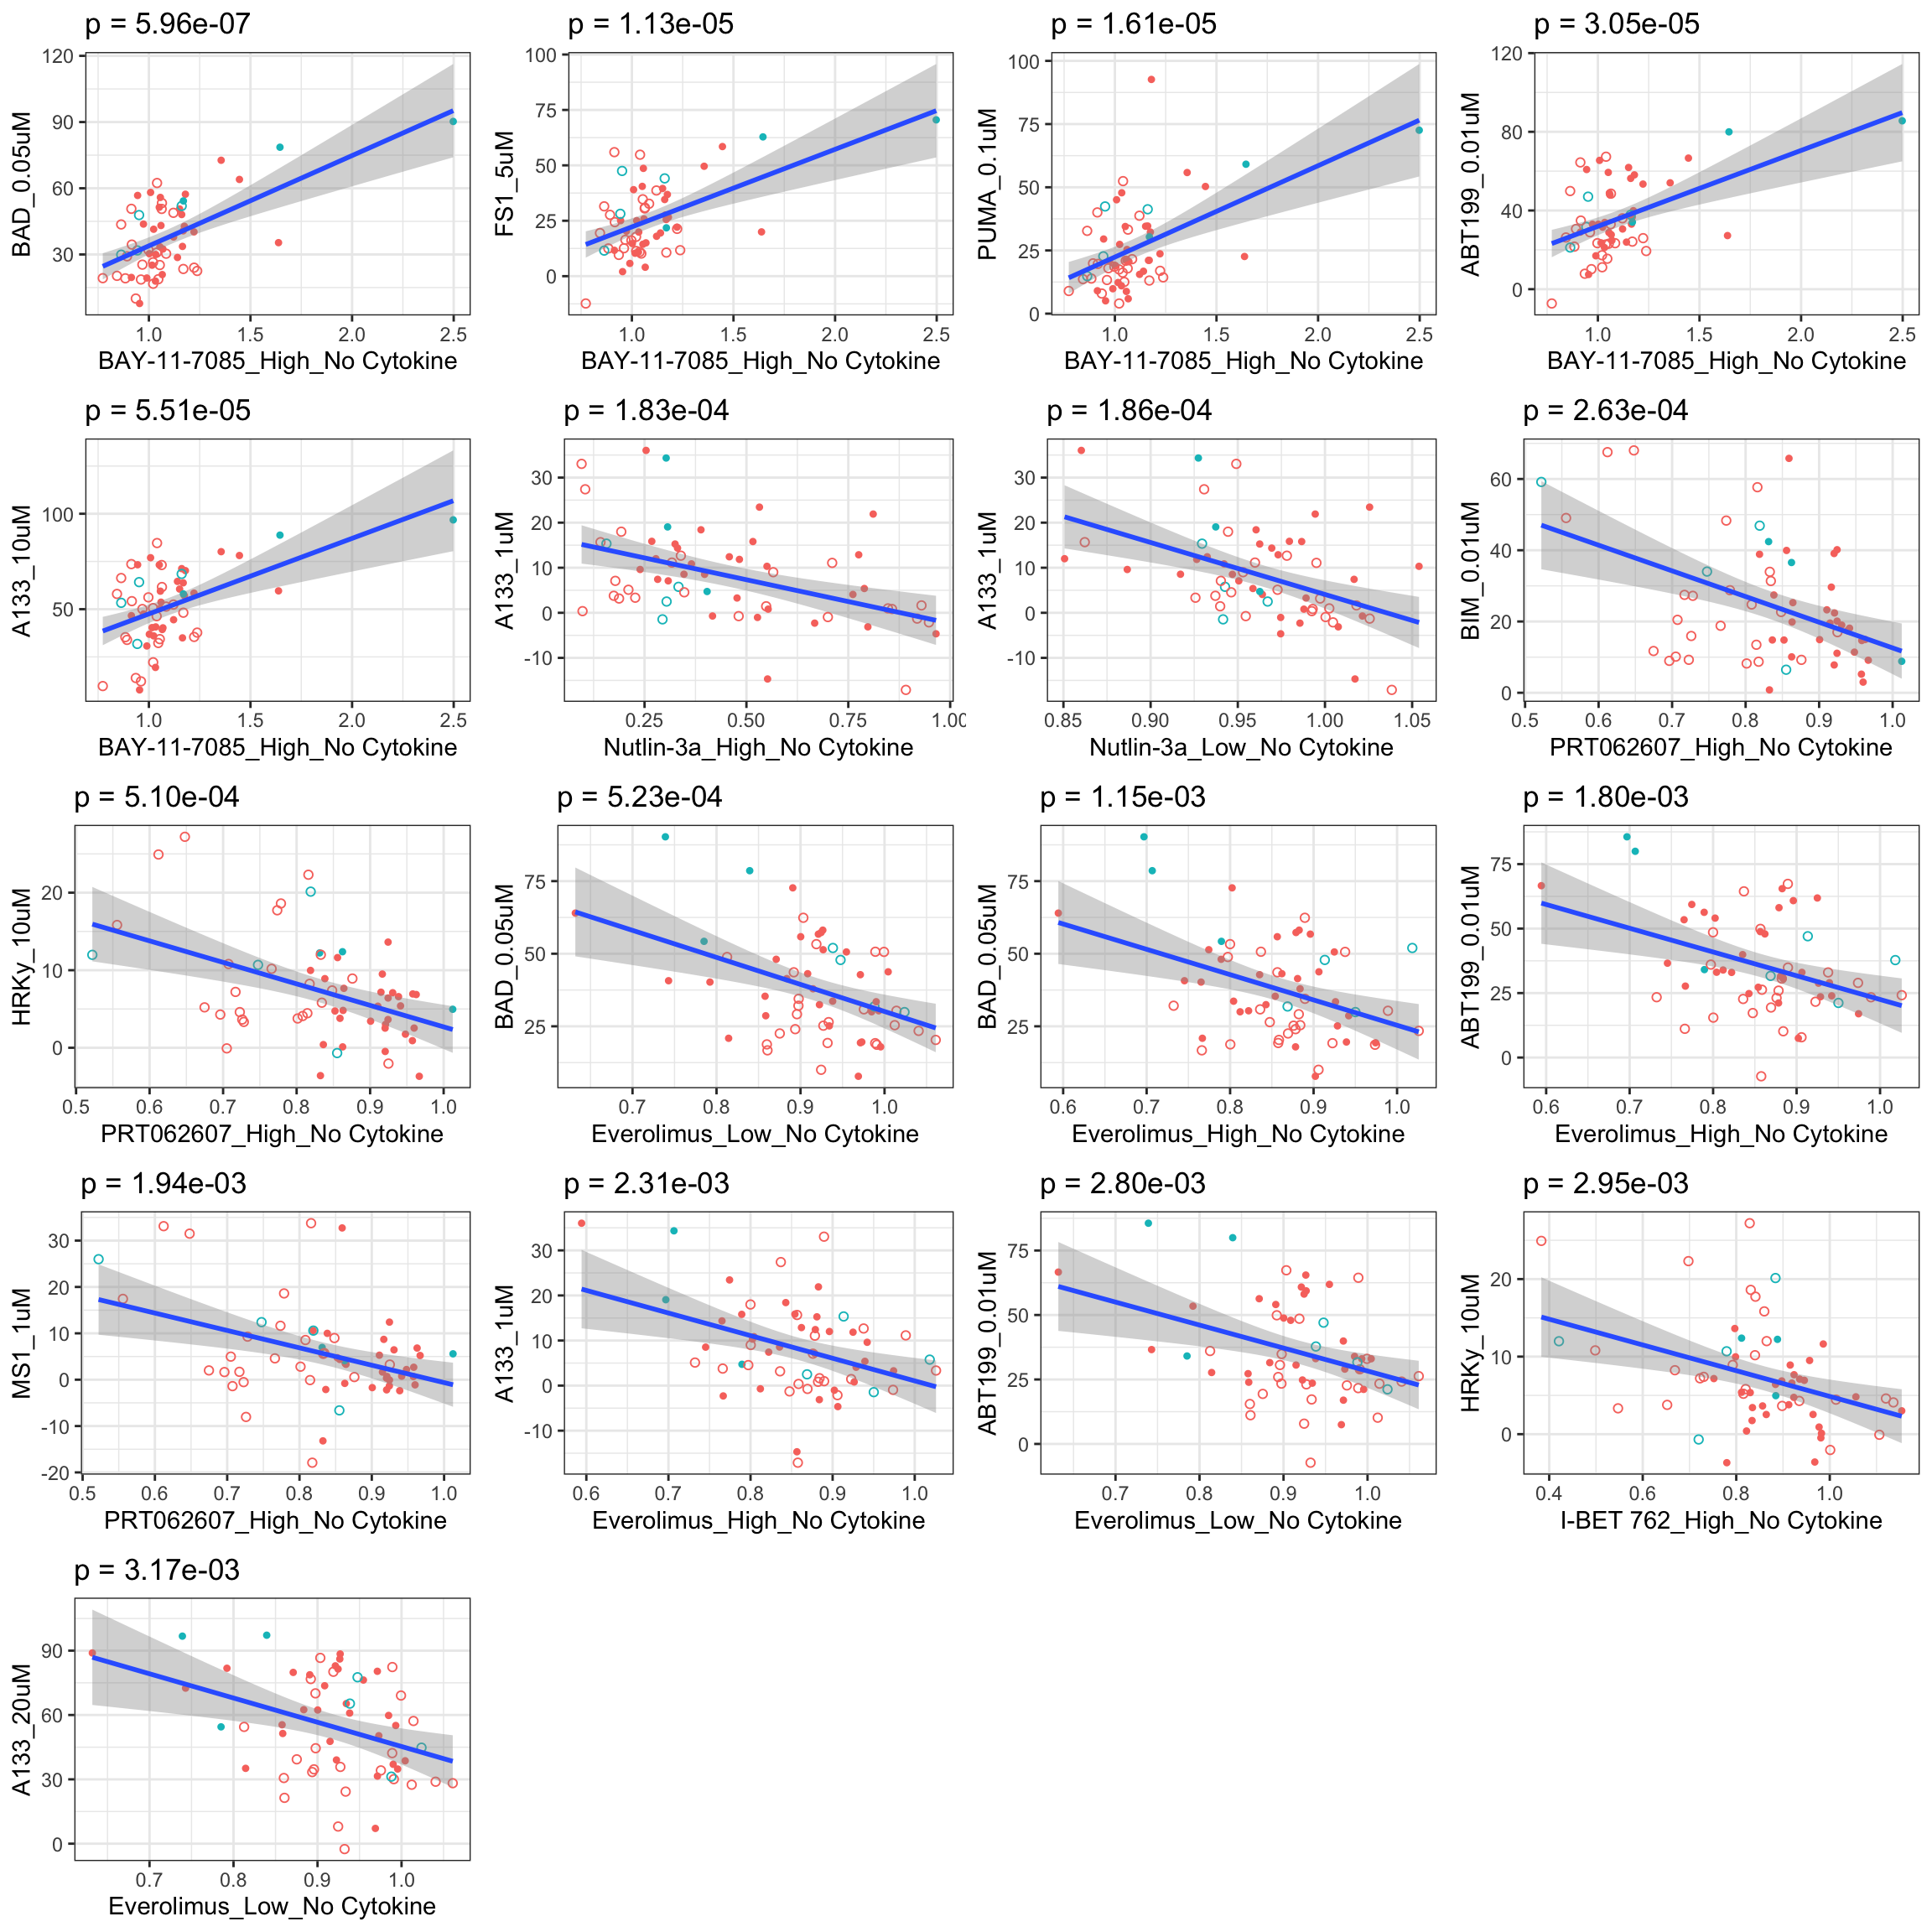 x-axis is the cell viability after drug treatment, so higher values mean higher drug resistance
If multiple concentrations are identified as significant, only show the most significant concentration. 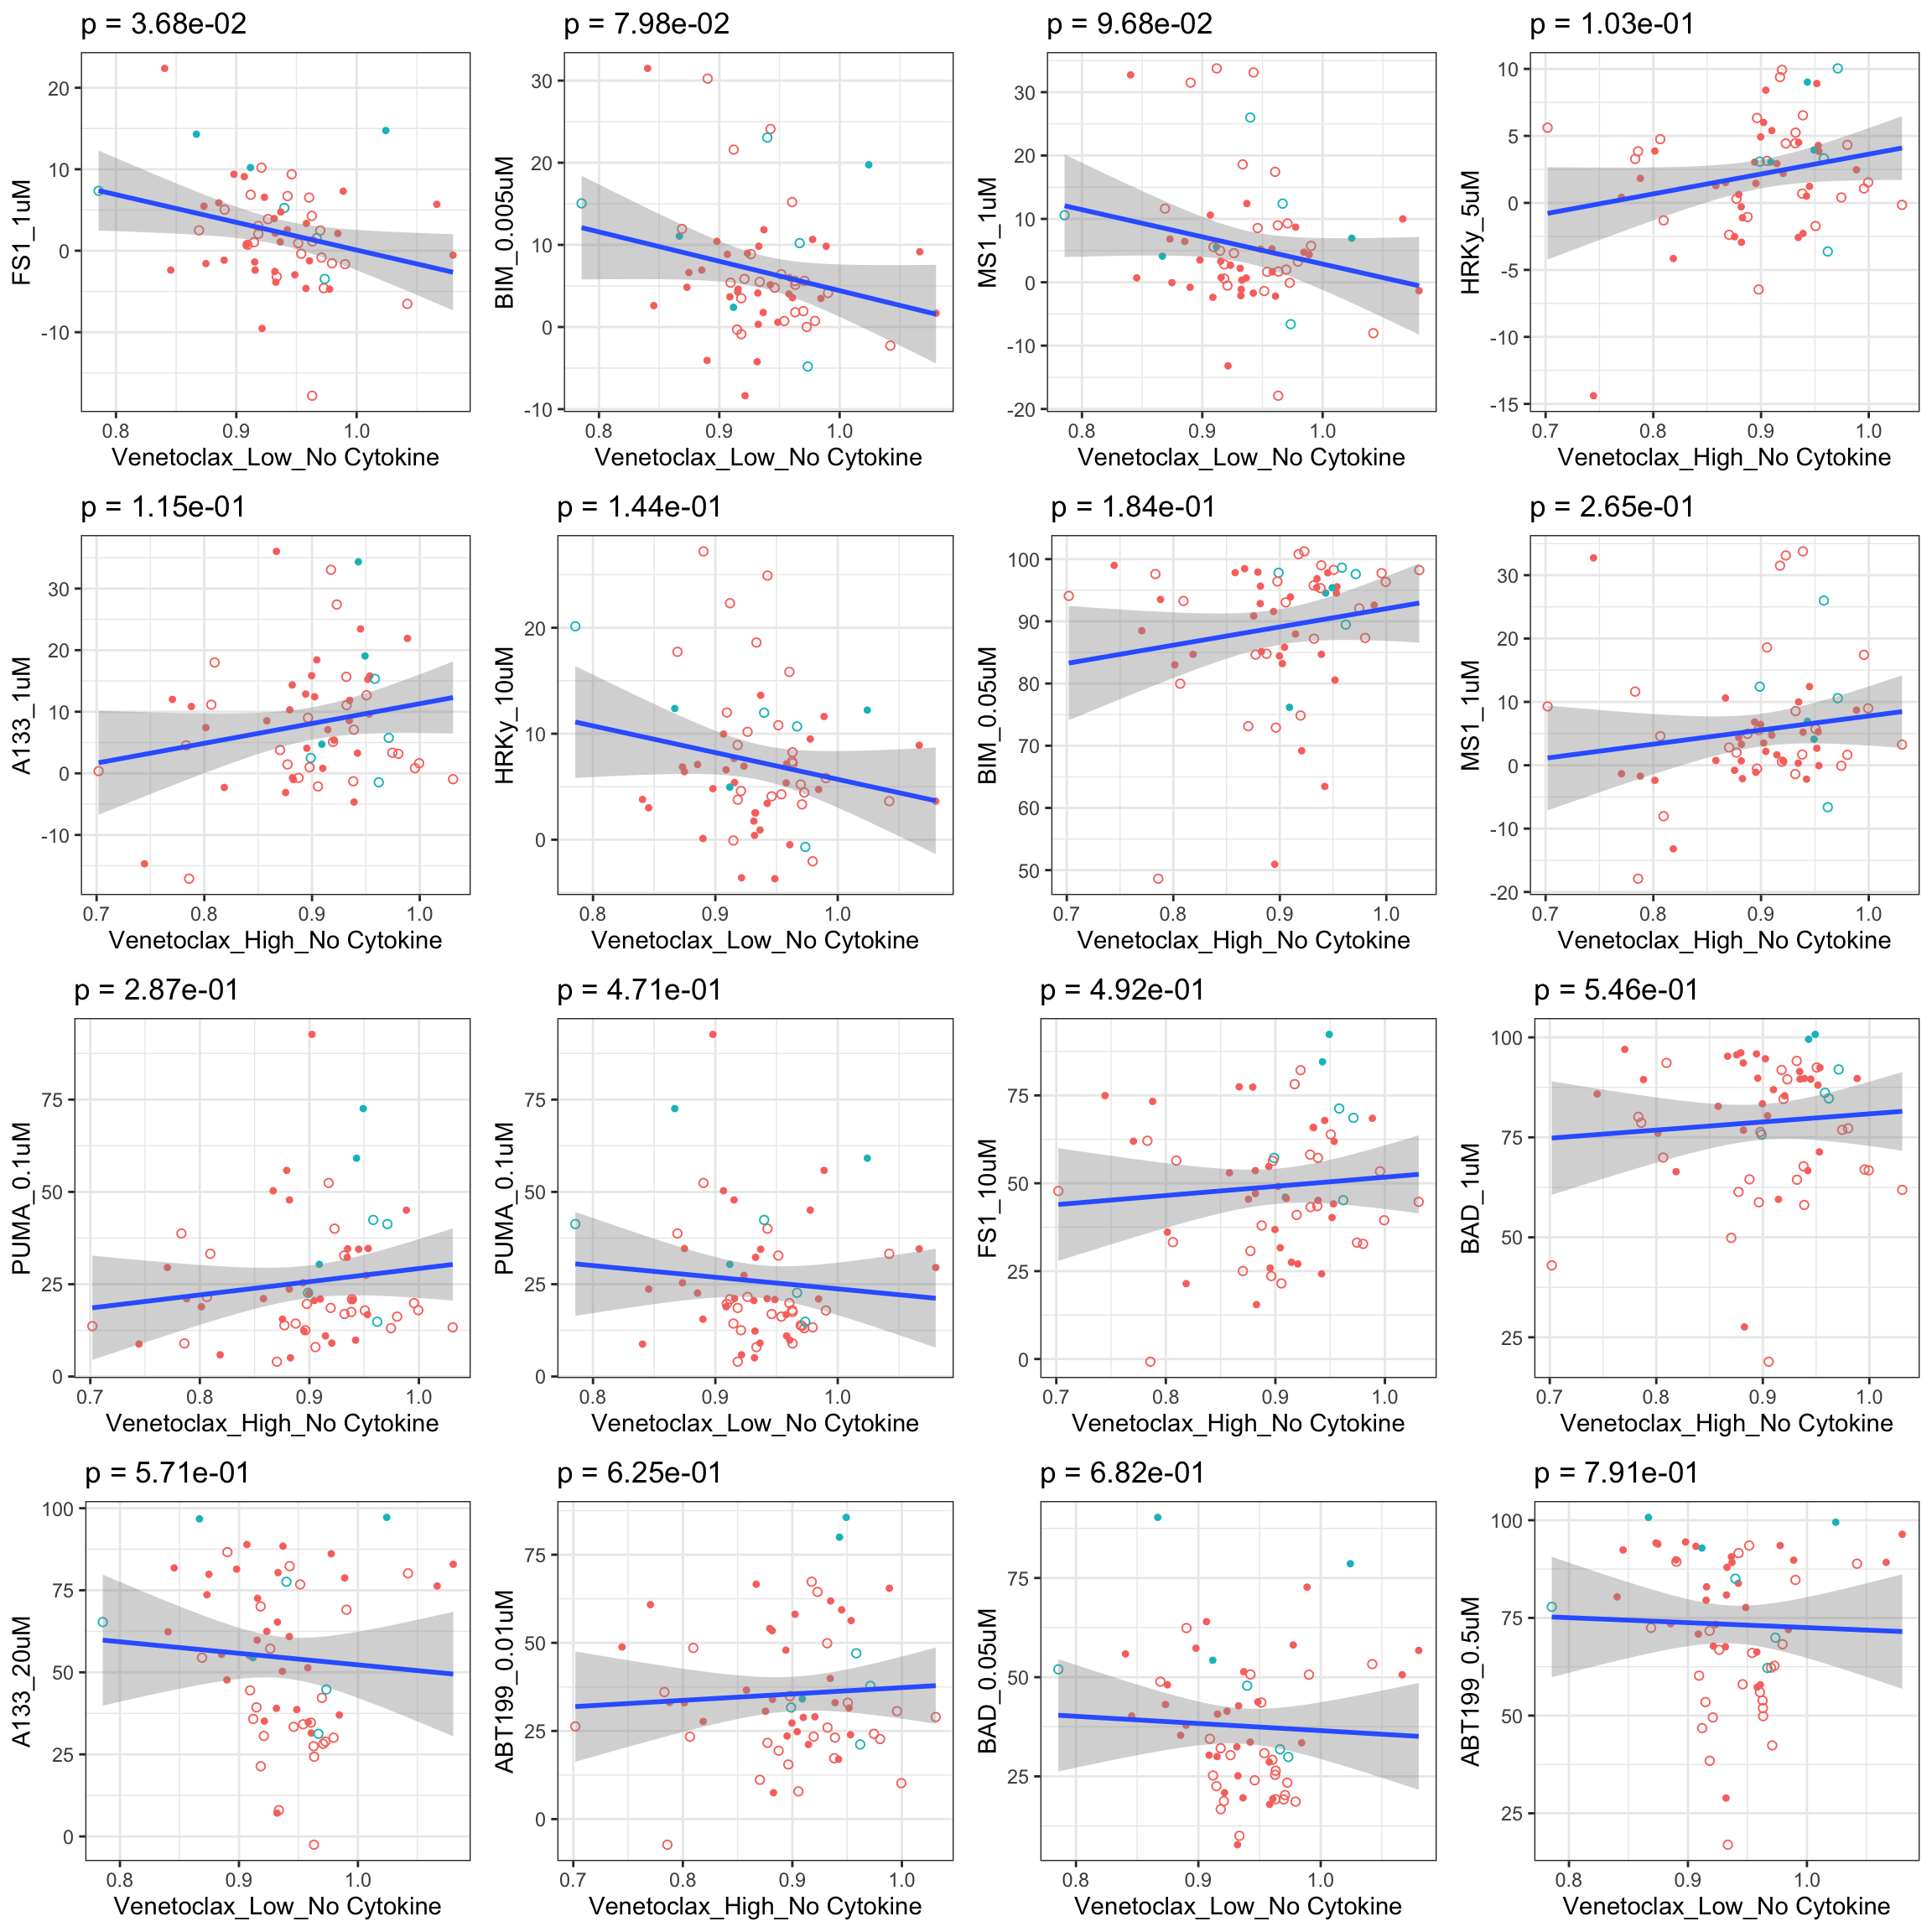
Scatter plots showing significant correlations (5% FDR), with venetoclax
If multiple concentrations are identified as significant, only show the most significant concentration. 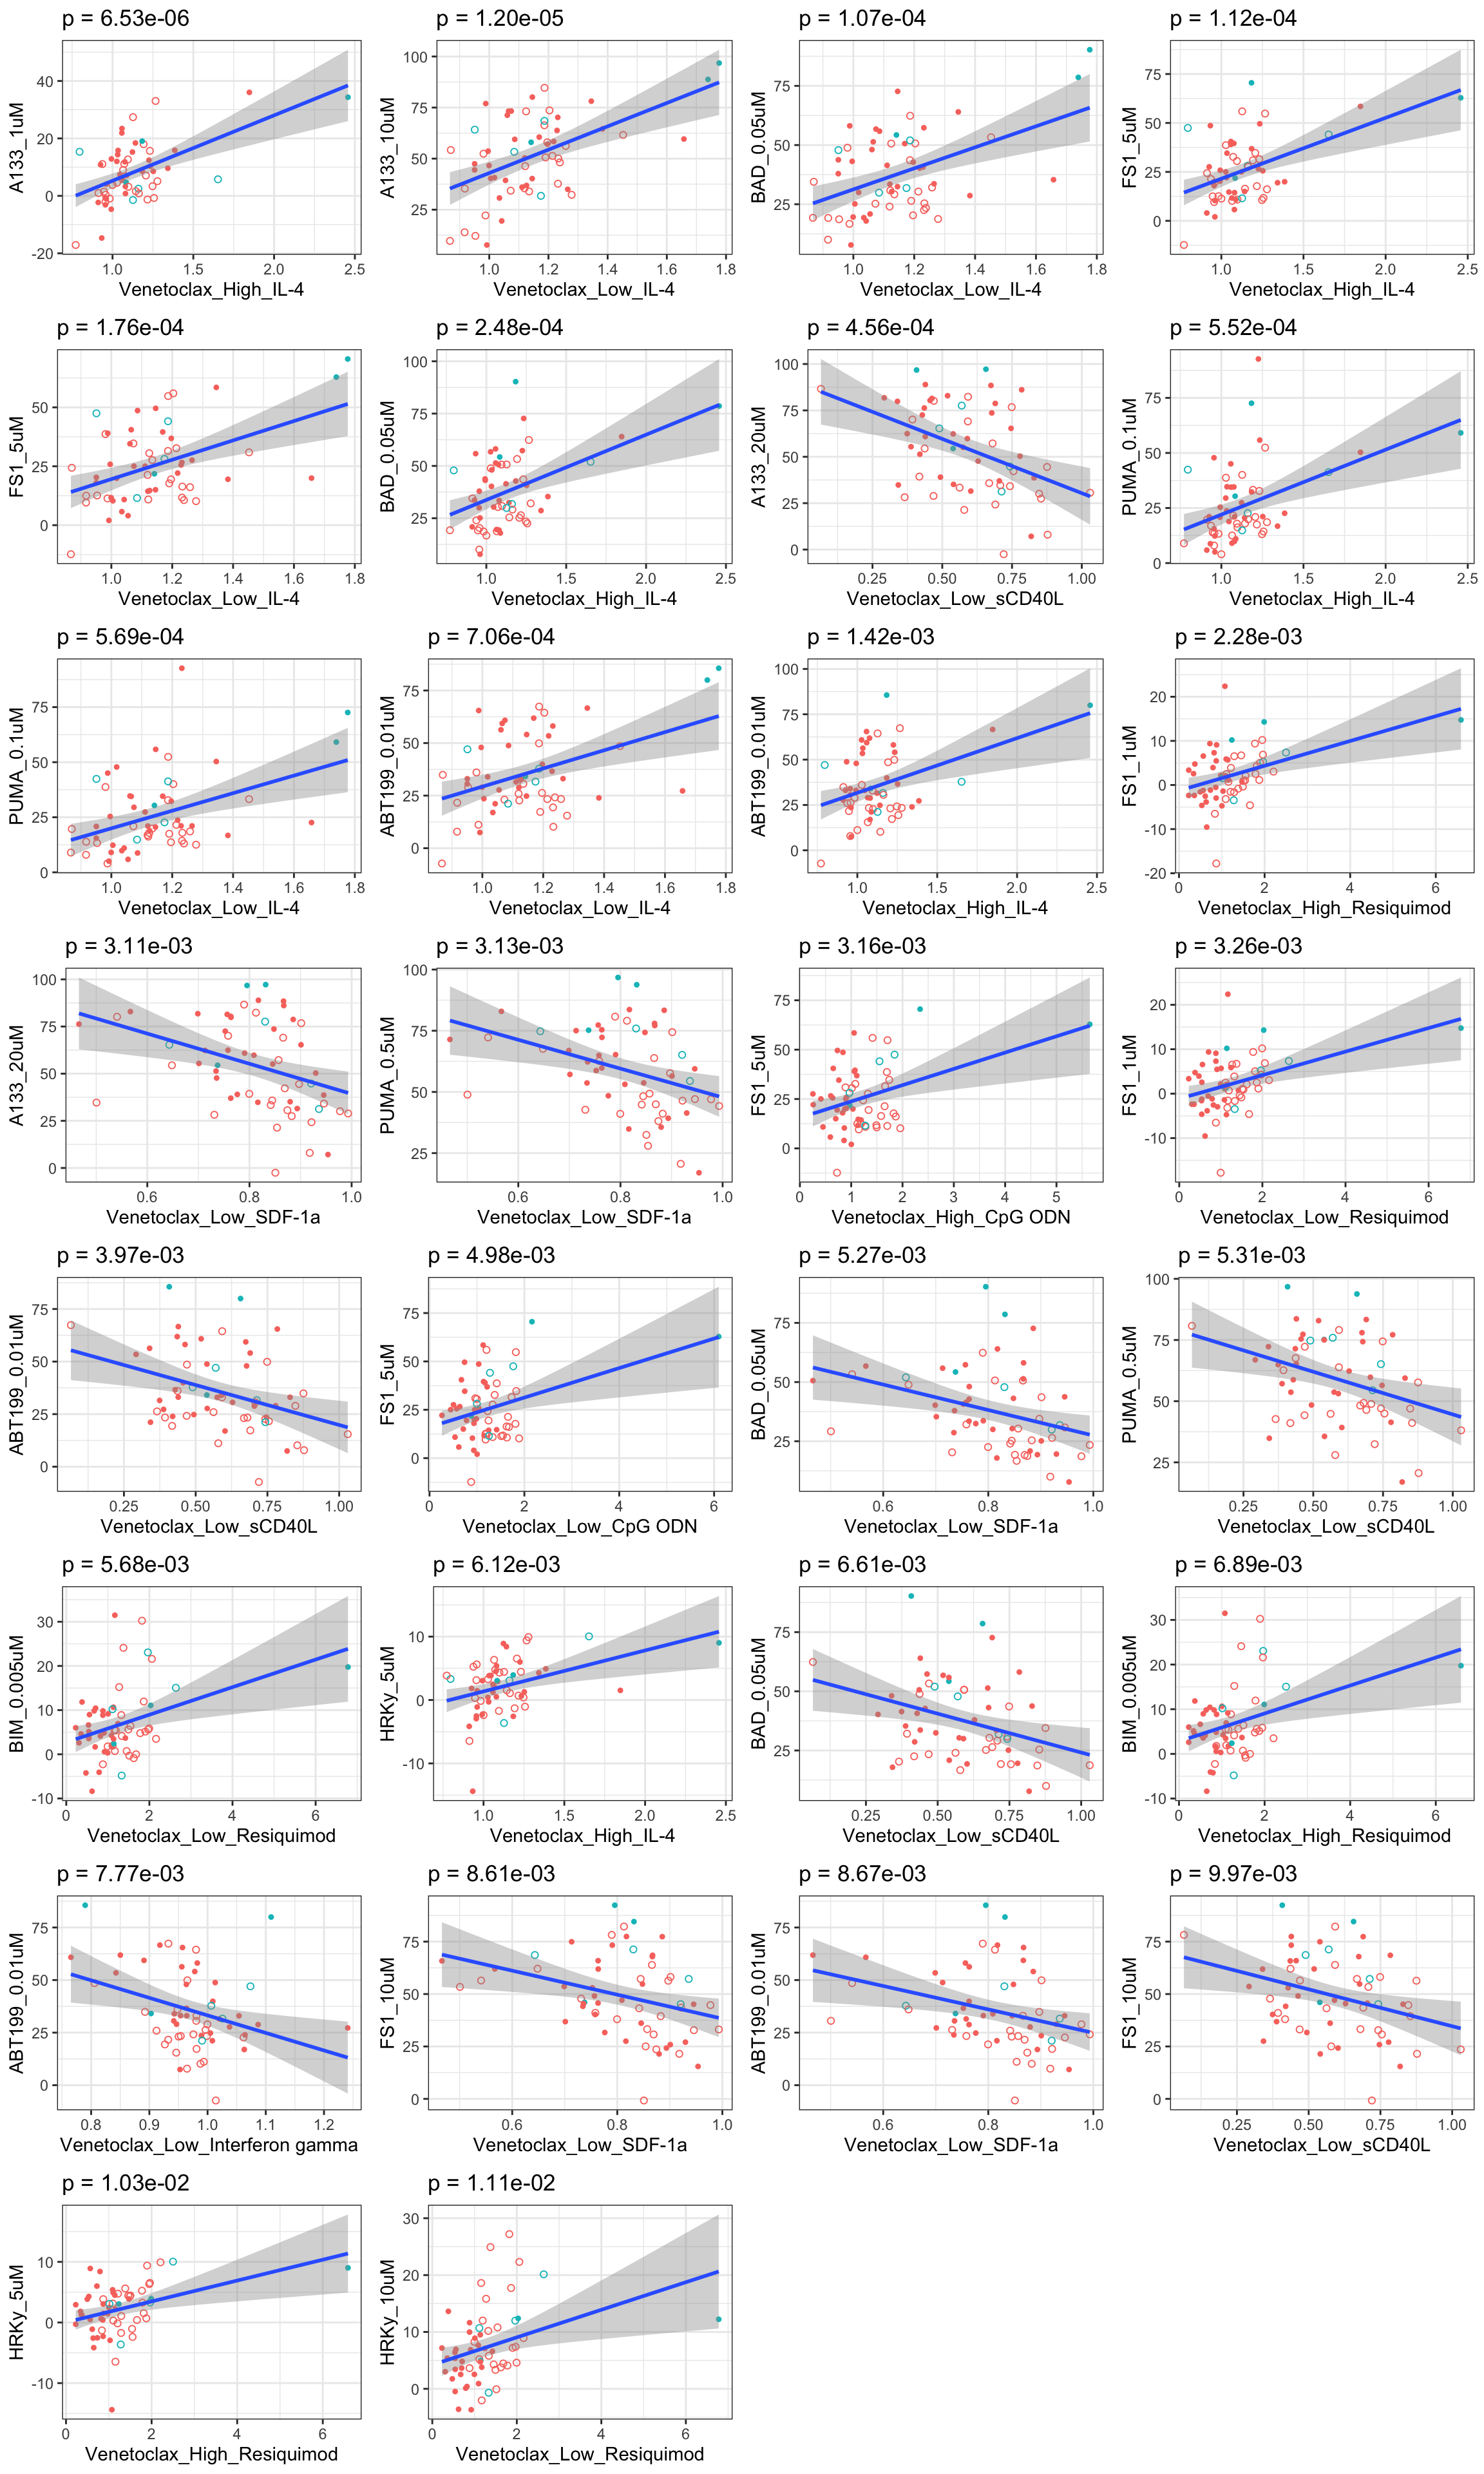
Association with ex-vivo drug responses (Annexin data)
Preprocessing
[1] 26 31Correlation with baseline viablity (DMSO only treatment)
Table of significant correlations
Scatter plots showing significant correlations (5% FDR)
If multiple concentrations are identified as significant, only show the most significant concentration. 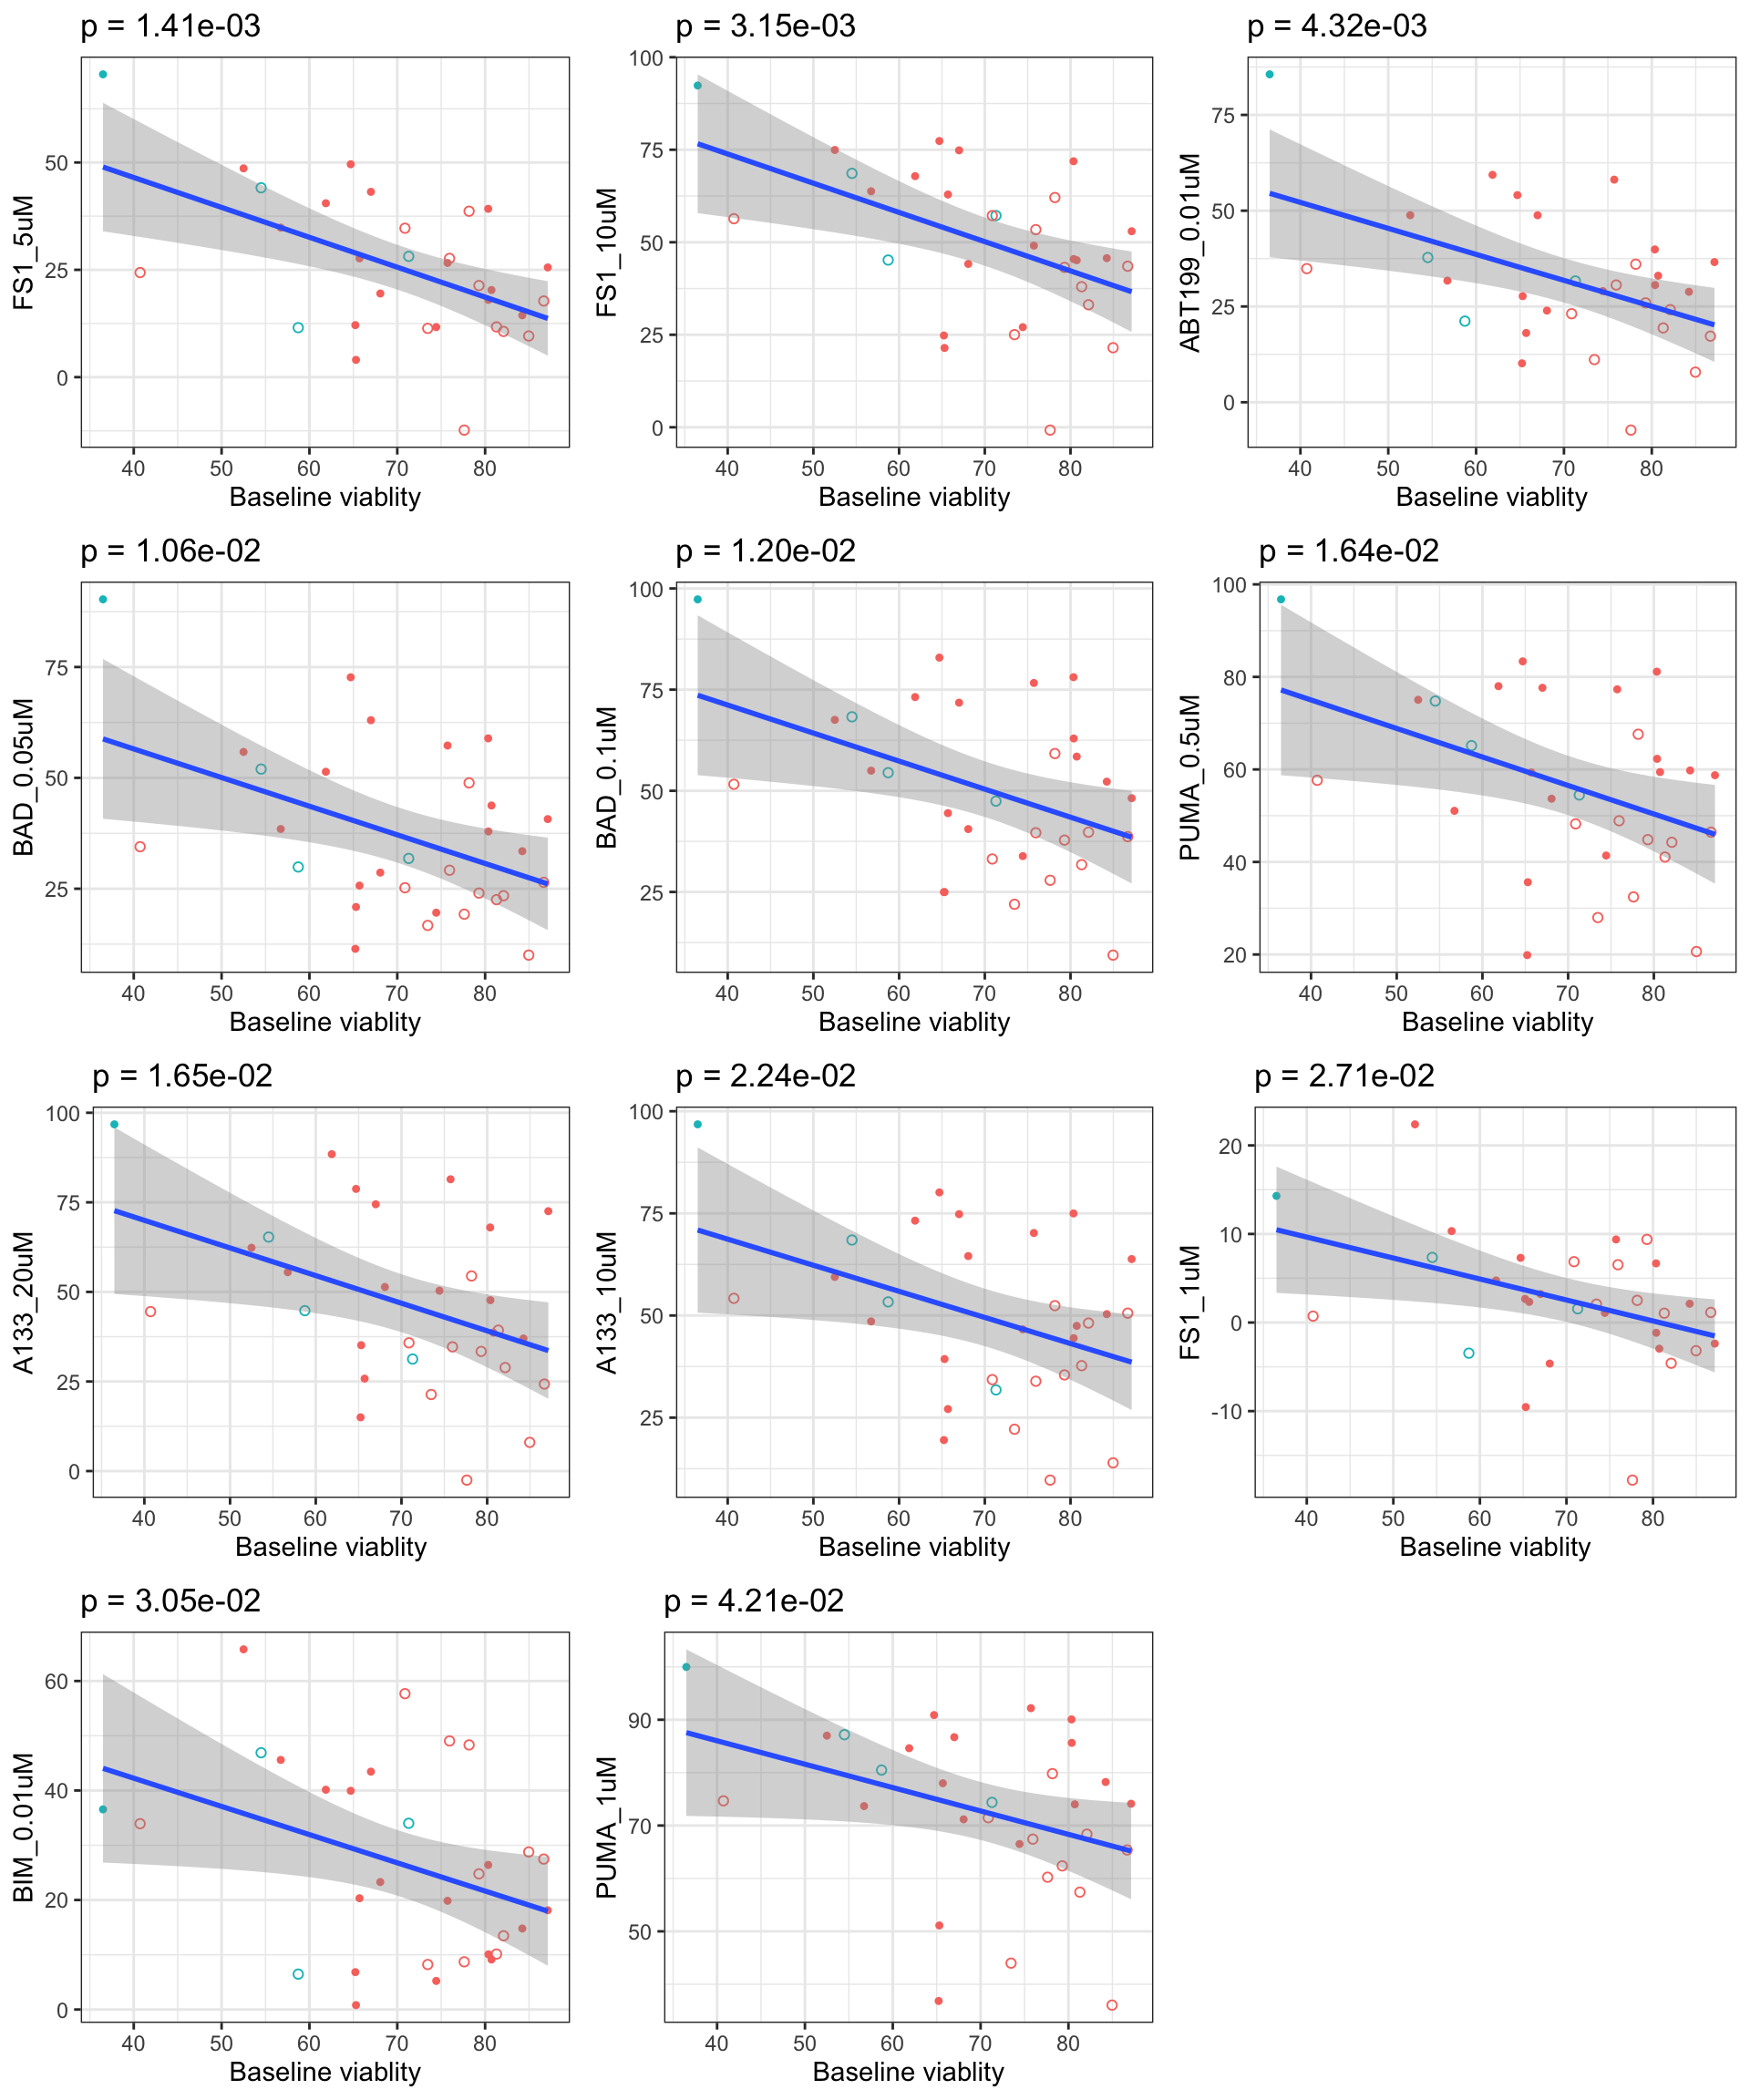
Correlation with drug treatment
Table of significant correlations
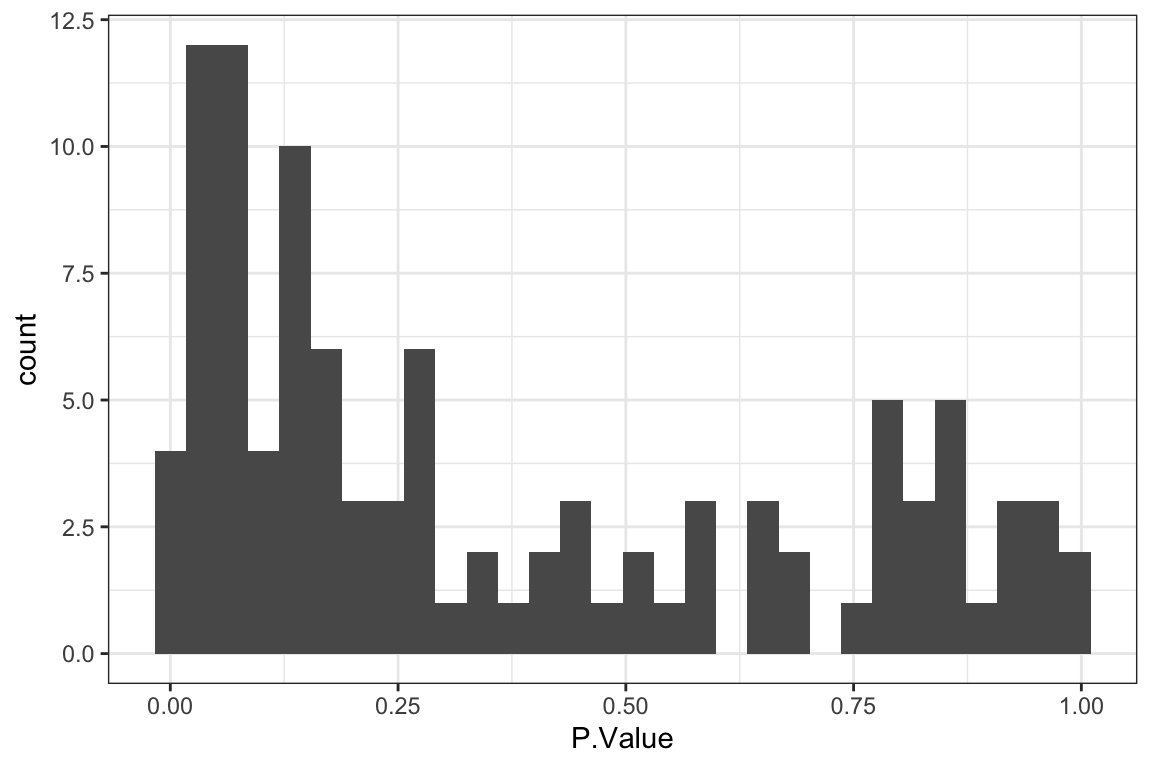
P-value histogram
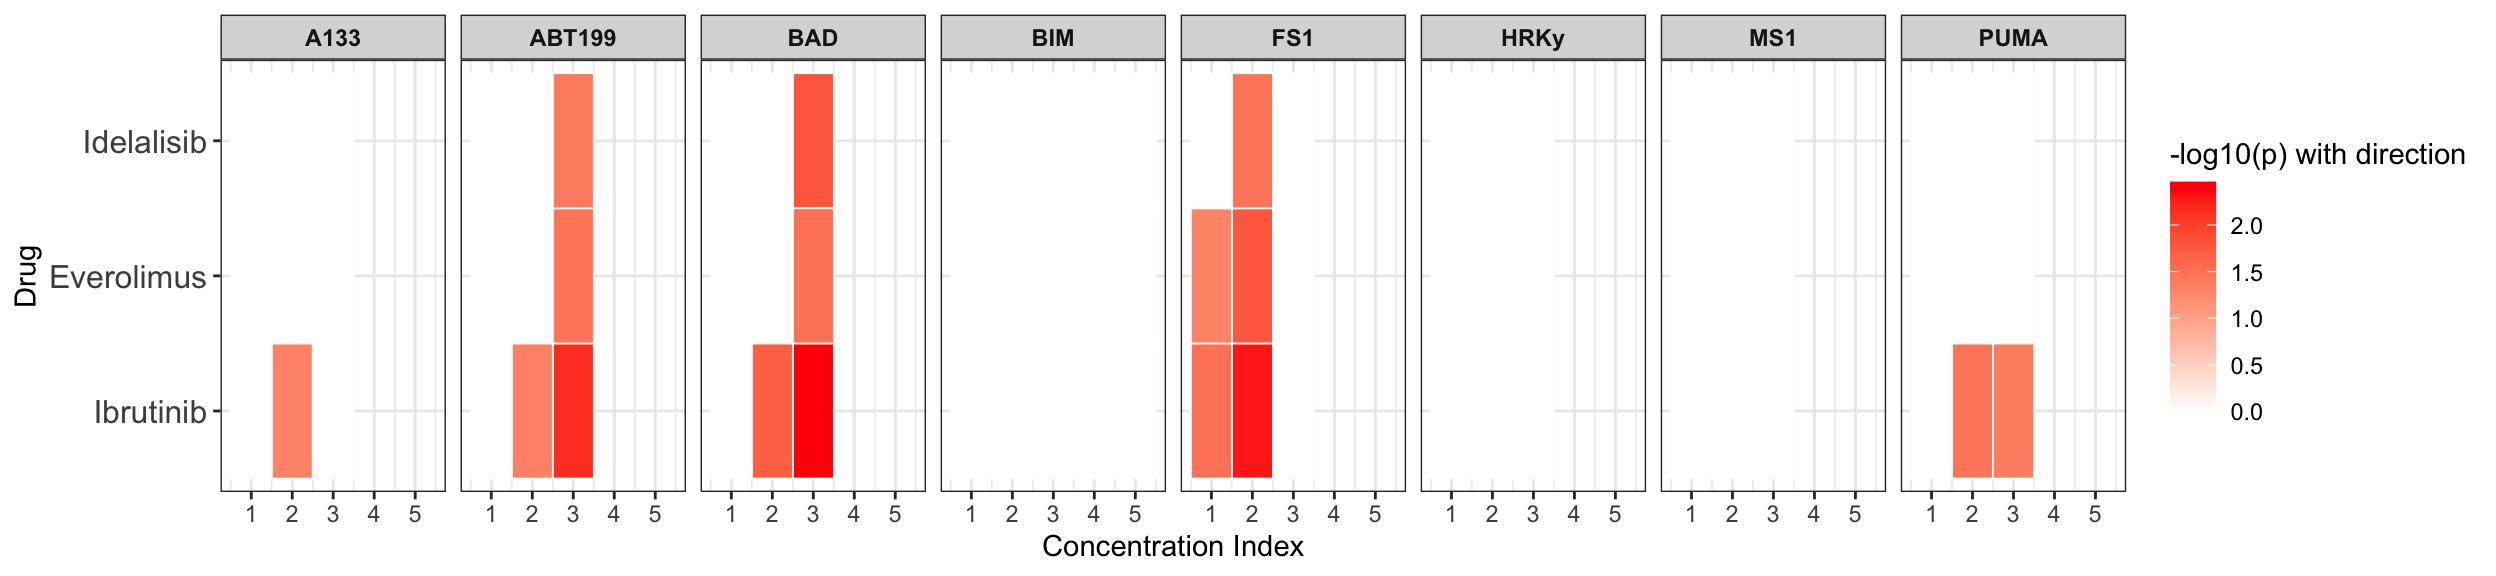
Summarise plot for all concentrations
Scatter plots showing significant correlations (P < 0.05)
If multiple concentrations are identified as significant, only show the most significant concentration. 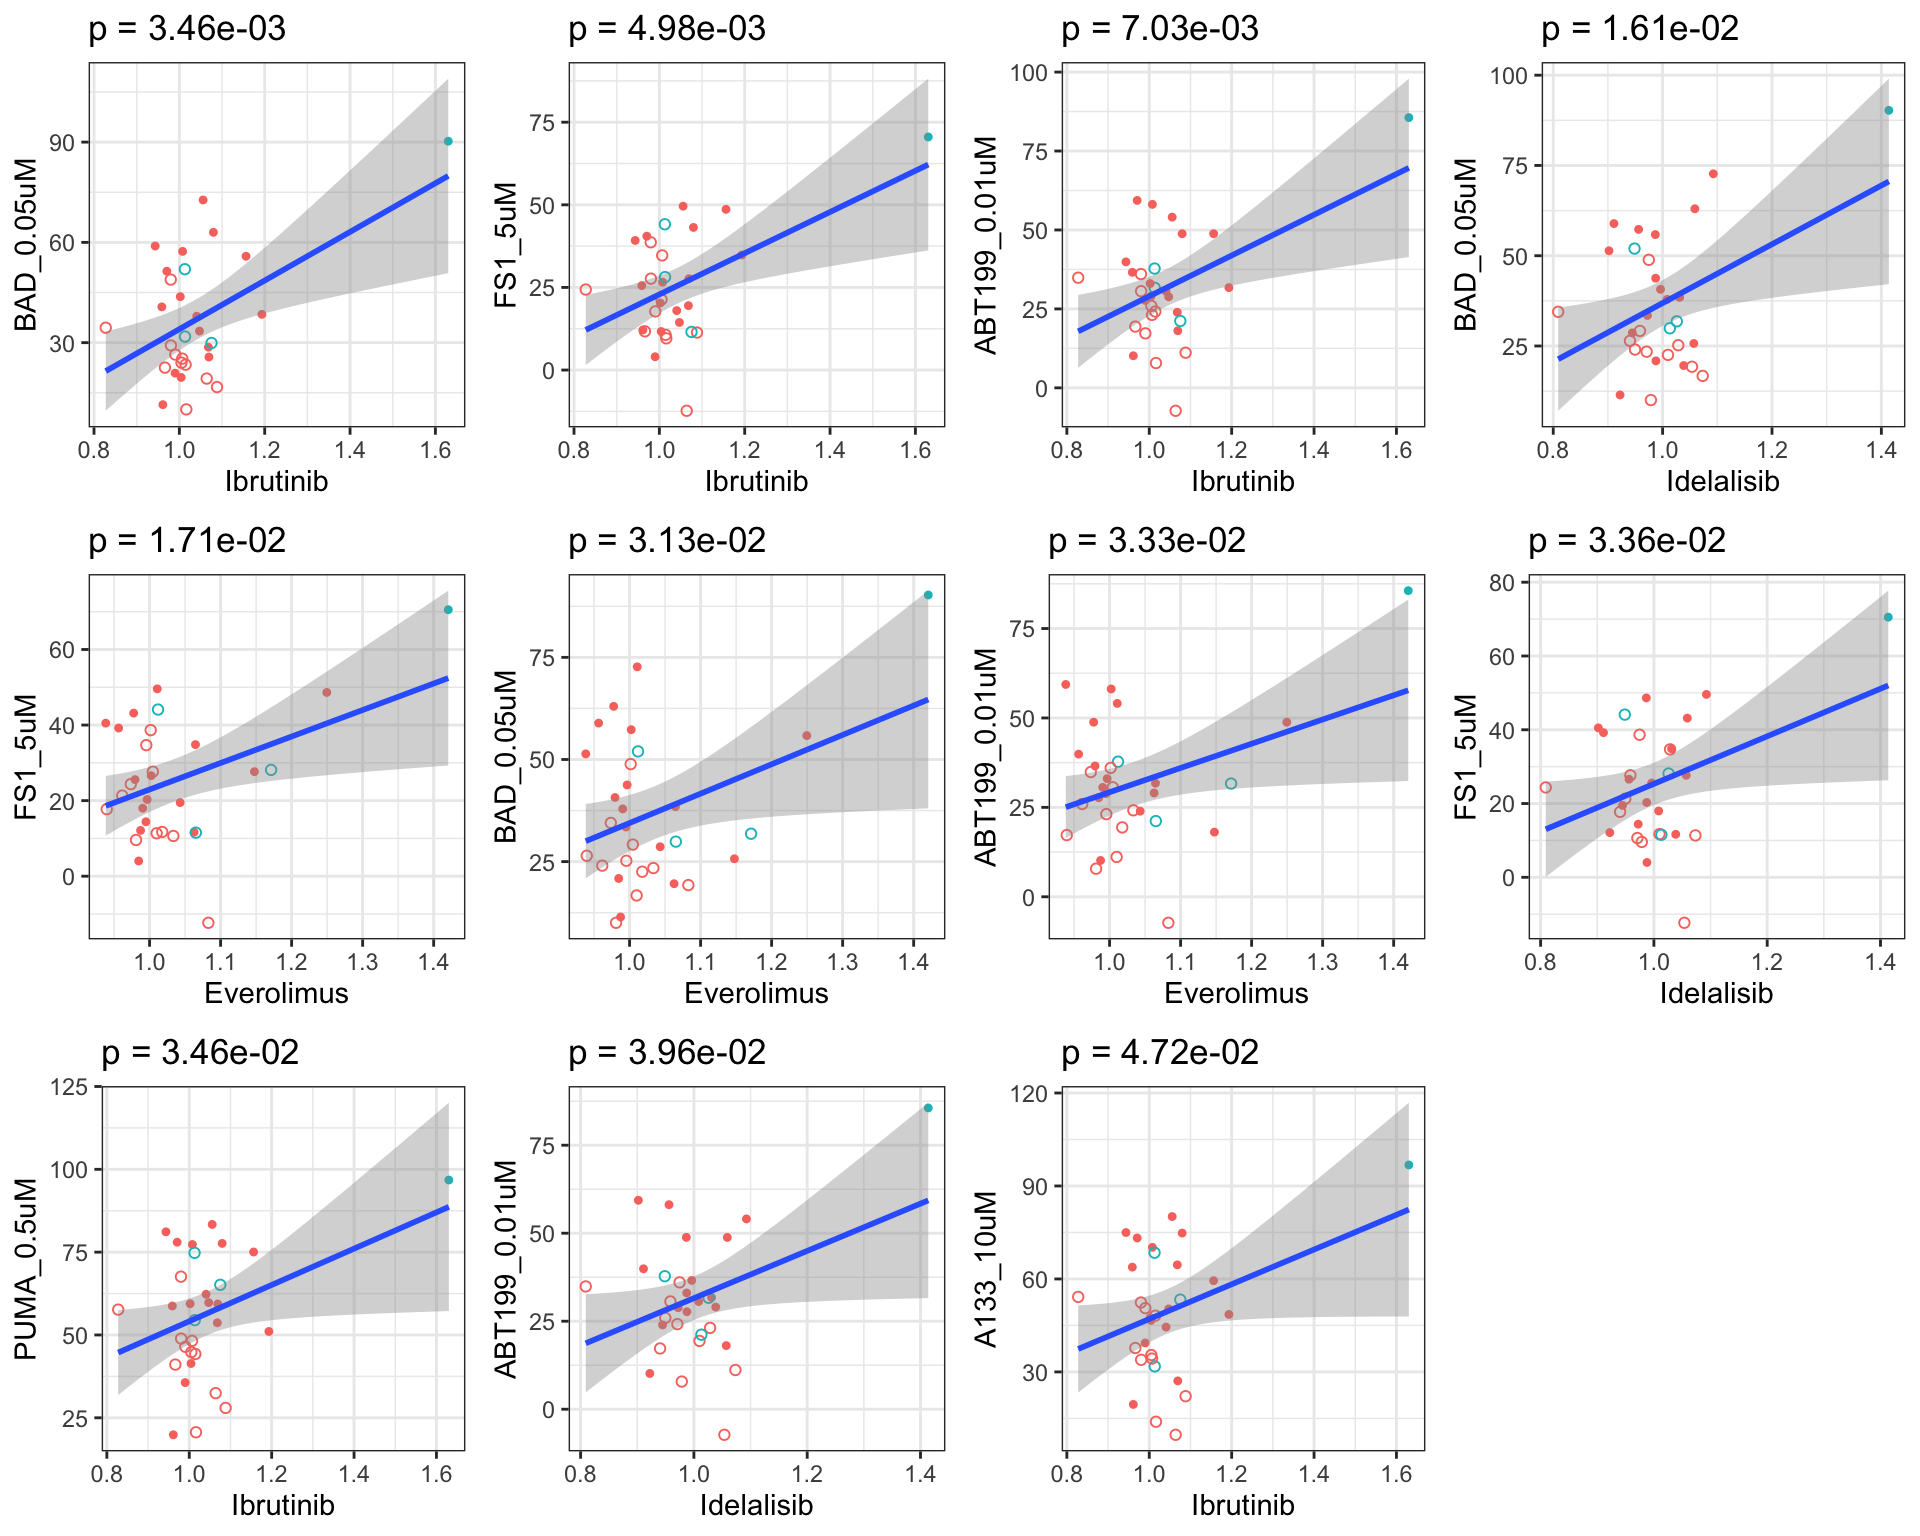
Correlation with Venetoclax treatment only
Table of significant correlations
P-value histogram
Summarise plot for all concentrations
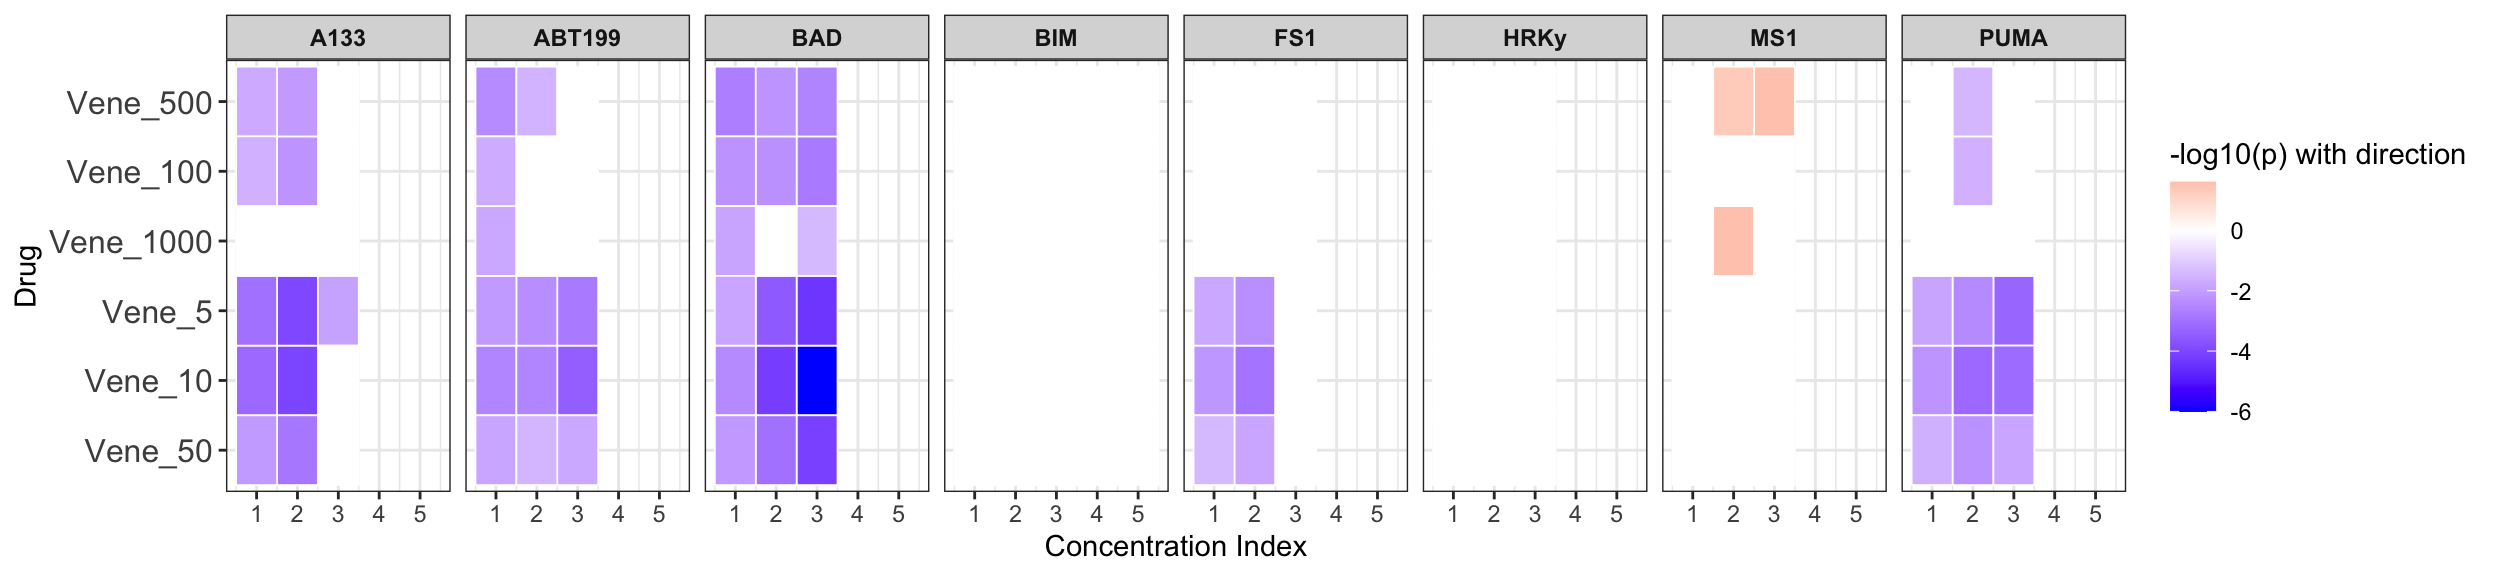
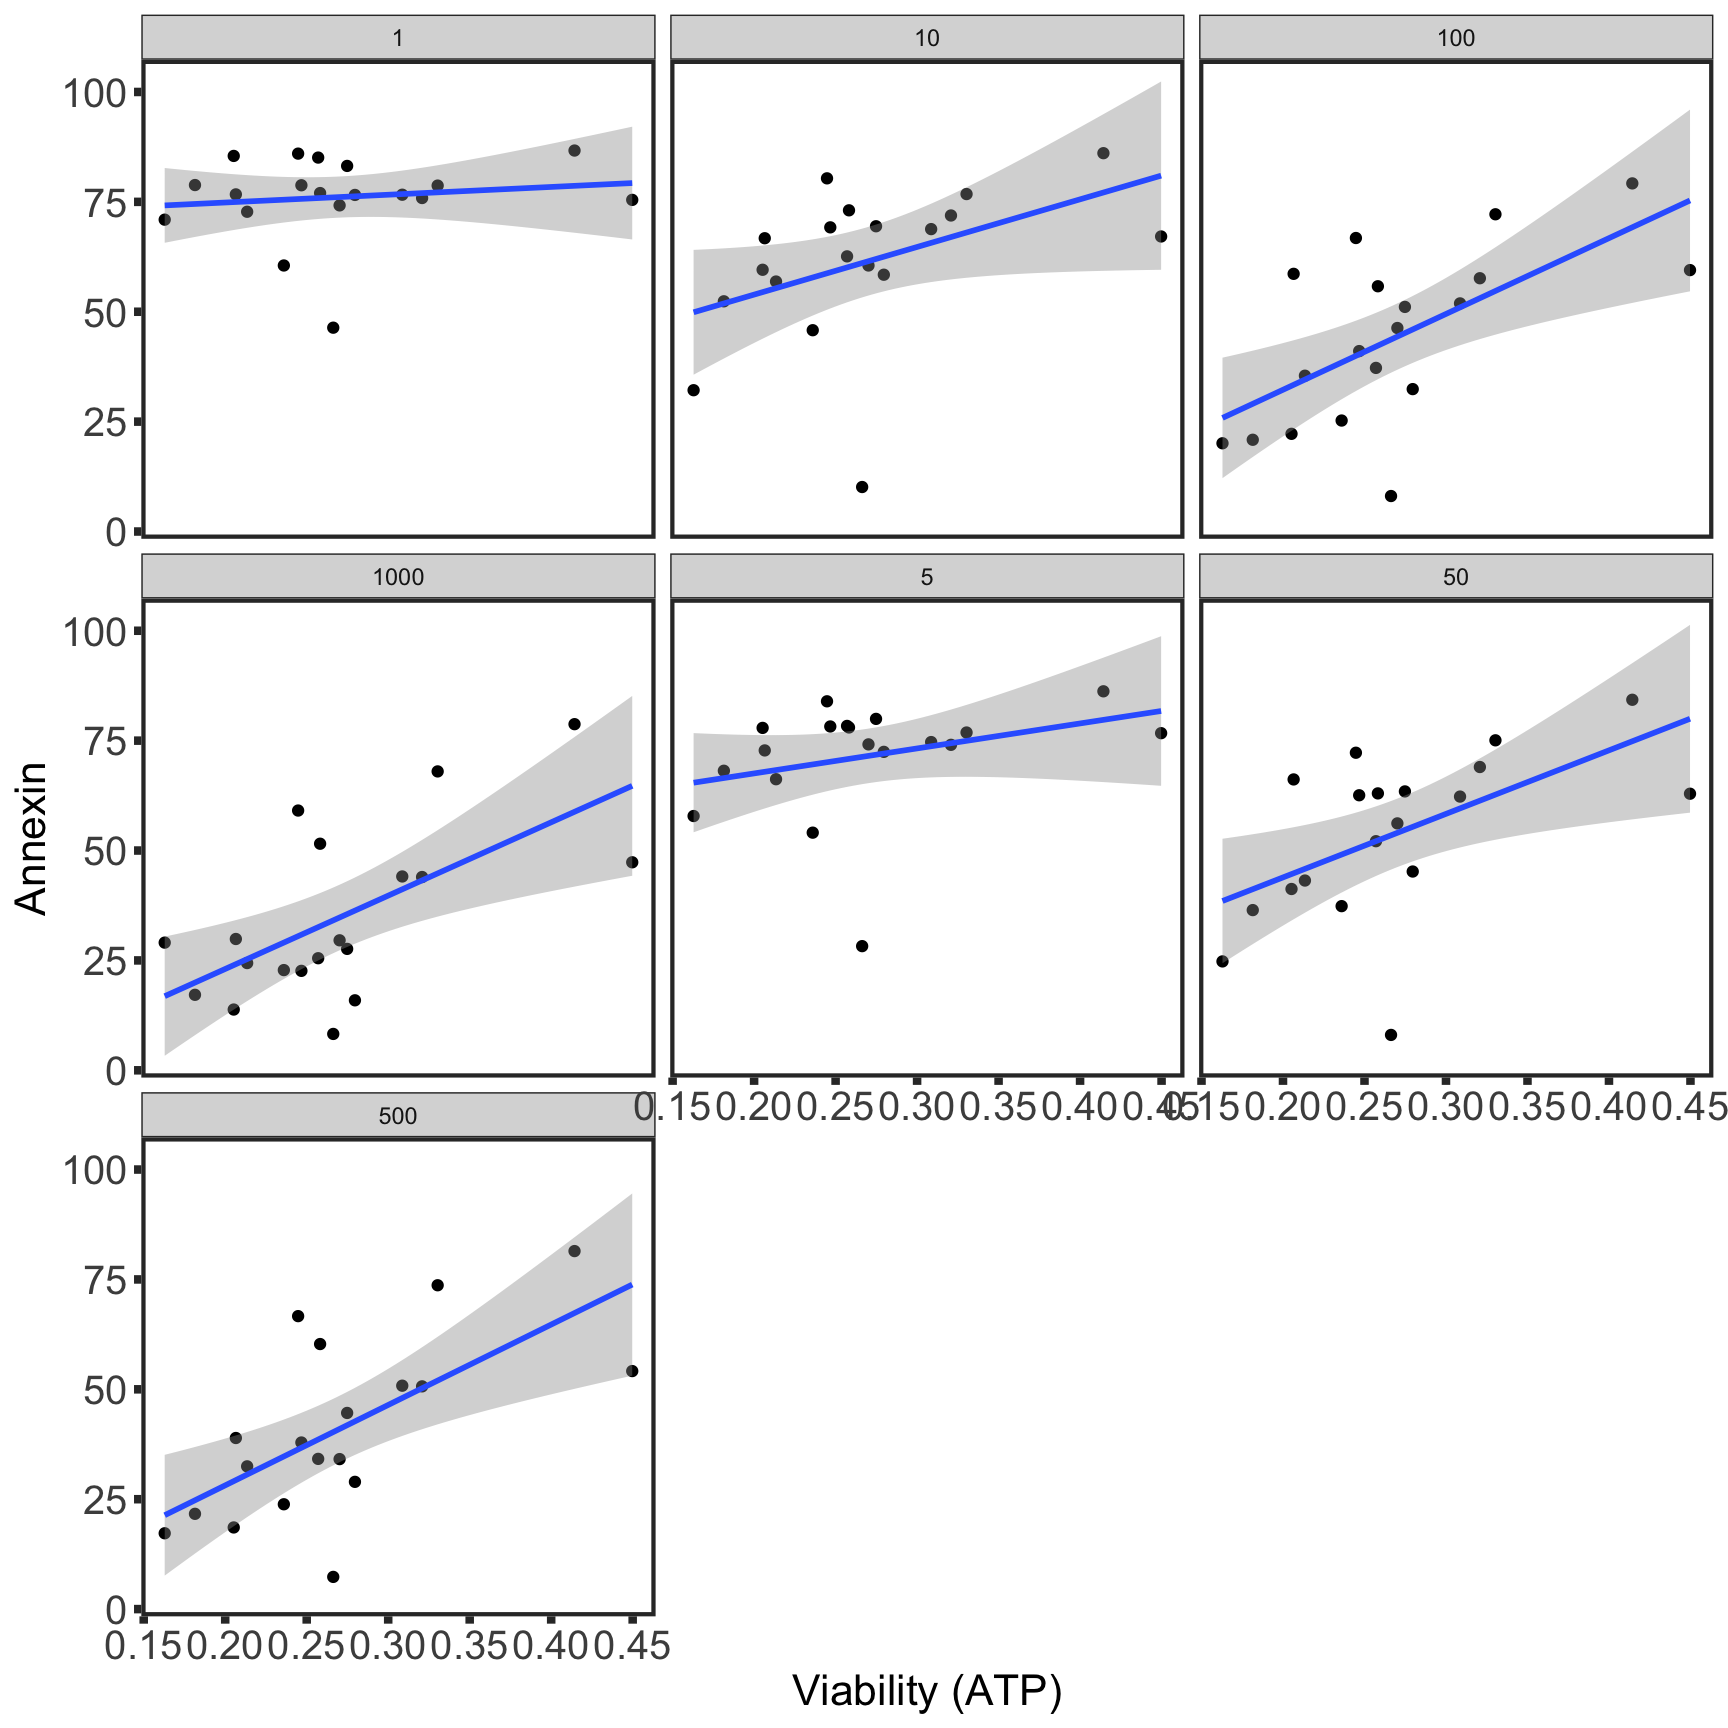
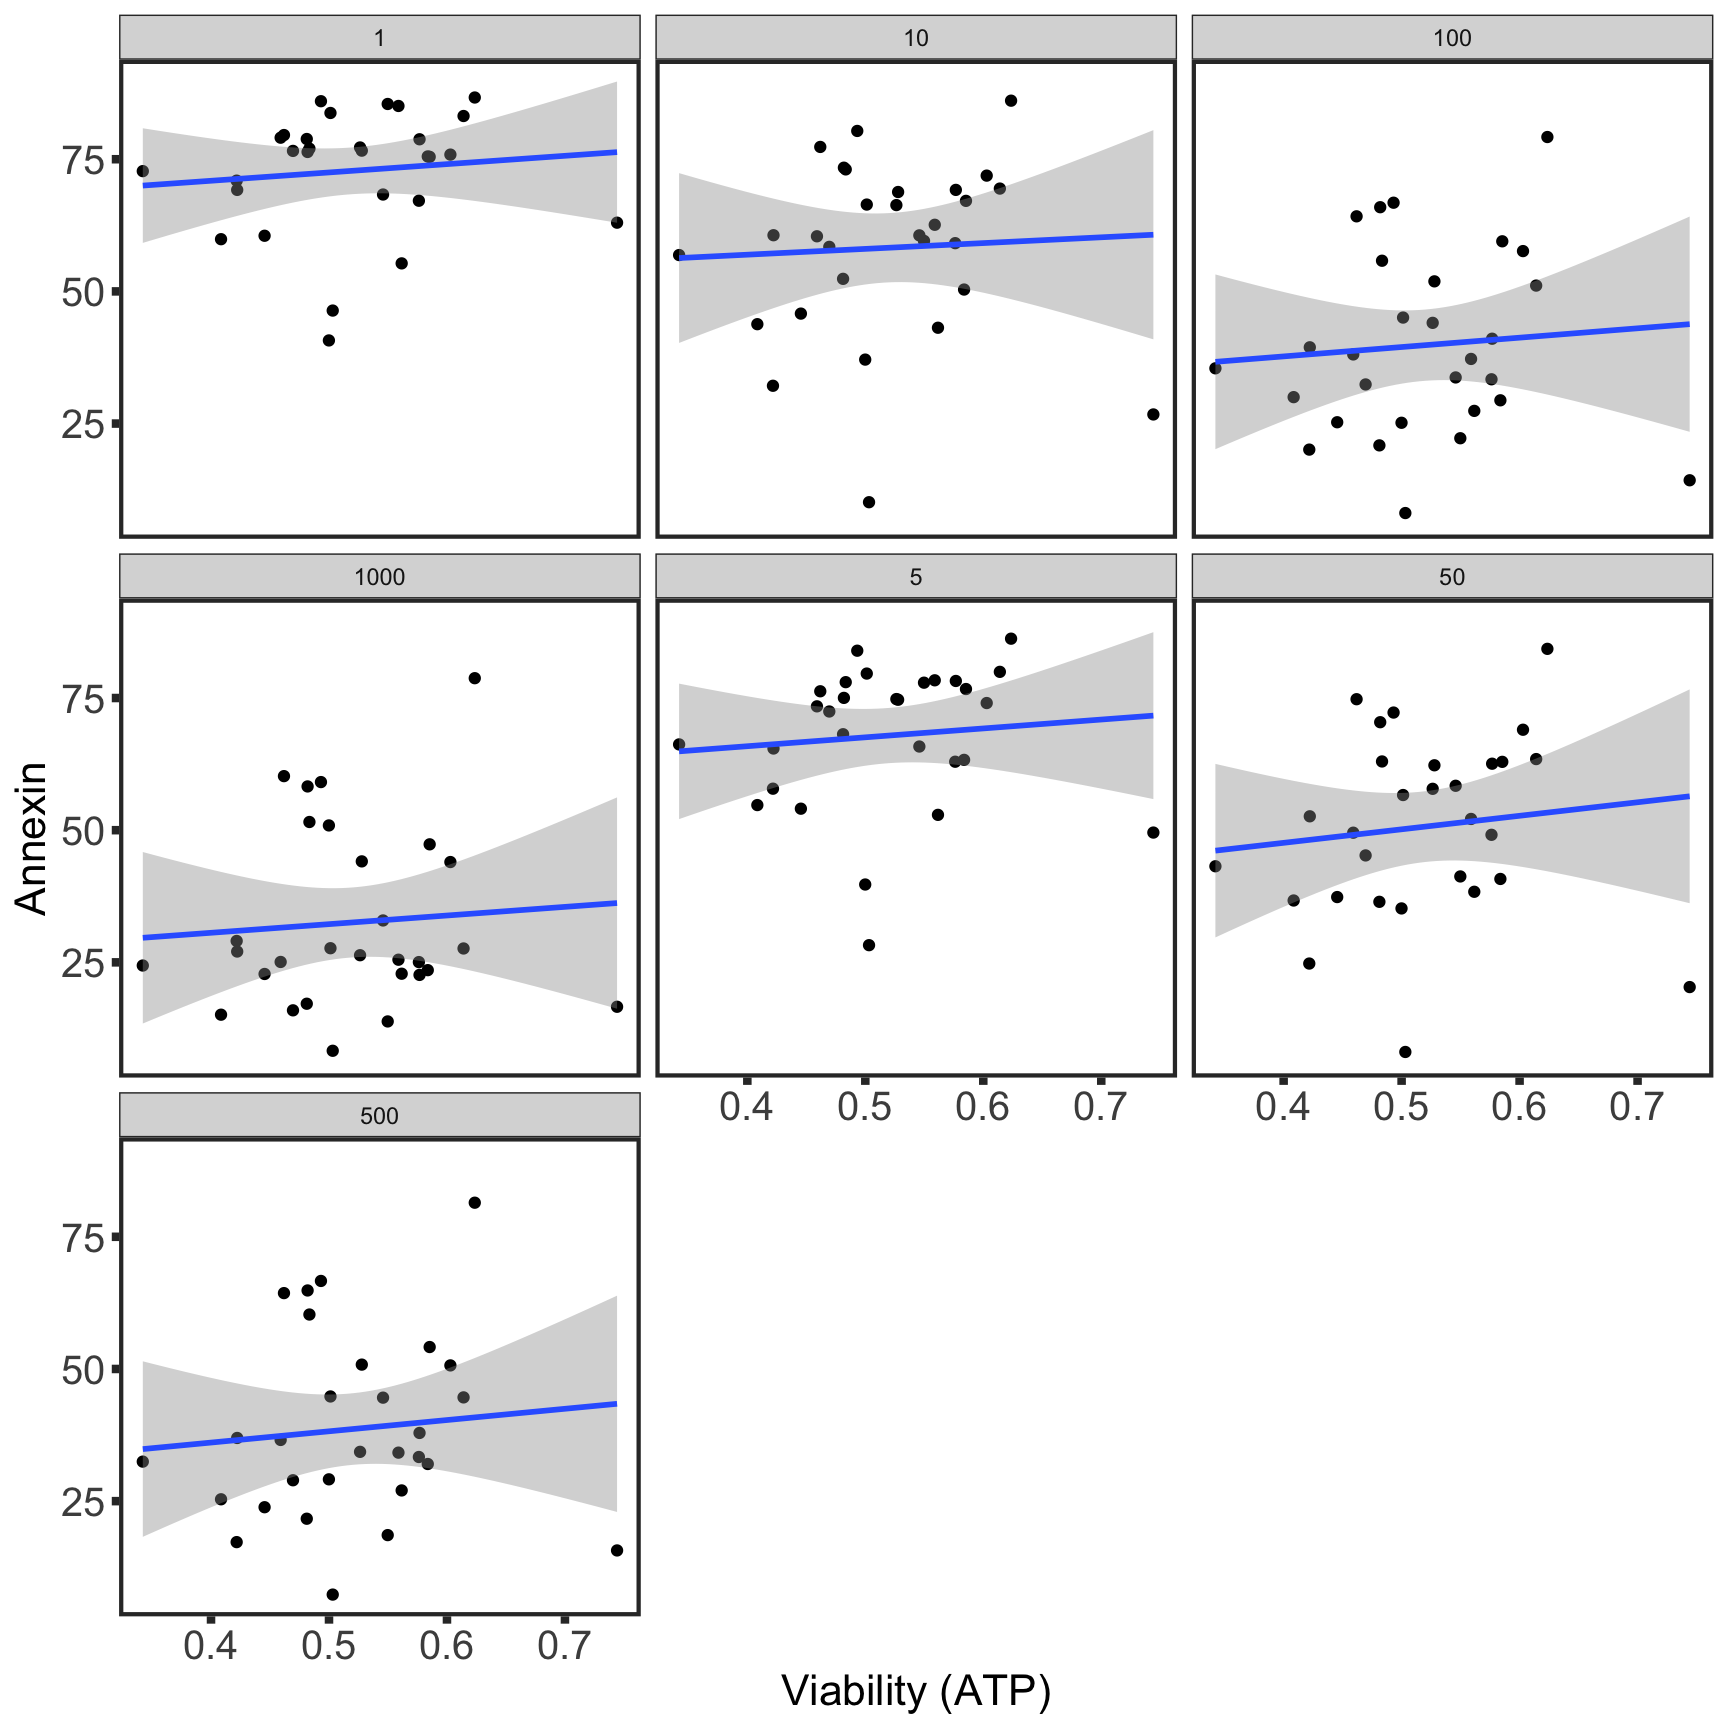
Scatter plots showing top9 significant correlations
If multiple concentrations are identified as significant, only show the most significant concentration. 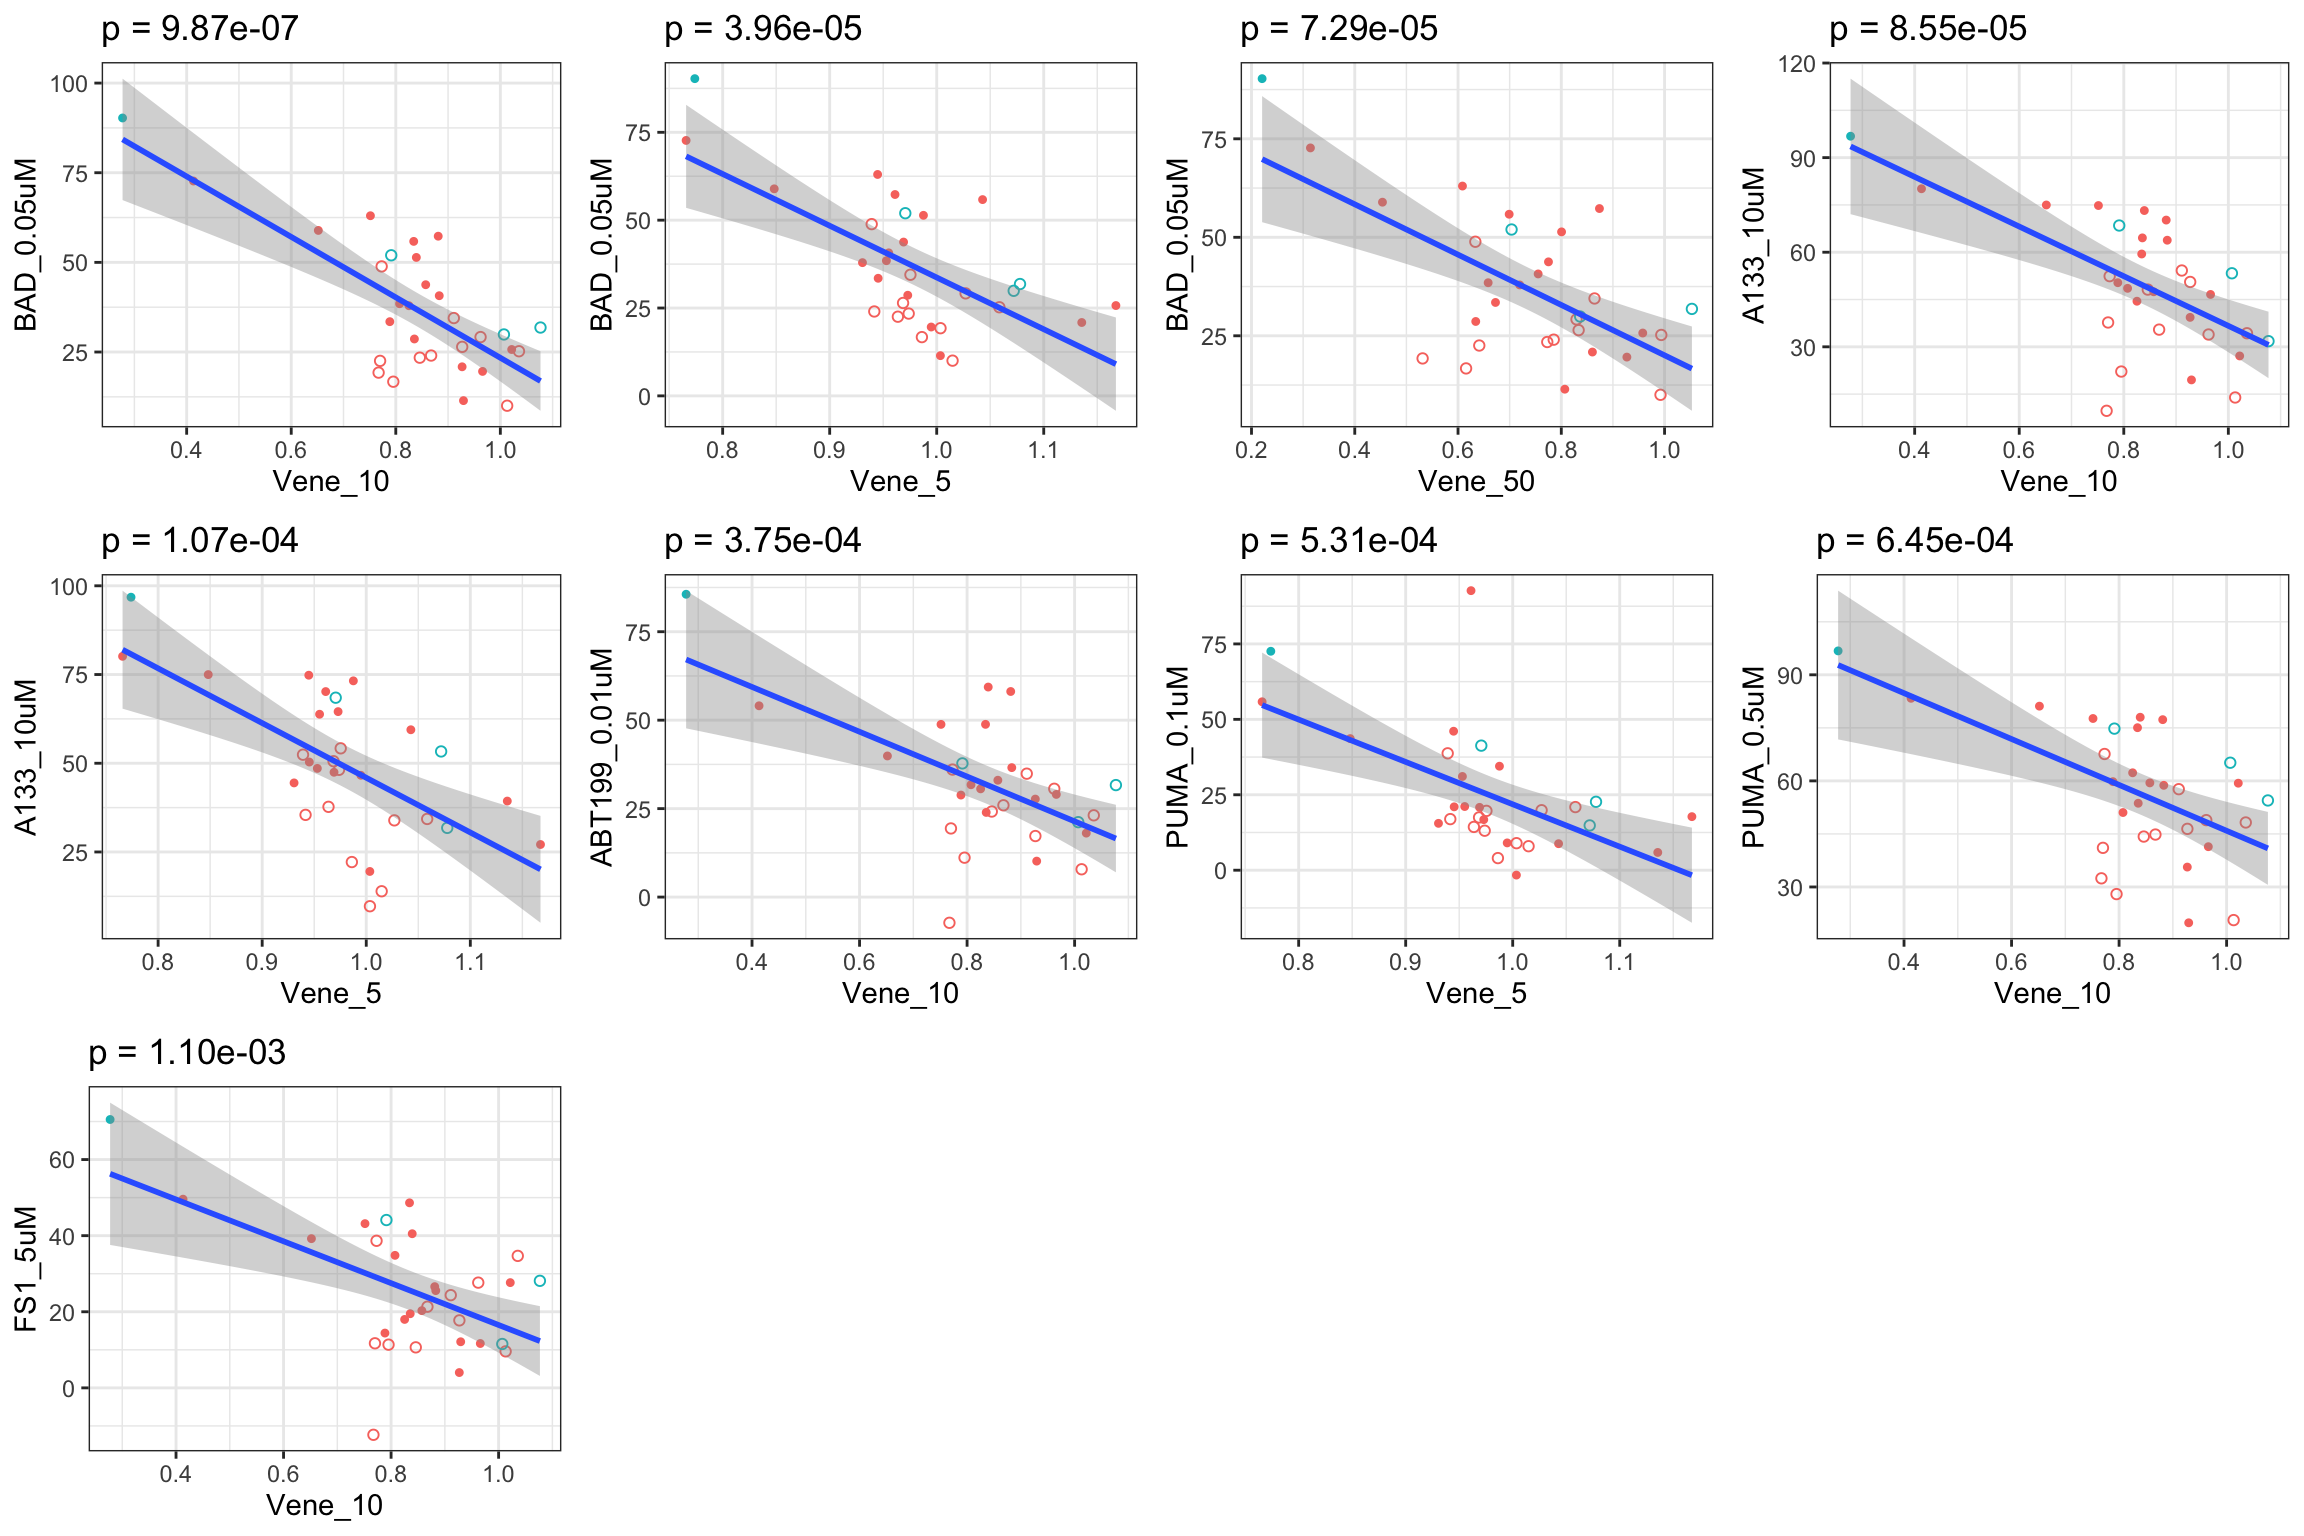
Correlation with combined effect
Table of significant correlations
P-value histogram
Summarise plot for all concentrations
Scatter plots showing significant correlations (1% FDR)
If multiple concentrations are identified as significant, only show the most significant concentration. 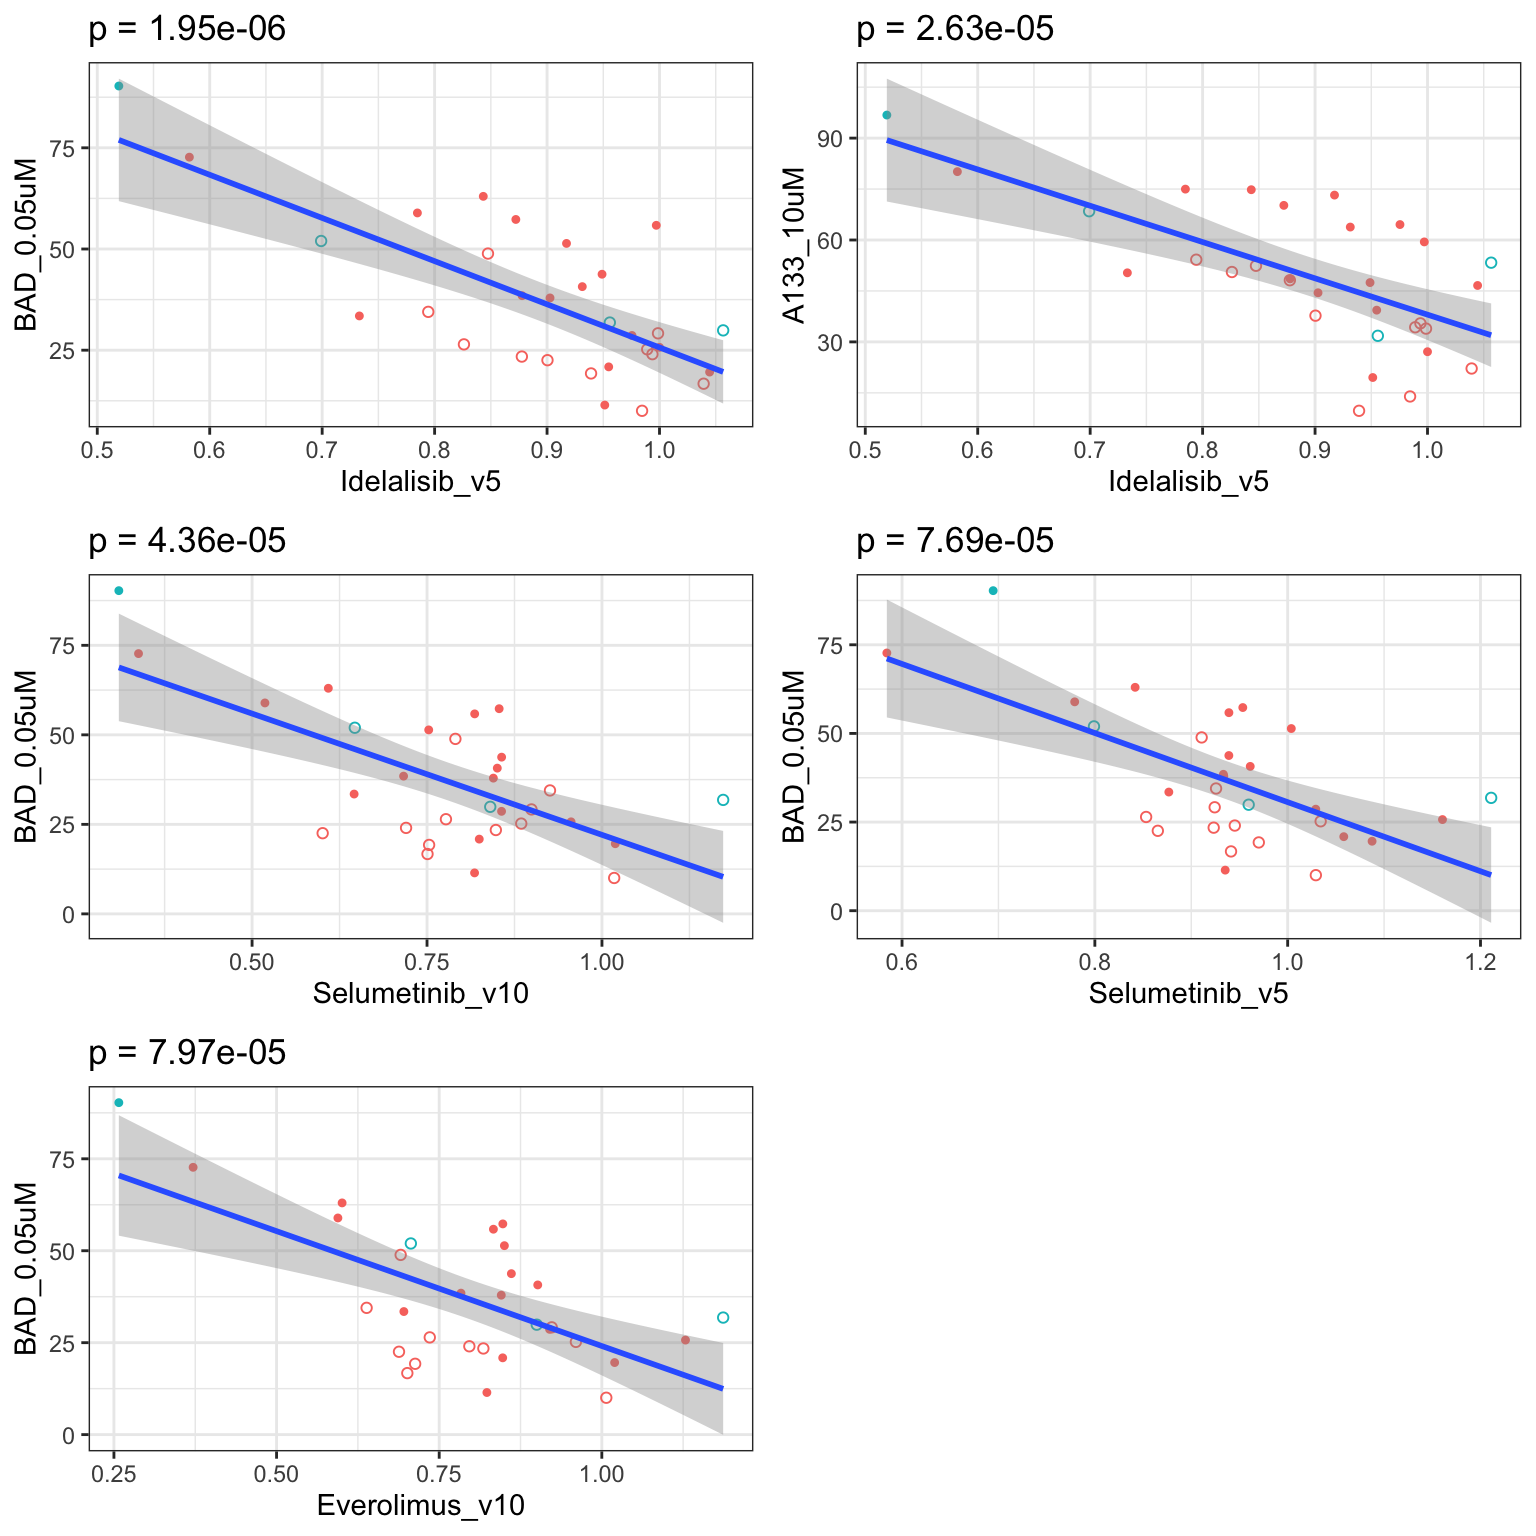
Correlation with synergistic effect (combination index: CI)
Table of significant correlations
P-value histogram
Summarise plot for all concentrations
Scatter plots showing significant correlations (10% FDR)
If multiple concentrations are identified as significant, only show the most significant concentration. 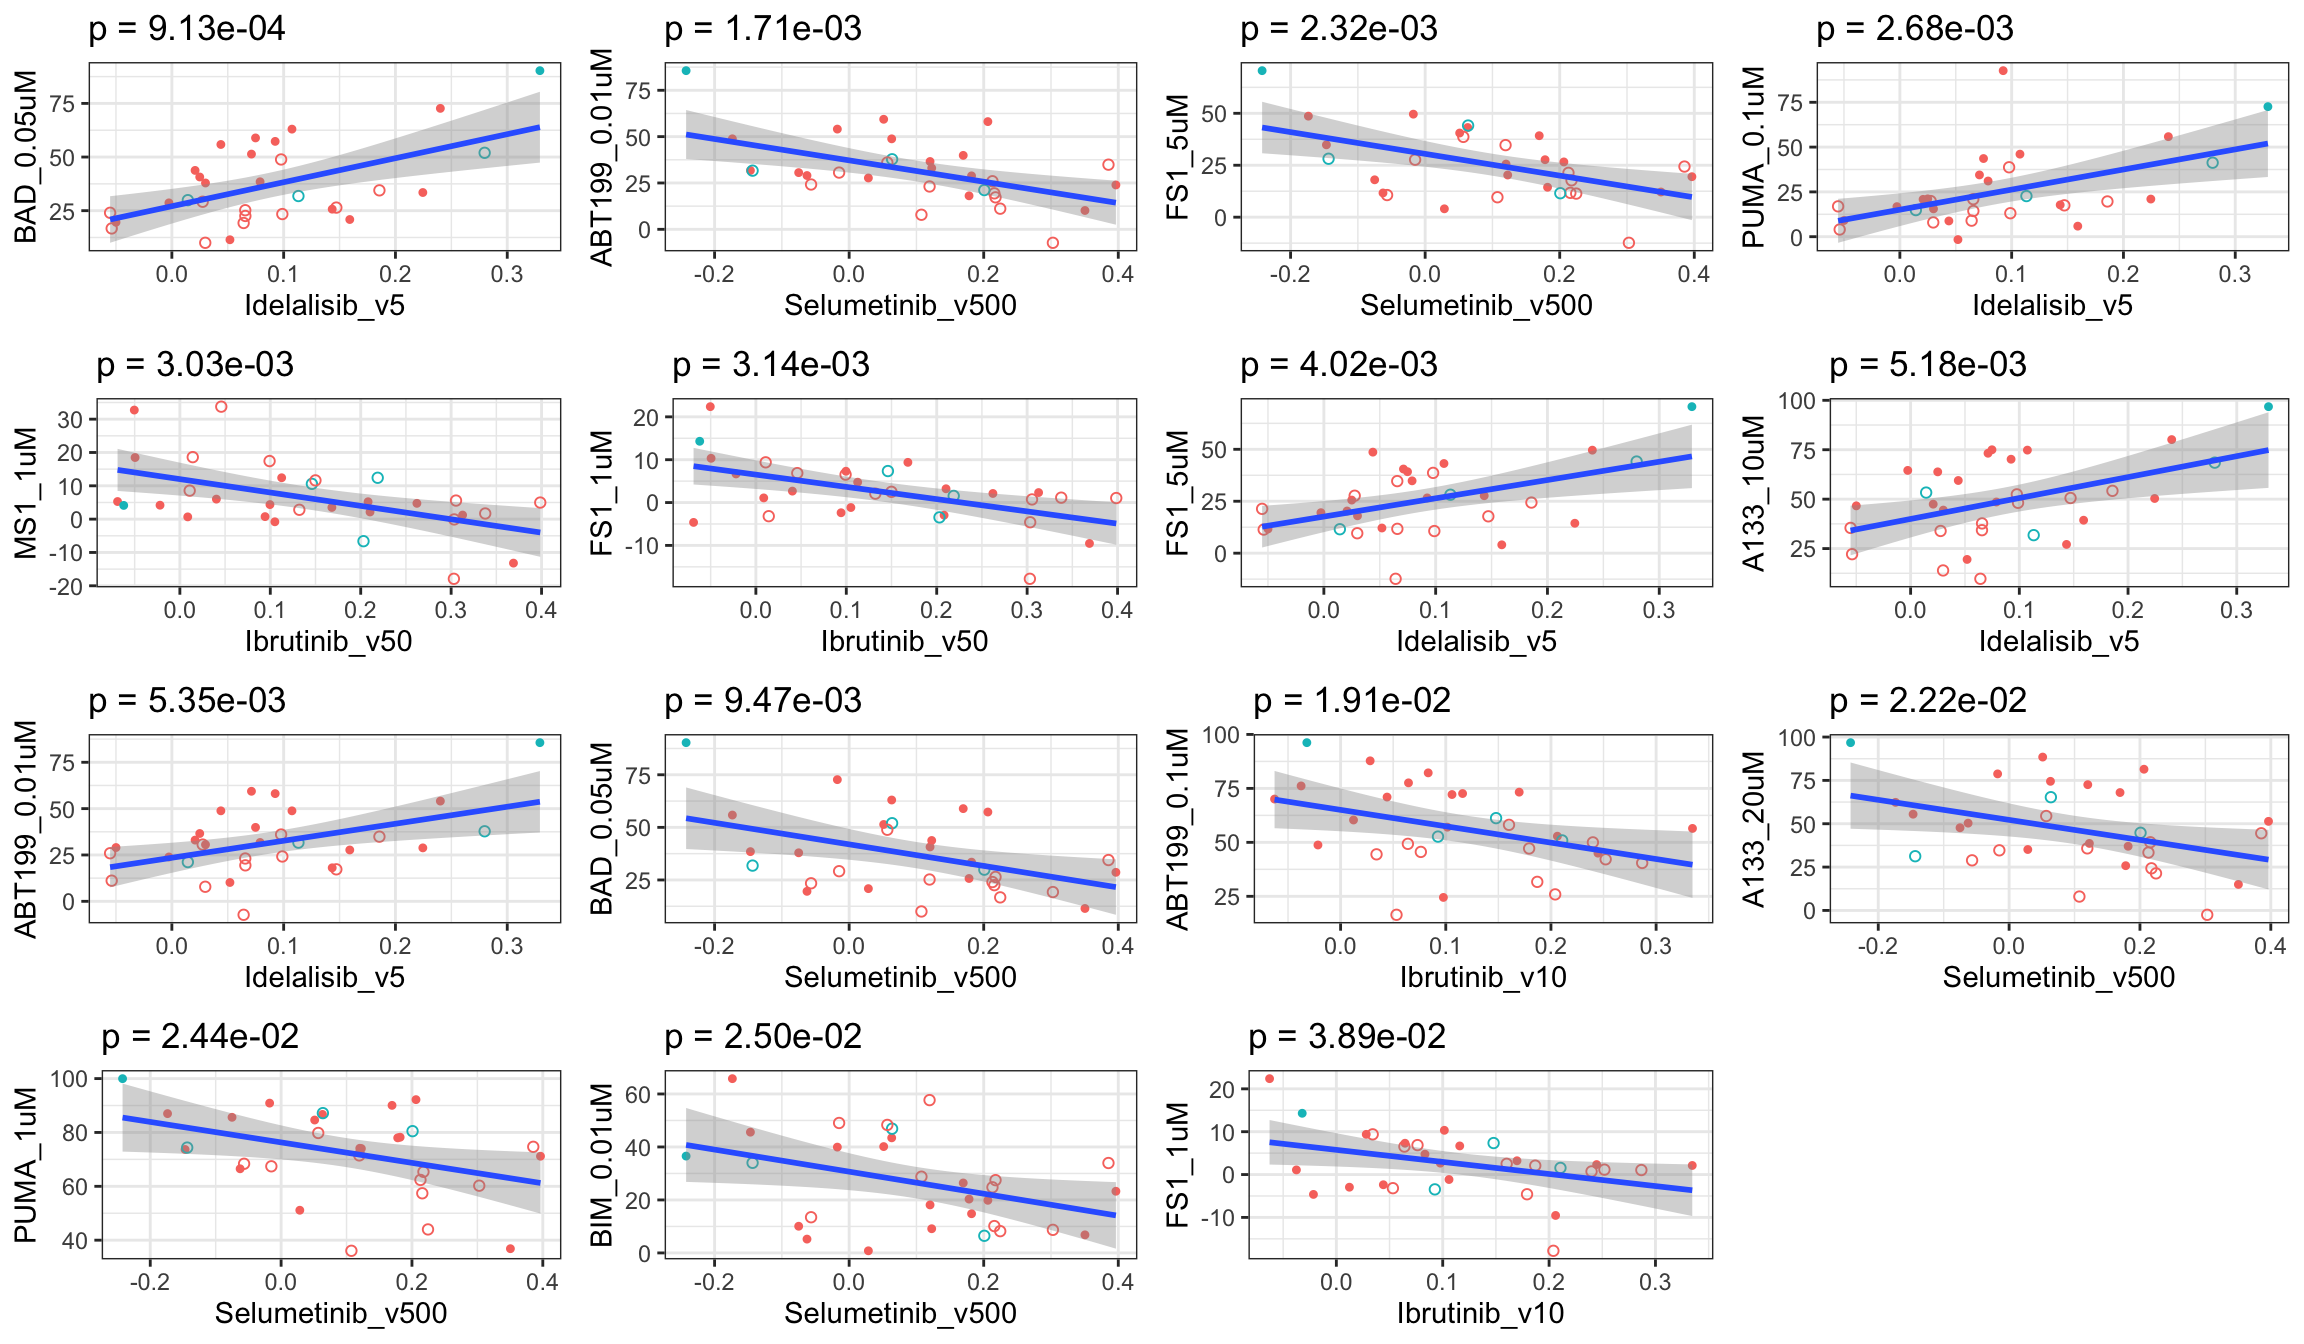 Higher CI value means more synergy in drug combinations
In vivo responses
Table of significant associations (P<0.05)
P-value histogram
Scatter plots showing significant associations (p <0.05)
If multiple concentrations are identified as significant, only show the most significant concentration. 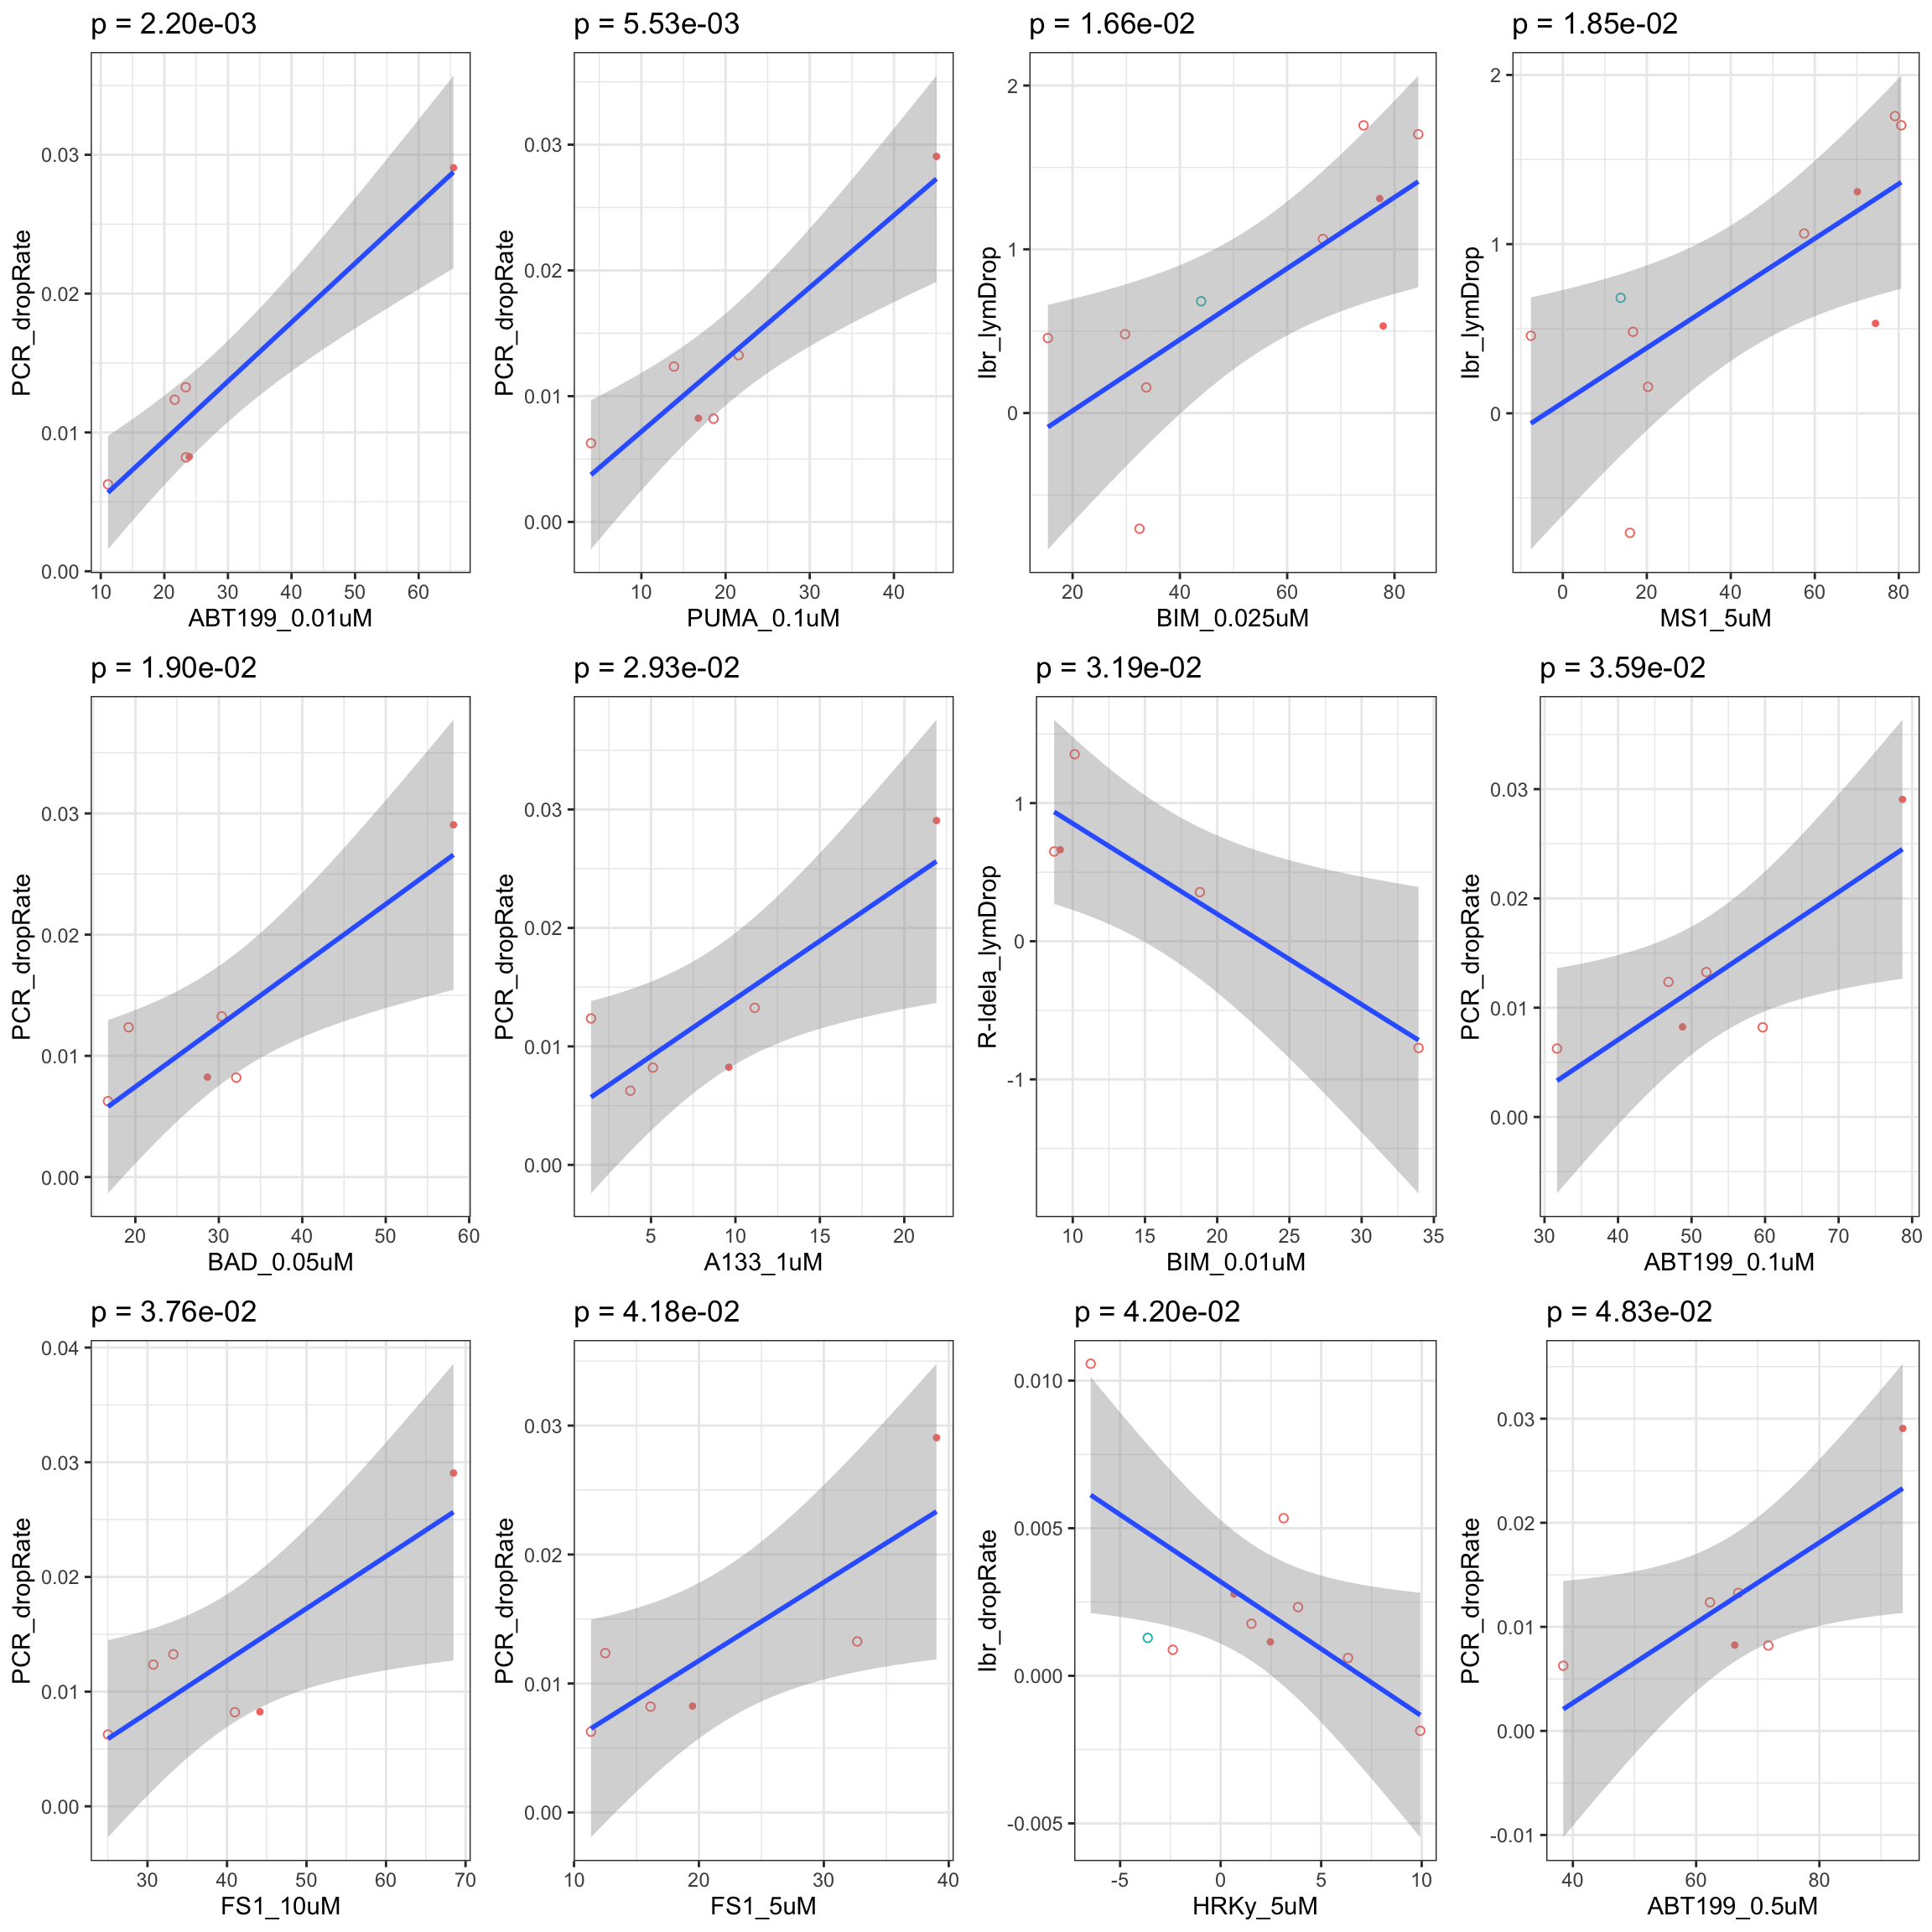
In vivo responses and annexin data
Table of significant associations (P<0.05)
Scatter plots showing significant associations (p <0.05)
If multiple concentrations are identified as significant, only show the most significant concentration. 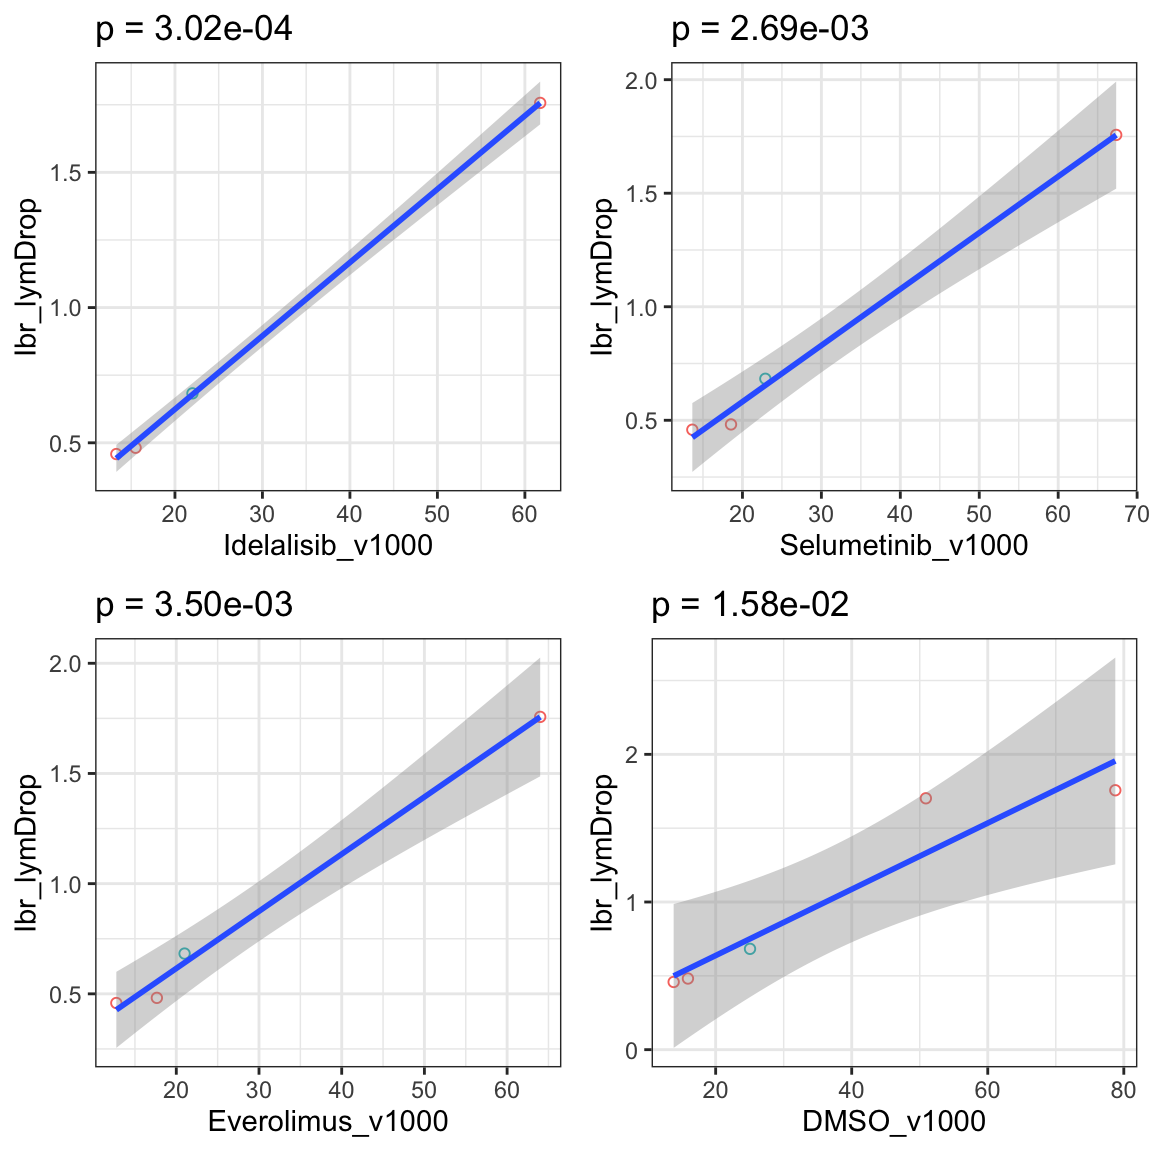
Comparability between viability screen and Annexin data
IC50 screen
For kinase inhibitors
No venetoclax 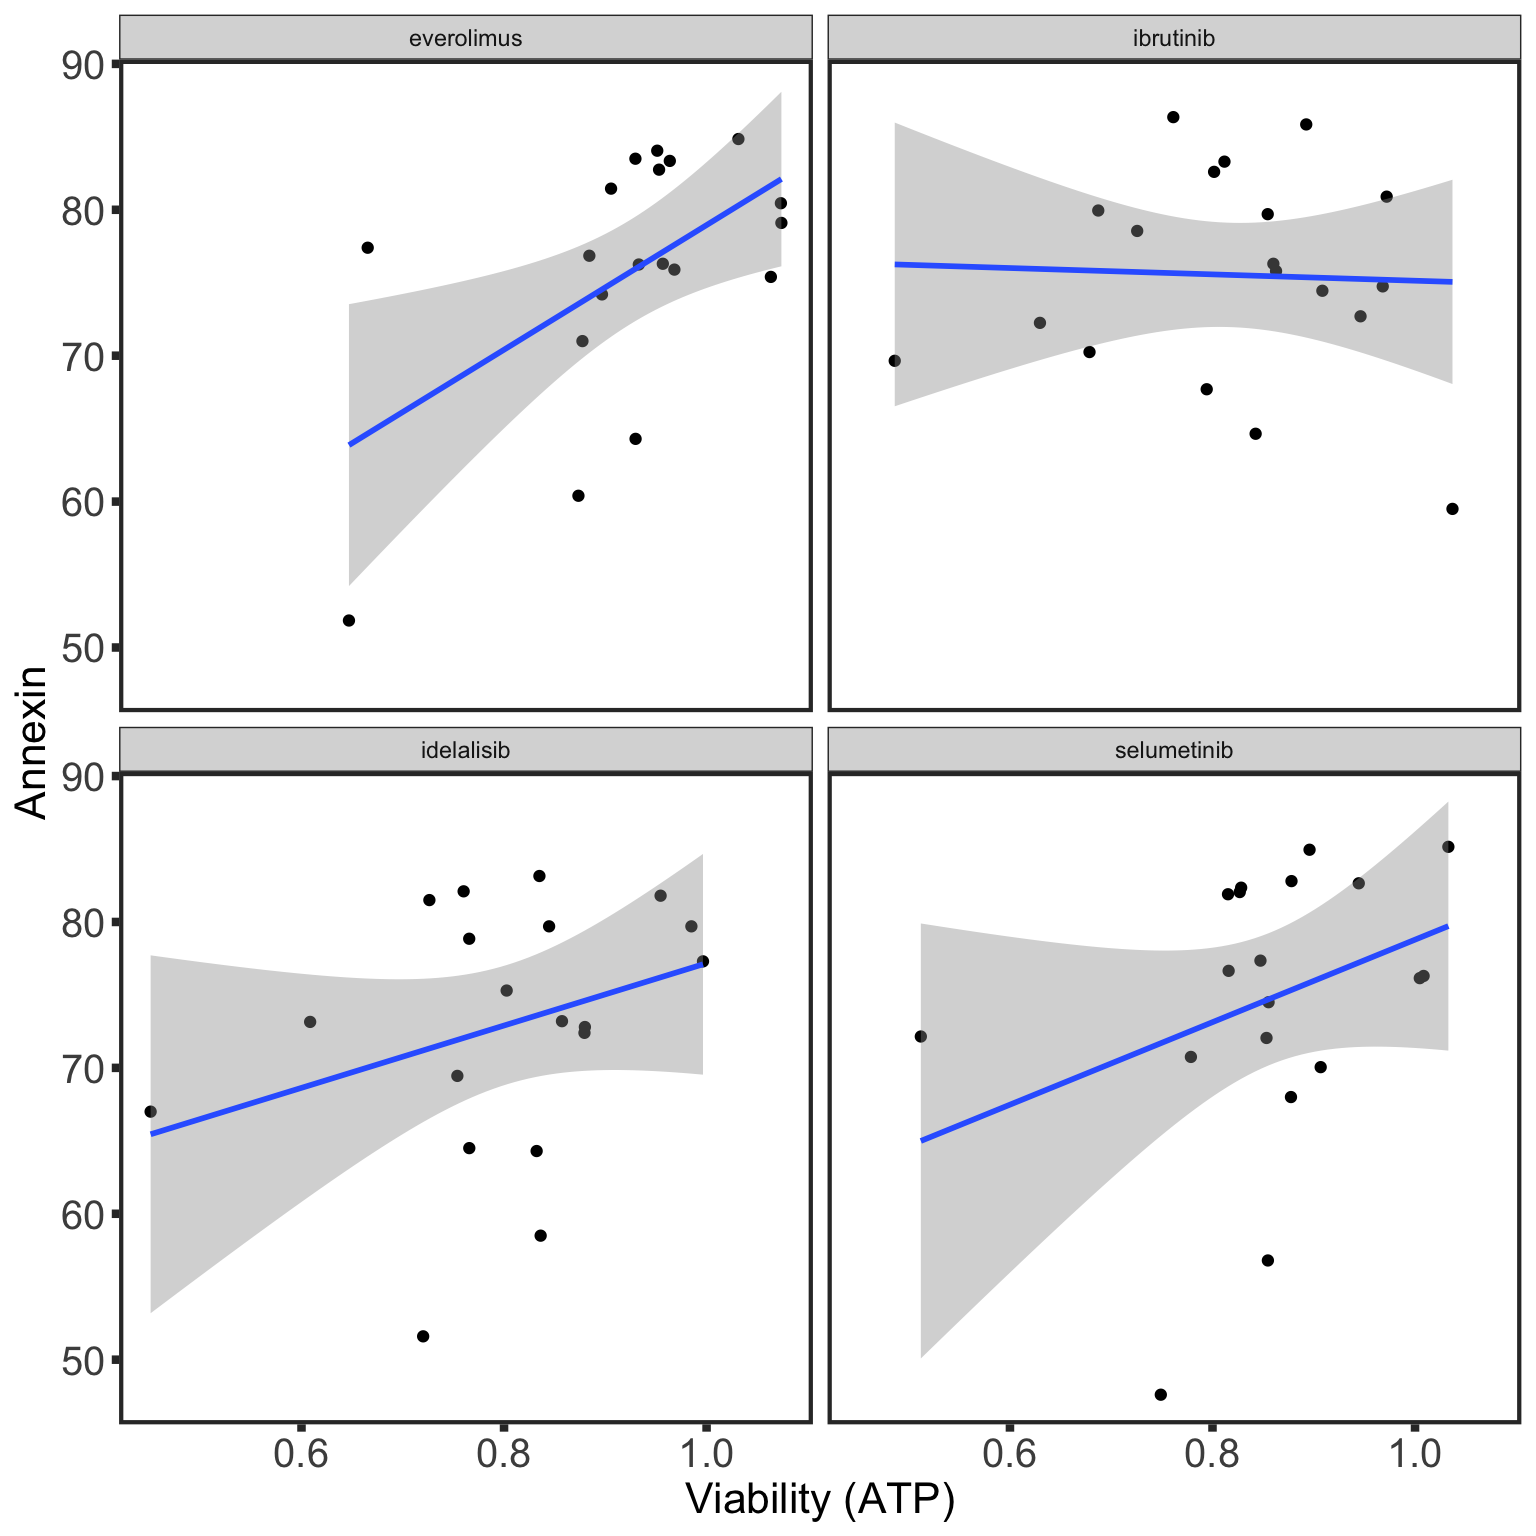
With 10 nM venetoclax 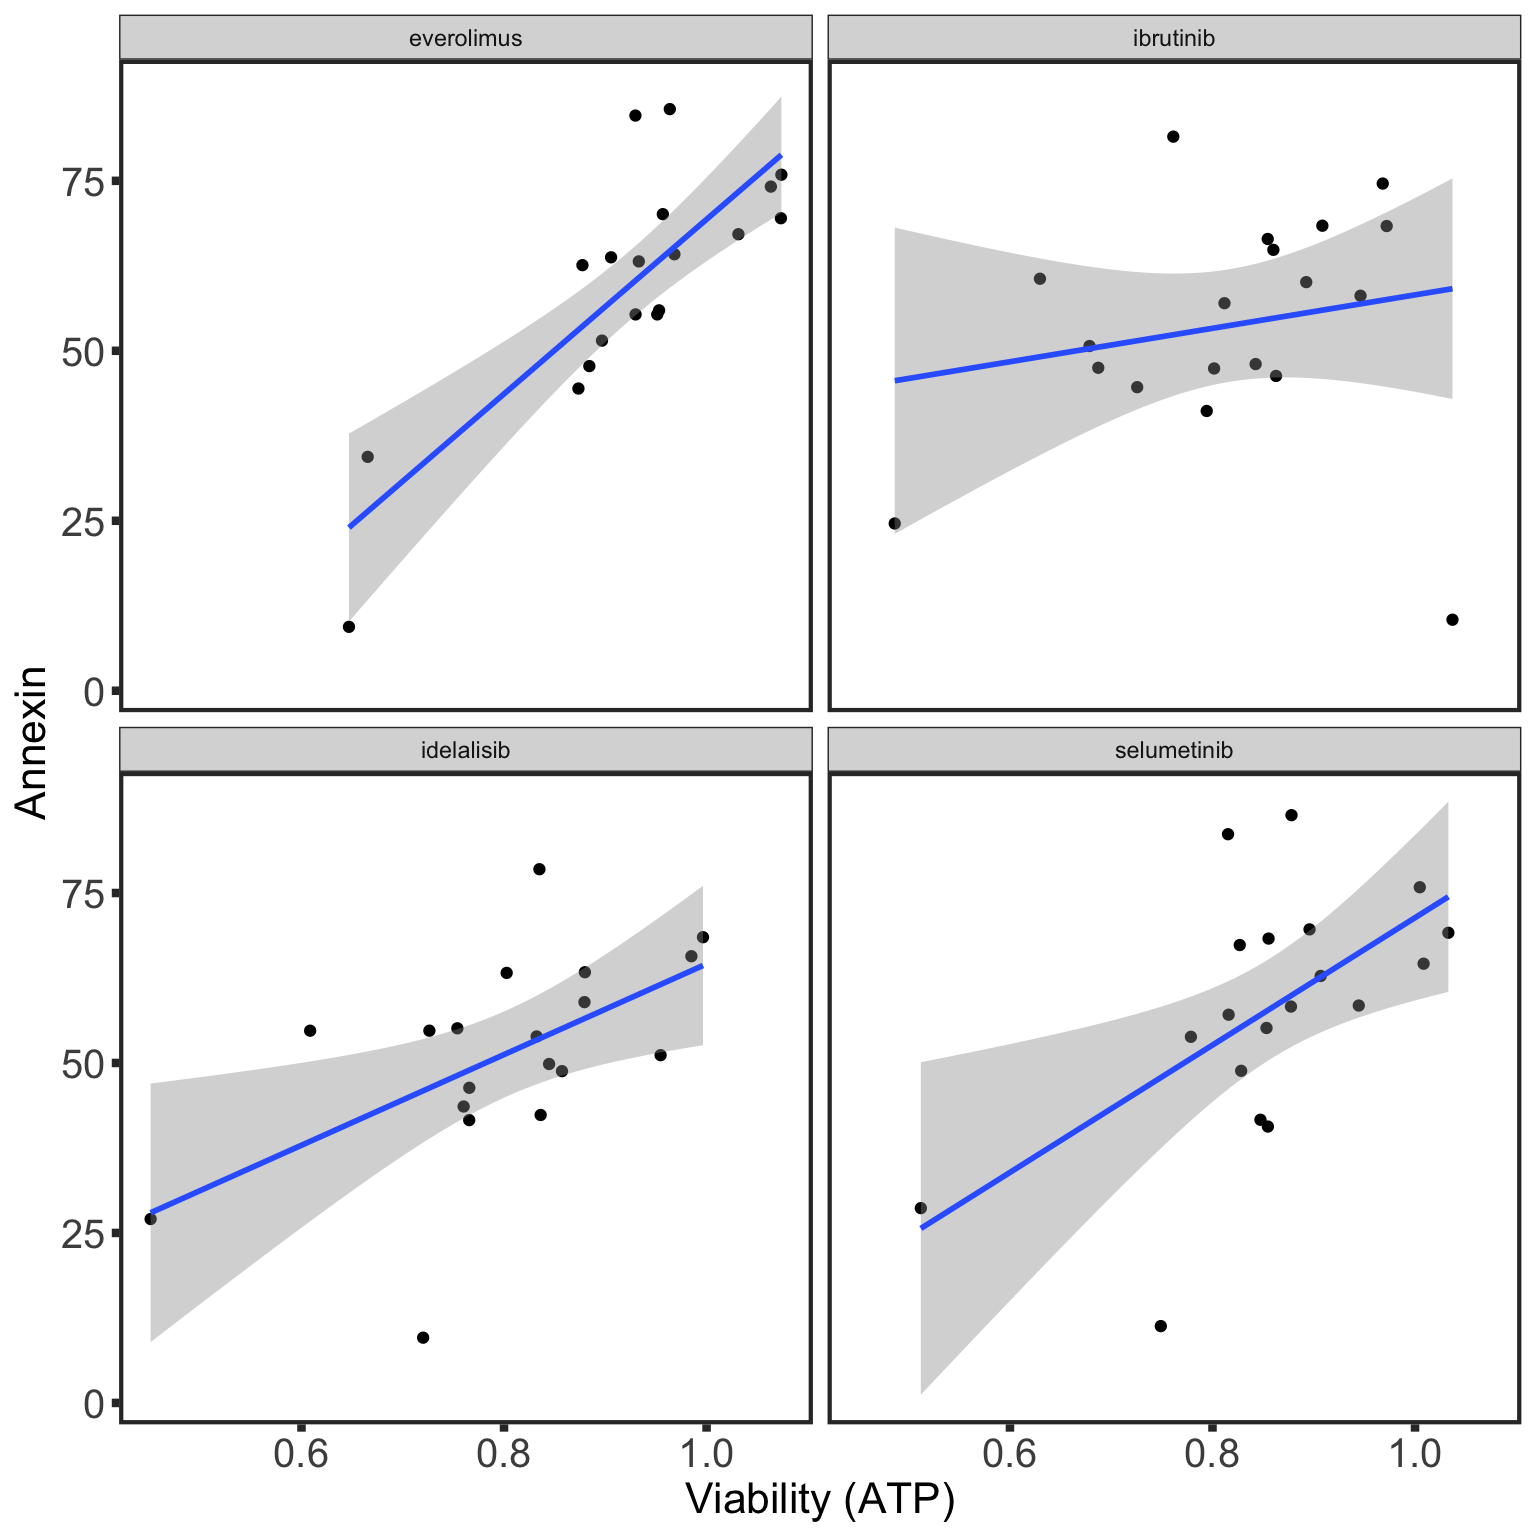
For Venetoclax
 Look comparable for most of the concentrations.
1000CPS screen
For kinase inhibitors
No venetoclax 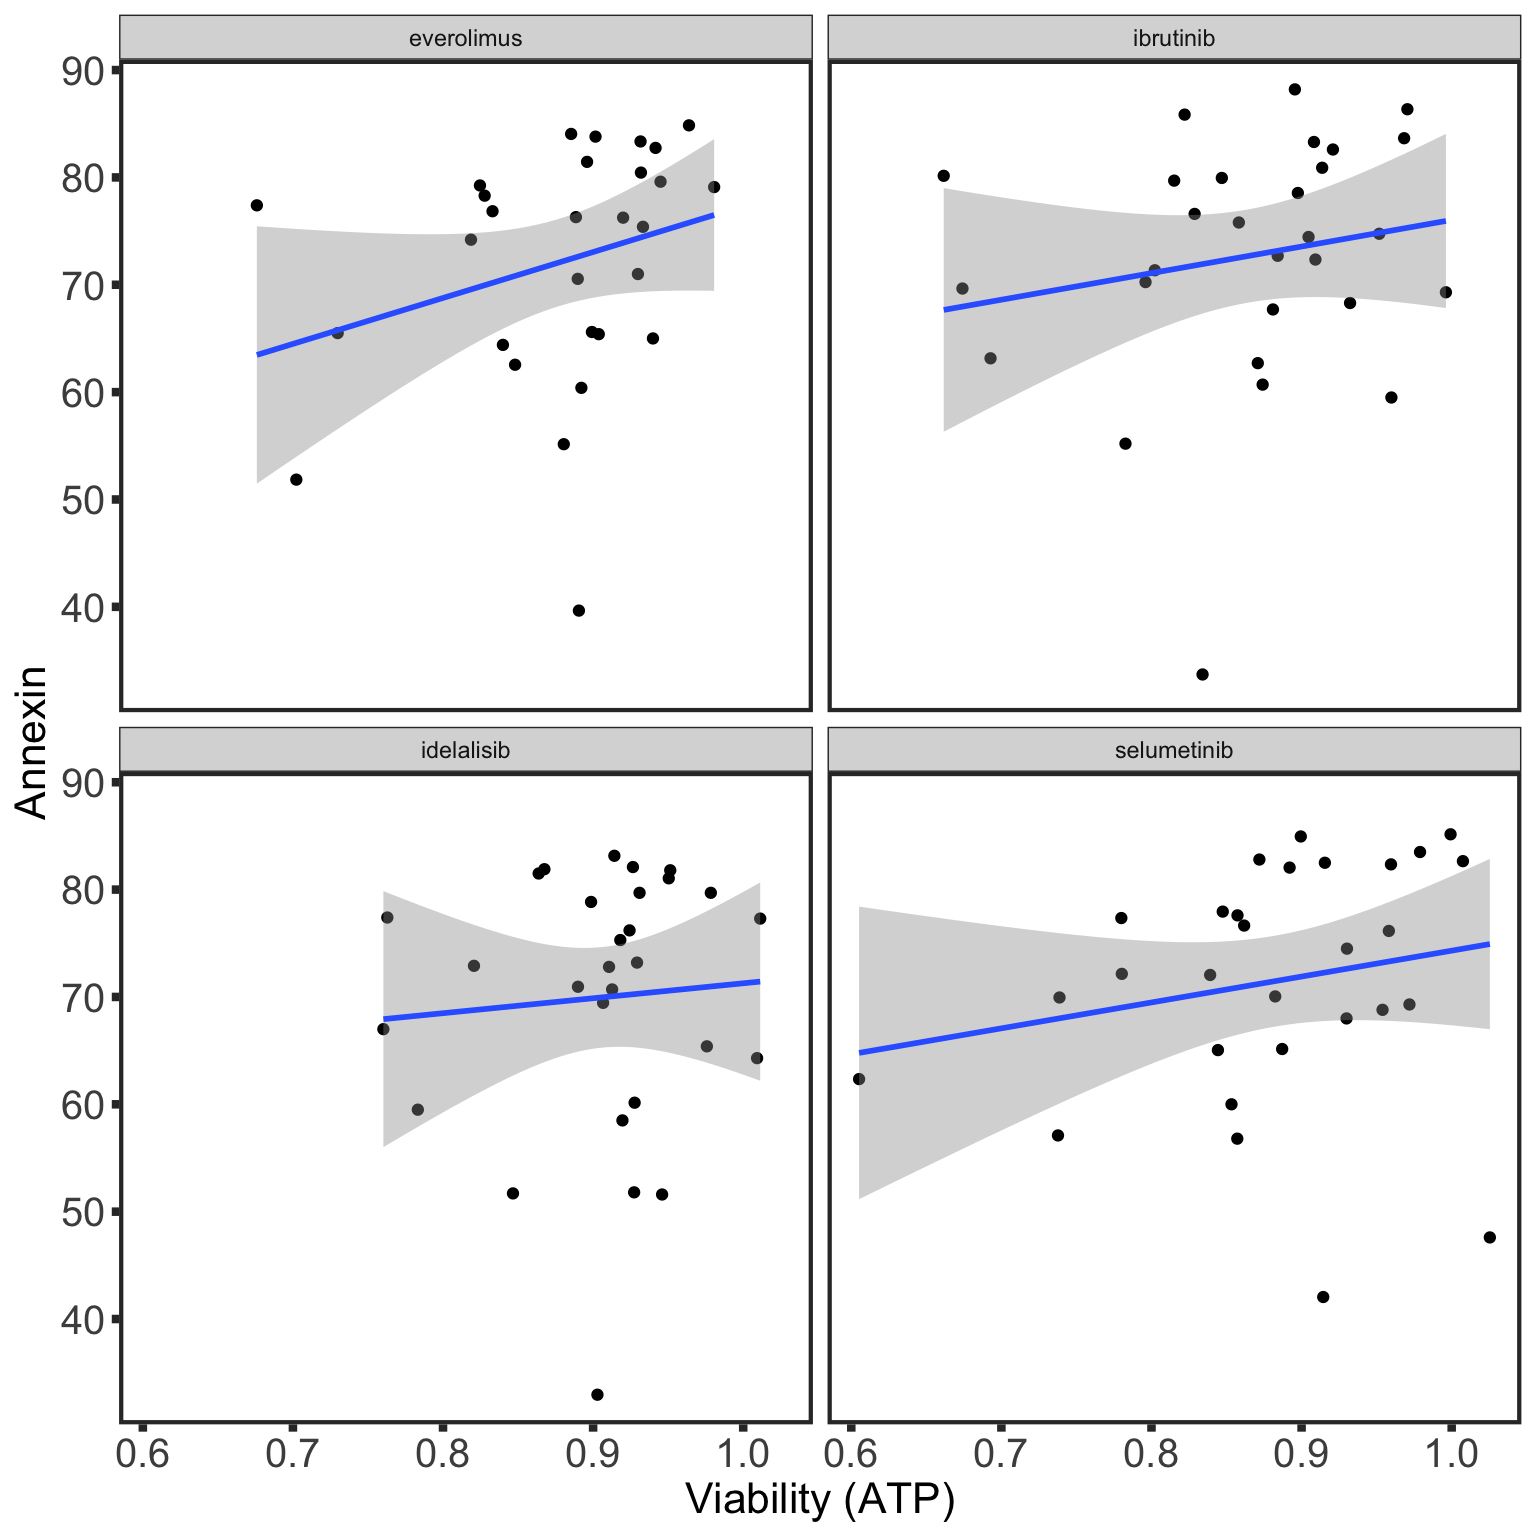
With 10 nM venetoclax 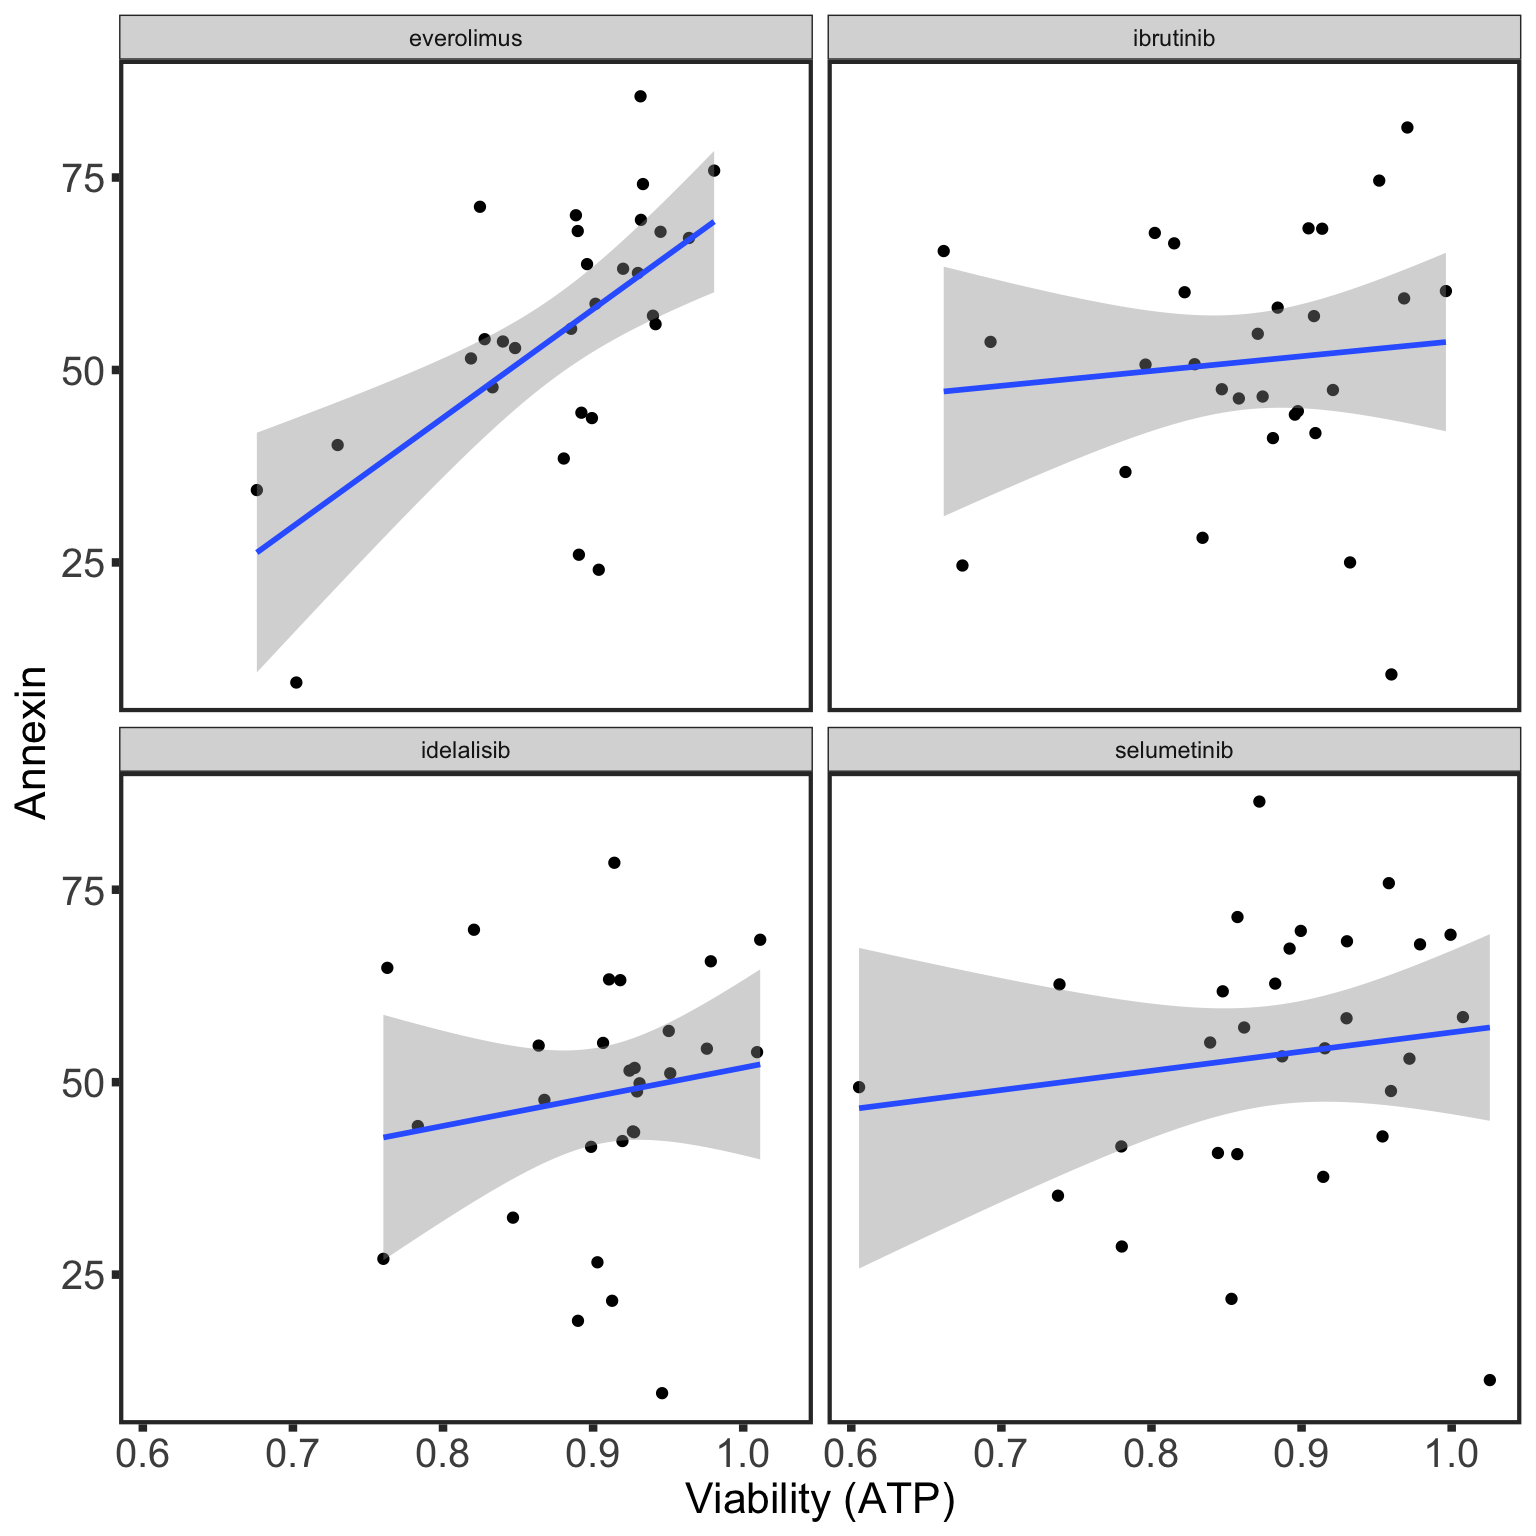
For Venetoclax
 Something strange about venetoclax in 1000CPS screen.
Multi-variate analysis for predicting drug responses
Test whether the BH3 profile can explain additional variance in drug response compared to genetic alone
IC50 screen
Data prepare
[1] 52Prepare genomics
Genes that will be included in the multivariate model
[1] "IGHV.status" "del11q"      "del13q"      "del17p"      "trisomy12"
[6] "NOTCH1"      "SF3B1"       "TP53"
Test
Which peptides and concentrations are more informative?
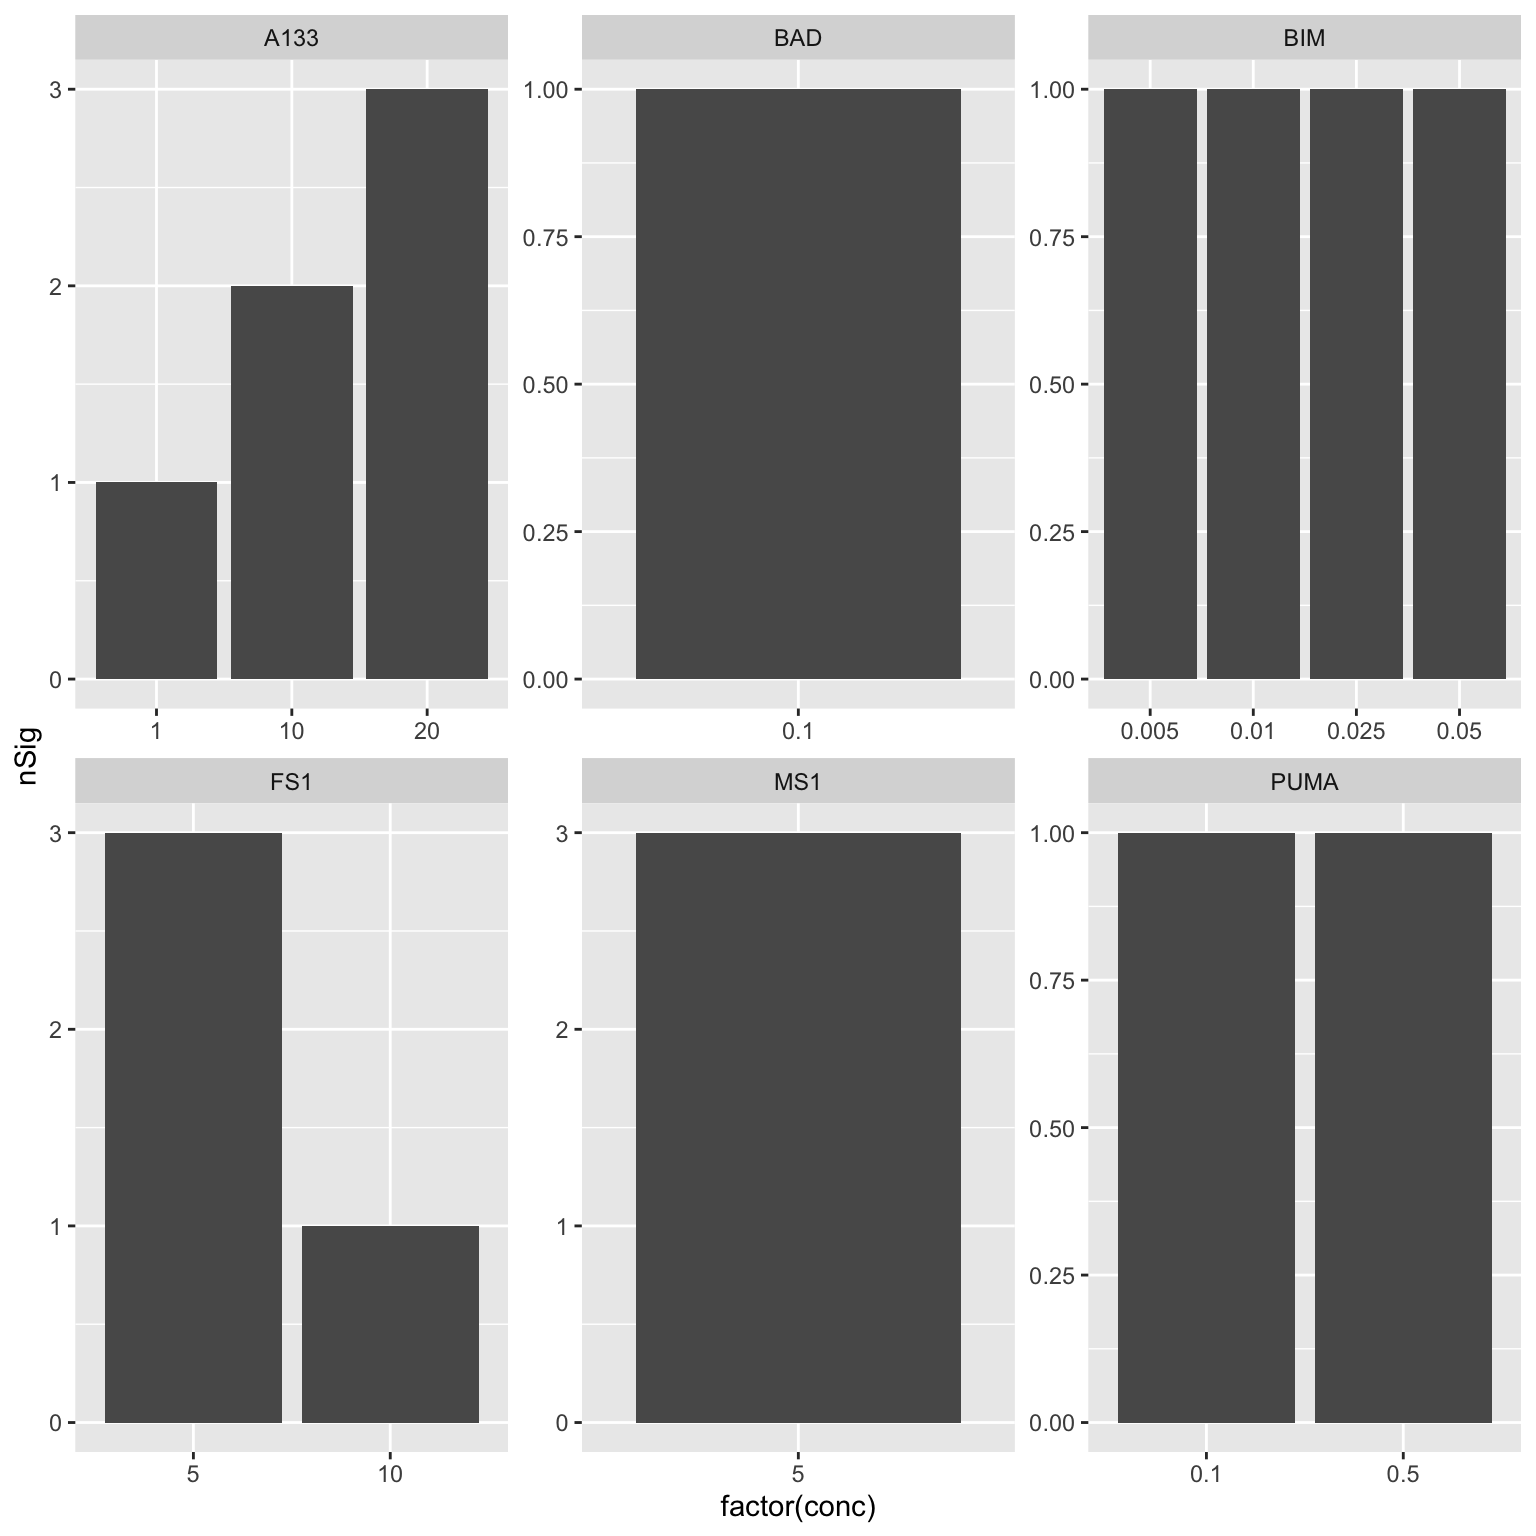 This can help with concentration selection. We want to select the concentration that shows most significant associations.
1000CPS screen
Data prepare
[1] 59Prepare genomics
Genes that will be included in the multivariate model
[1] "IGHV.status" "del11q"      "del13q"      "del17p"      "trisomy12"
[6] "NOTCH1"      "SF3B1"       "TP53"
Test
Which peptides and concentrations are more informative?
R version 3.6.0 (2019-04-26)
Platform: x86_64-apple-darwin15.6.0 (64-bit)
Running under: macOS  10.15.6

Matrix products: default
BLAS:   /Library/Frameworks/R.framework/Versions/3.6/Resources/lib/libRblas.0.dylib
LAPACK: /Library/Frameworks/R.framework/Versions/3.6/Resources/lib/libRlapack.dylib

locale:
[1] en_US.UTF-8/en_US.UTF-8/en_US.UTF-8/C/en_US.UTF-8/en_US.UTF-8

attached base packages:
[1] parallel  stats4    stats     graphics  grDevices utils     datasets
[8] methods   base

other attached packages:
 [1] latex2exp_0.4.0             forcats_0.5.0
 [3] stringr_1.4.0               dplyr_1.0.0
 [5] purrr_0.3.4                 readr_1.3.1
 [7] tidyr_1.1.0                 tibble_3.0.3
 [9] ggplot2_3.3.2               tidyverse_1.3.0
[11] SummarizedExperiment_1.16.1 DelayedArray_0.12.3
[13] BiocParallel_1.20.1         matrixStats_0.56.0
[15] Biobase_2.46.0              GenomicRanges_1.38.0
[17] GenomeInfoDb_1.22.1         IRanges_2.20.2
[19] S4Vectors_0.24.4            BiocGenerics_0.32.0
[21] IHW_1.14.0                  limma_3.42.2
[23] cowplot_1.0.0               qgraph_1.6.5
[25] jyluMisc_0.1.5

loaded via a namespace (and not attached):
  [1] shinydashboard_0.7.1   tidyselect_1.1.0       htmlwidgets_1.5.1
  [4] grid_3.6.0             maxstat_0.7-25         munsell_0.5.0
  [7] codetools_0.2-16       DT_0.14                withr_2.2.0
 [10] colorspace_1.4-1       knitr_1.29             rstudioapi_0.11
 [13] ggsignif_0.6.0         labeling_0.3           huge_1.3.4.1
 [16] git2r_0.27.1           slam_0.1-47            GenomeInfoDbData_1.2.2
 [19] lpsymphony_1.14.0      mnormt_1.5-5           KMsurv_0.1-5
 [22] farver_2.0.3           rprojroot_1.3-2        vctrs_0.3.1
 [25] generics_0.0.2         TH.data_1.0-10         xfun_0.15
 [28] sets_1.0-18            R6_2.4.1               bitops_1.0-6
 [31] fgsea_1.12.0           assertthat_0.2.1       promises_1.1.1
 [34] scales_1.1.1           multcomp_1.4-13        nnet_7.3-14
 [37] gtable_0.3.0           sandwich_2.5-1         workflowr_1.6.2
 [40] rlang_0.4.7            splines_3.6.0          rstatix_0.6.0
 [43] acepack_1.4.1          broom_0.7.0            checkmate_2.0.0
 [46] yaml_2.2.1             reshape2_1.4.4         abind_1.4-5
 [49] modelr_0.1.8           crosstalk_1.1.0.1      d3Network_0.5.2.1
 [52] backports_1.1.8        httpuv_1.5.4           Hmisc_4.4-0
 [55] tools_3.6.0            relations_0.6-9        psych_1.9.12.31
 [58] lavaan_0.6-6           ellipsis_0.3.1         gplots_3.0.4
 [61] RColorBrewer_1.1-2     Rcpp_1.0.5             plyr_1.8.6
 [64] base64enc_0.1-3        visNetwork_2.0.9       zlibbioc_1.32.0
 [67] RCurl_1.98-1.2         ggpubr_0.4.0           rpart_4.1-15
 [70] pbapply_1.4-2          zoo_1.8-8              haven_2.3.1
 [73] cluster_2.1.0          exactRankTests_0.8-31  fs_1.4.2
 [76] magrittr_1.5           data.table_1.12.8      openxlsx_4.1.5
 [79] reprex_0.3.0           survminer_0.4.7        mvtnorm_1.1-1
 [82] whisker_0.4            hms_0.5.3              shinyjs_1.1
 [85] mime_0.9               evaluate_0.14          xtable_1.8-4
 [88] rio_0.5.16             jpeg_0.1-8.1           readxl_1.3.1
 [91] gridExtra_2.3          compiler_3.6.0         KernSmooth_2.23-17
 [94] crayon_1.3.4           htmltools_0.5.0        mgcv_1.8-31
 [97] corpcor_1.6.9          later_1.1.0.1          Formula_1.2-3
[100] lubridate_1.7.9        DBI_1.1.0              dbplyr_1.4.4
[103] MASS_7.3-51.6          Matrix_1.2-18          car_3.0-8
[106] cli_2.0.2              marray_1.64.0          gdata_2.18.0
[109] igraph_1.2.5           BDgraph_2.62           pkgconfig_2.0.3
[112] km.ci_0.5-2            foreign_0.8-71         piano_2.2.0
[115] xml2_1.3.2             pbivnorm_0.6.0         XVector_0.26.0
[118] drc_3.0-1              rvest_0.3.5            digest_0.6.25
[121] rmarkdown_2.3          cellranger_1.1.0       fastmatch_1.1-0
[124] survMisc_0.5.5         htmlTable_2.0.1        curl_4.3
[127] shiny_1.5.0            gtools_3.8.2           rjson_0.2.20
[130] lifecycle_0.2.0        nlme_3.1-148           glasso_1.11
[133] jsonlite_1.7.0         carData_3.0-4          fansi_0.4.1
[136] pillar_1.4.6           lattice_0.20-41        fastmap_1.0.1
[139] httr_1.4.1             plotrix_3.7-8          survival_3.2-3
[142] glue_1.4.1             zip_2.0.4              fdrtool_1.2.15
[145] png_0.1-7              stringi_1.4.6          blob_1.2.1
[148] latticeExtra_0.6-29    caTools_1.18.0