Explore the BH3 landscape of CLL estiamted by DBP (Individual concentrations)
Junyan Lu
2020 Sept. 3
Last updated: 2020-09-04
Checks: 6 1
Knit directory: BH3profiling/analysis/
This reproducible R Markdown analysis was created with workflowr (version 1.6.2). The Checks tab describes the reproducibility checks that were applied when the results were created. The Past versions tab lists the development history.
The R Markdown is untracked by Git. To know which version of the R Markdown file created these results, you'll want to first commit it to the Git repo. If you're still working on the analysis, you can ignore this warning. When you're finished, you can run wflow_publish to commit the R Markdown file and build the HTML.
Great job! The global environment was empty. Objects defined in the global environment can affect the analysis in your R Markdown file in unknown ways. For reproduciblity it's best to always run the code in an empty environment.
The command set.seed(20200826) was run prior to running the code in the R Markdown file. Setting a seed ensures that any results that rely on randomness, e.g. subsampling or permutations, are reproducible.
Great job! Recording the operating system, R version, and package versions is critical for reproducibility.
Nice! There were no cached chunks for this analysis, so you can be confident that you successfully produced the results during this run.
Great job! Using relative paths to the files within your workflowr project makes it easier to run your code on other machines.
Great! You are using Git for version control. Tracking code development and connecting the code version to the results is critical for reproducibility.
The results in this page were generated with repository version 90ada8f. See the Past versions tab to see a history of the changes made to the R Markdown and HTML files.
Note that you need to be careful to ensure that all relevant files for the analysis have been committed to Git prior to generating the results (you can use wflow_publish or wflow_git_commit). workflowr only checks the R Markdown file, but you know if there are other scripts or data files that it depends on. Below is the status of the Git repository when the results were generated:
Ignored files:
    Ignored:    .DS_Store
    Ignored:    .Rhistory
    Ignored:    .Rproj.user/
    Ignored:    analysis/.DS_Store
    Ignored:    analysis/.Rhistory
    Ignored:    analysis/drugResponse_baseBH3_analysis_cache/
    Ignored:    analysis/figure/
    Ignored:    analysis/landscape_baseBH3_analysis_AUC_cache/
    Ignored:    data/.DS_Store
    Ignored:    output/.DS_Store

Untracked files:
    Untracked:  analysis/Annexin_rawInput.Rmd
    Untracked:  analysis/BH3baseline_rawInput.Rmd
    Untracked:  analysis/BH3dynamic_rawInput.Rmd
    Untracked:  analysis/based_pep_var.pdf
    Untracked:  analysis/compareBaseline.Rmd
    Untracked:  analysis/compareBaseline.pdf
    Untracked:  analysis/deprecated/
    Untracked:  analysis/drugResponse_baseBH3_analysis.Rmd
    Untracked:  analysis/landscape_baseBH3_analysis.Rmd
    Untracked:  analysis/landscape_baseBH3_analysis_AUC.Rmd
    Untracked:  analysis/patBack.csv
    Untracked:  analysis/platePlot.pdf
    Untracked:  analysis/platePlot_dynamic.pdf
    Untracked:  analysis/predictOutcomes.Rmd
    Untracked:  code/utils.R
    Untracked:  data/Data for Thorsten .xlsx
    Untracked:  data/Raw data Baseline for Junyan.xlsx
    Untracked:  data/Raw data DBP for Junyan.xlsx
    Untracked:  data/T. Zenz data for Junyan.xlsx
    Untracked:  data/Zenz Project overview cell counts etc.xlsx
    Untracked:  data/commonFiles/
    Untracked:  output/baseBH3.RData
    Untracked:  output/dataAnnexin.RData
    Untracked:  output/dynamicBH3.RData

Unstaged changes:
    Modified:   _workflowr.yml
    Modified:   analysis/_site.yml
    Deleted:    analysis/about.Rmd
    Modified:   analysis/index.Rmd
    Deleted:    analysis/license.Rmd
Note that any generated files, e.g. HTML, png, CSS, etc., are not included in this status report because it is ok for generated content to have uncommitted changes.
There are no past versions. Publish this analysis with wflow_publish() to start tracking its development.
Load and preprocess BH3 profiling data
Load
Use baseline level from DBP profiling
Prepare sample background annotations
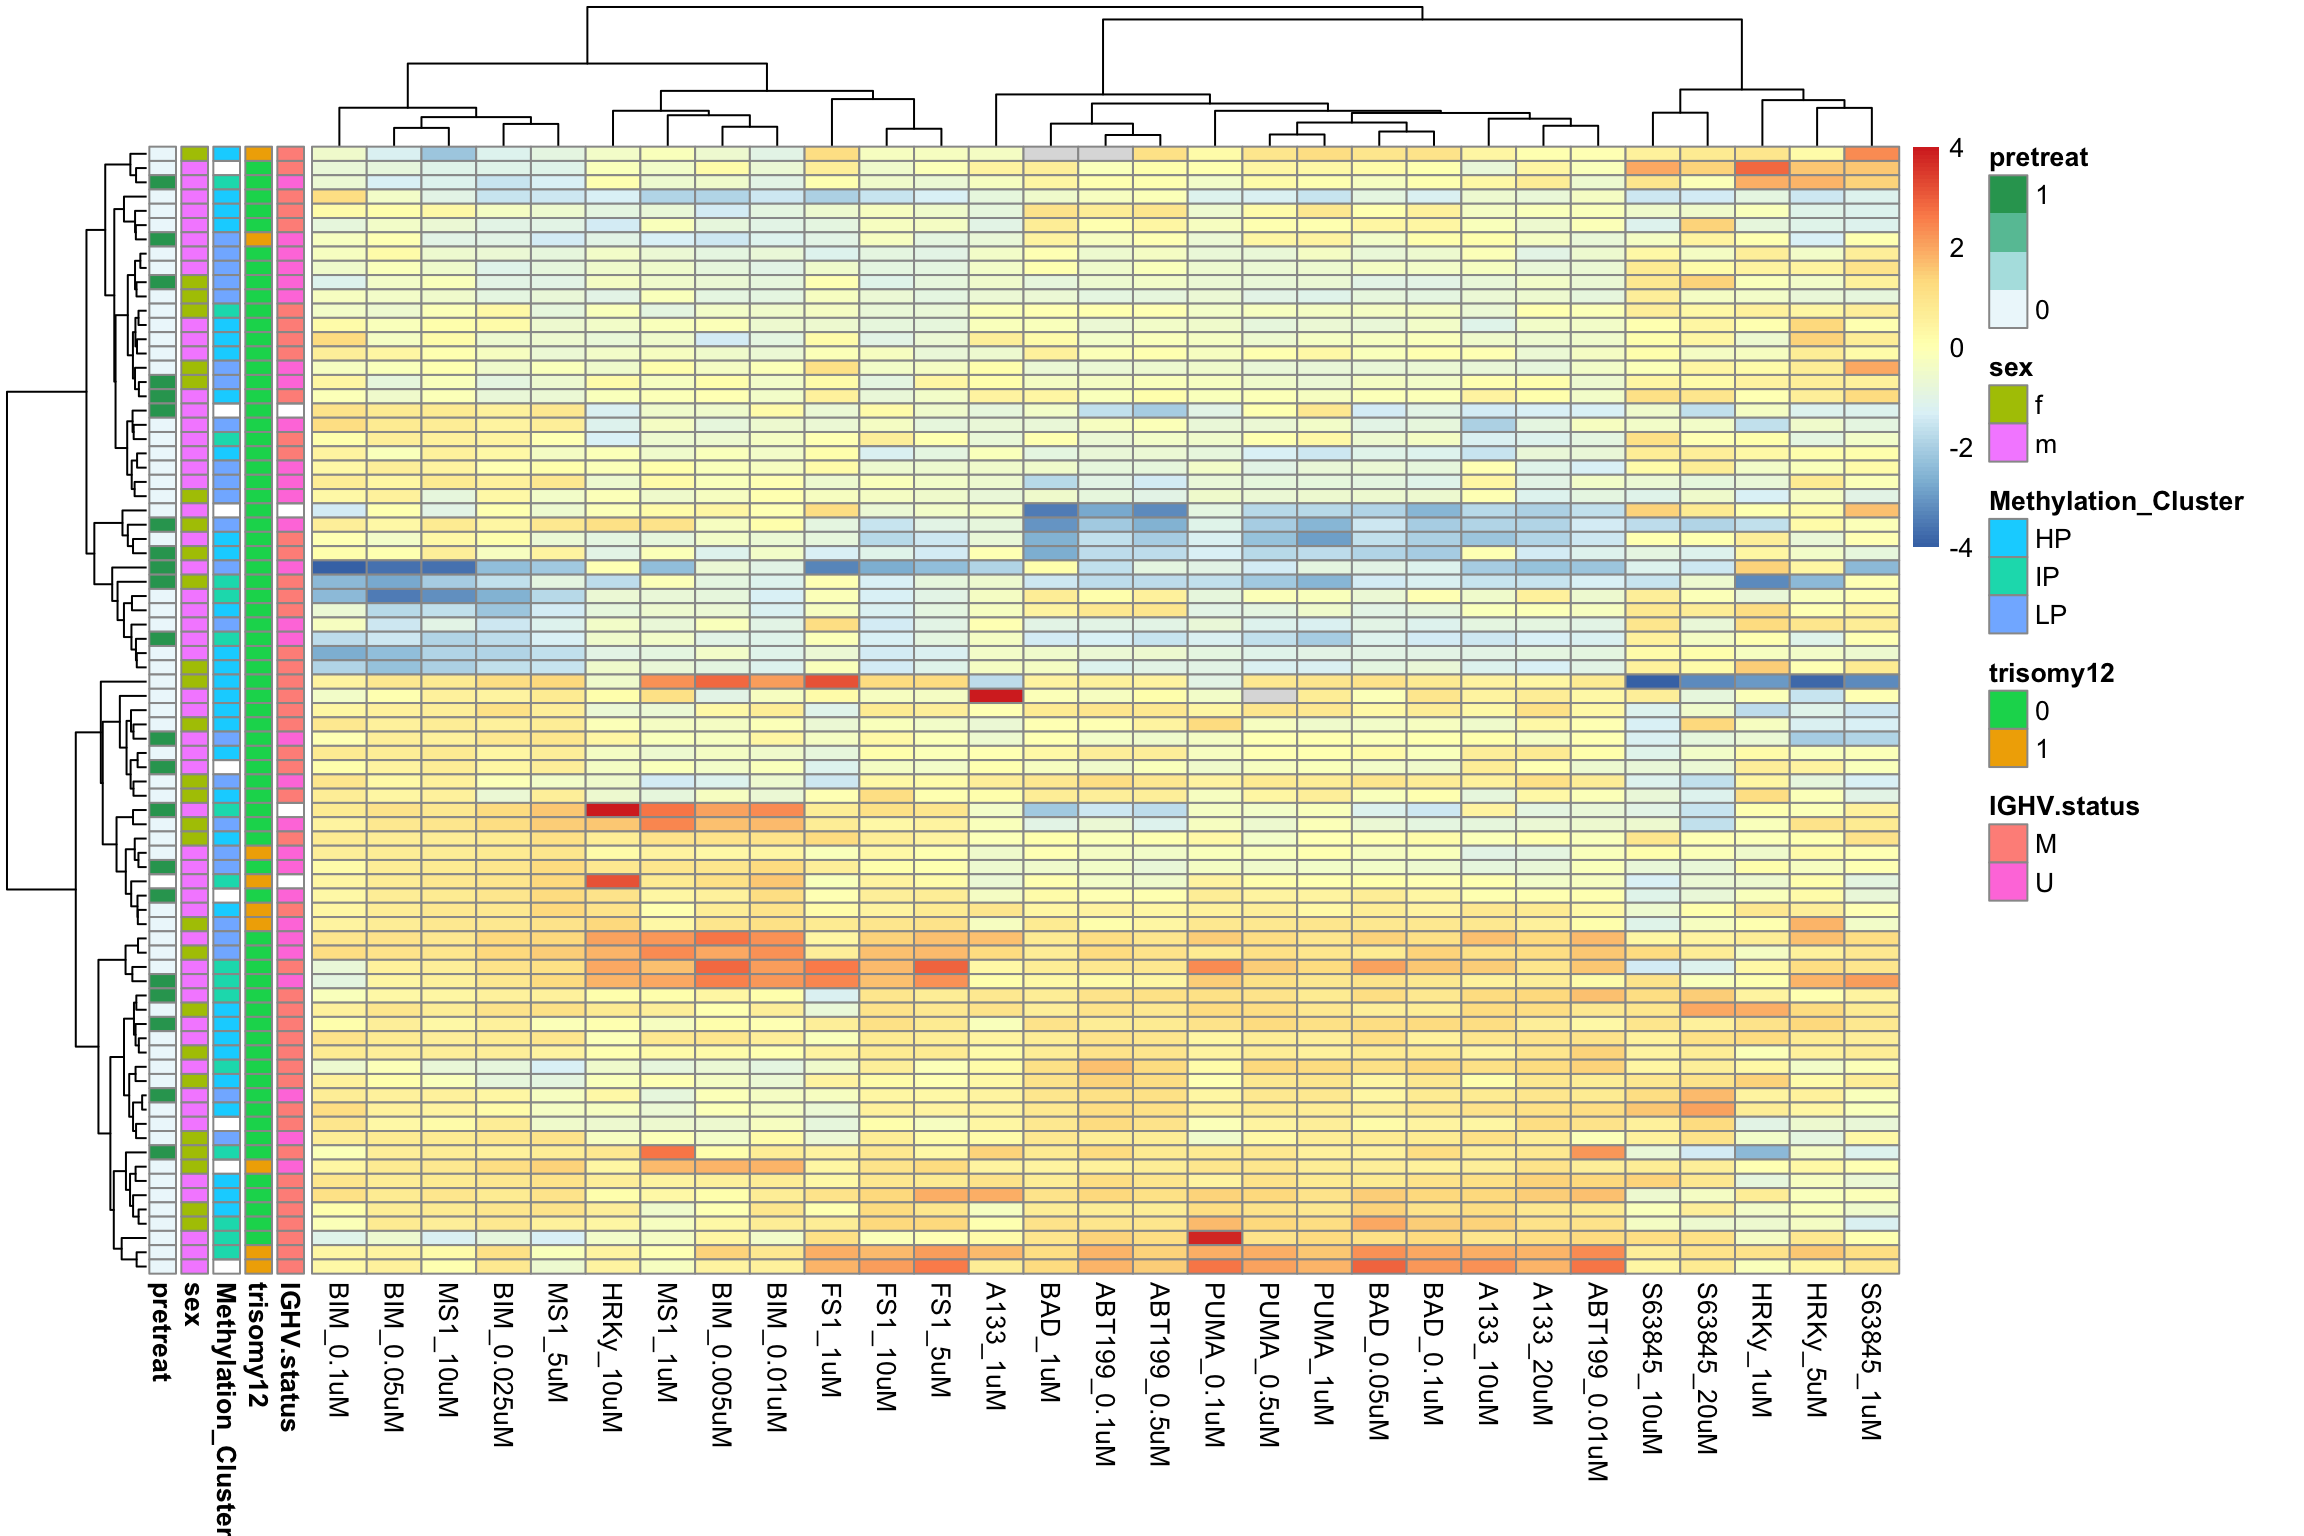
Explore data structure
Hierarchical clustering and heatmaps
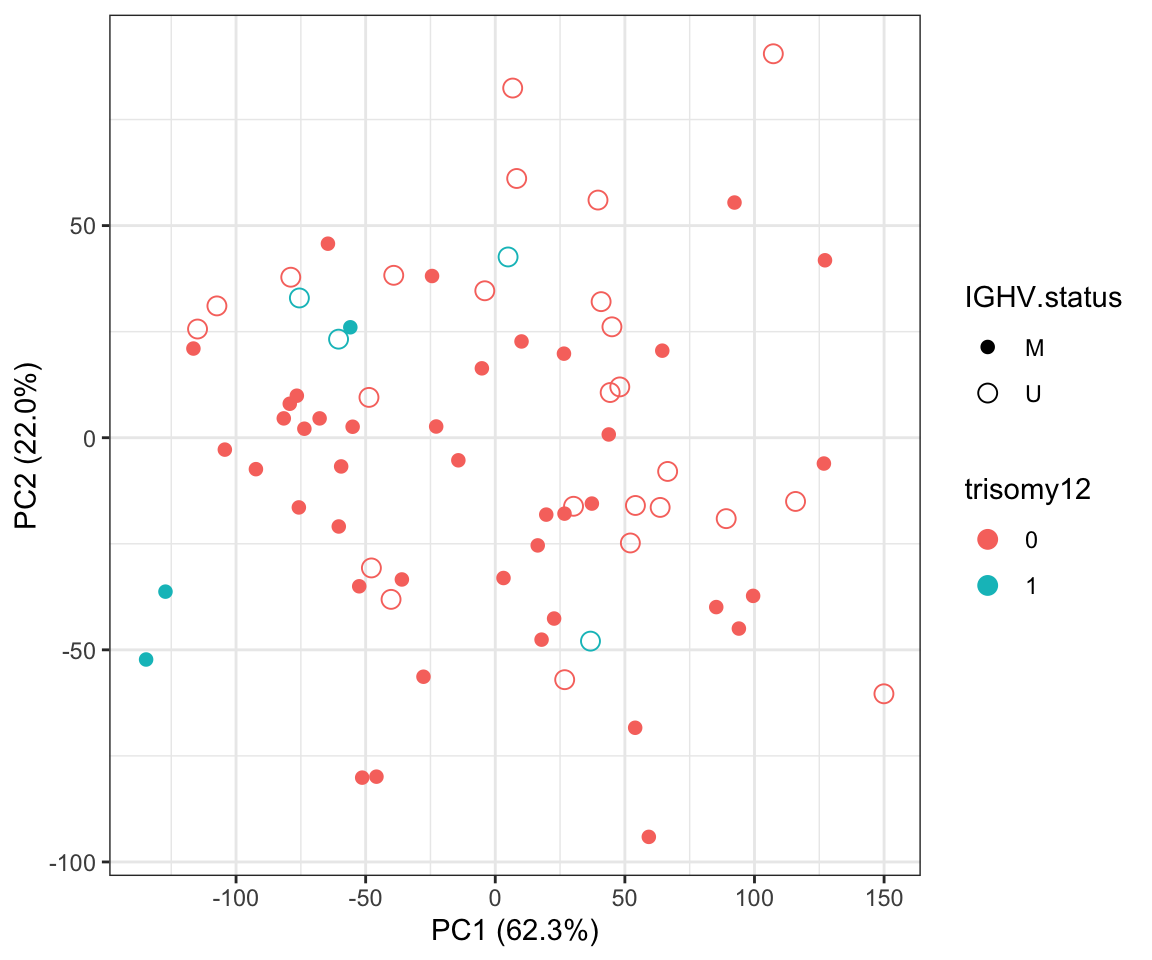
Pricipal component analysis
Associations between PCs and patient background
Associations with P-value < 0.05
# A tibble: 3 x 3
# Groups:   PC, feature [3]
  PC    feature               p.value
  <chr> <chr>                   <dbl>
1 PC3   Methylation_Cluster 0.0000338
2 PC2   IGHV.status         0.00941
3 PC1   trisomy12           0.0187
Plot associations 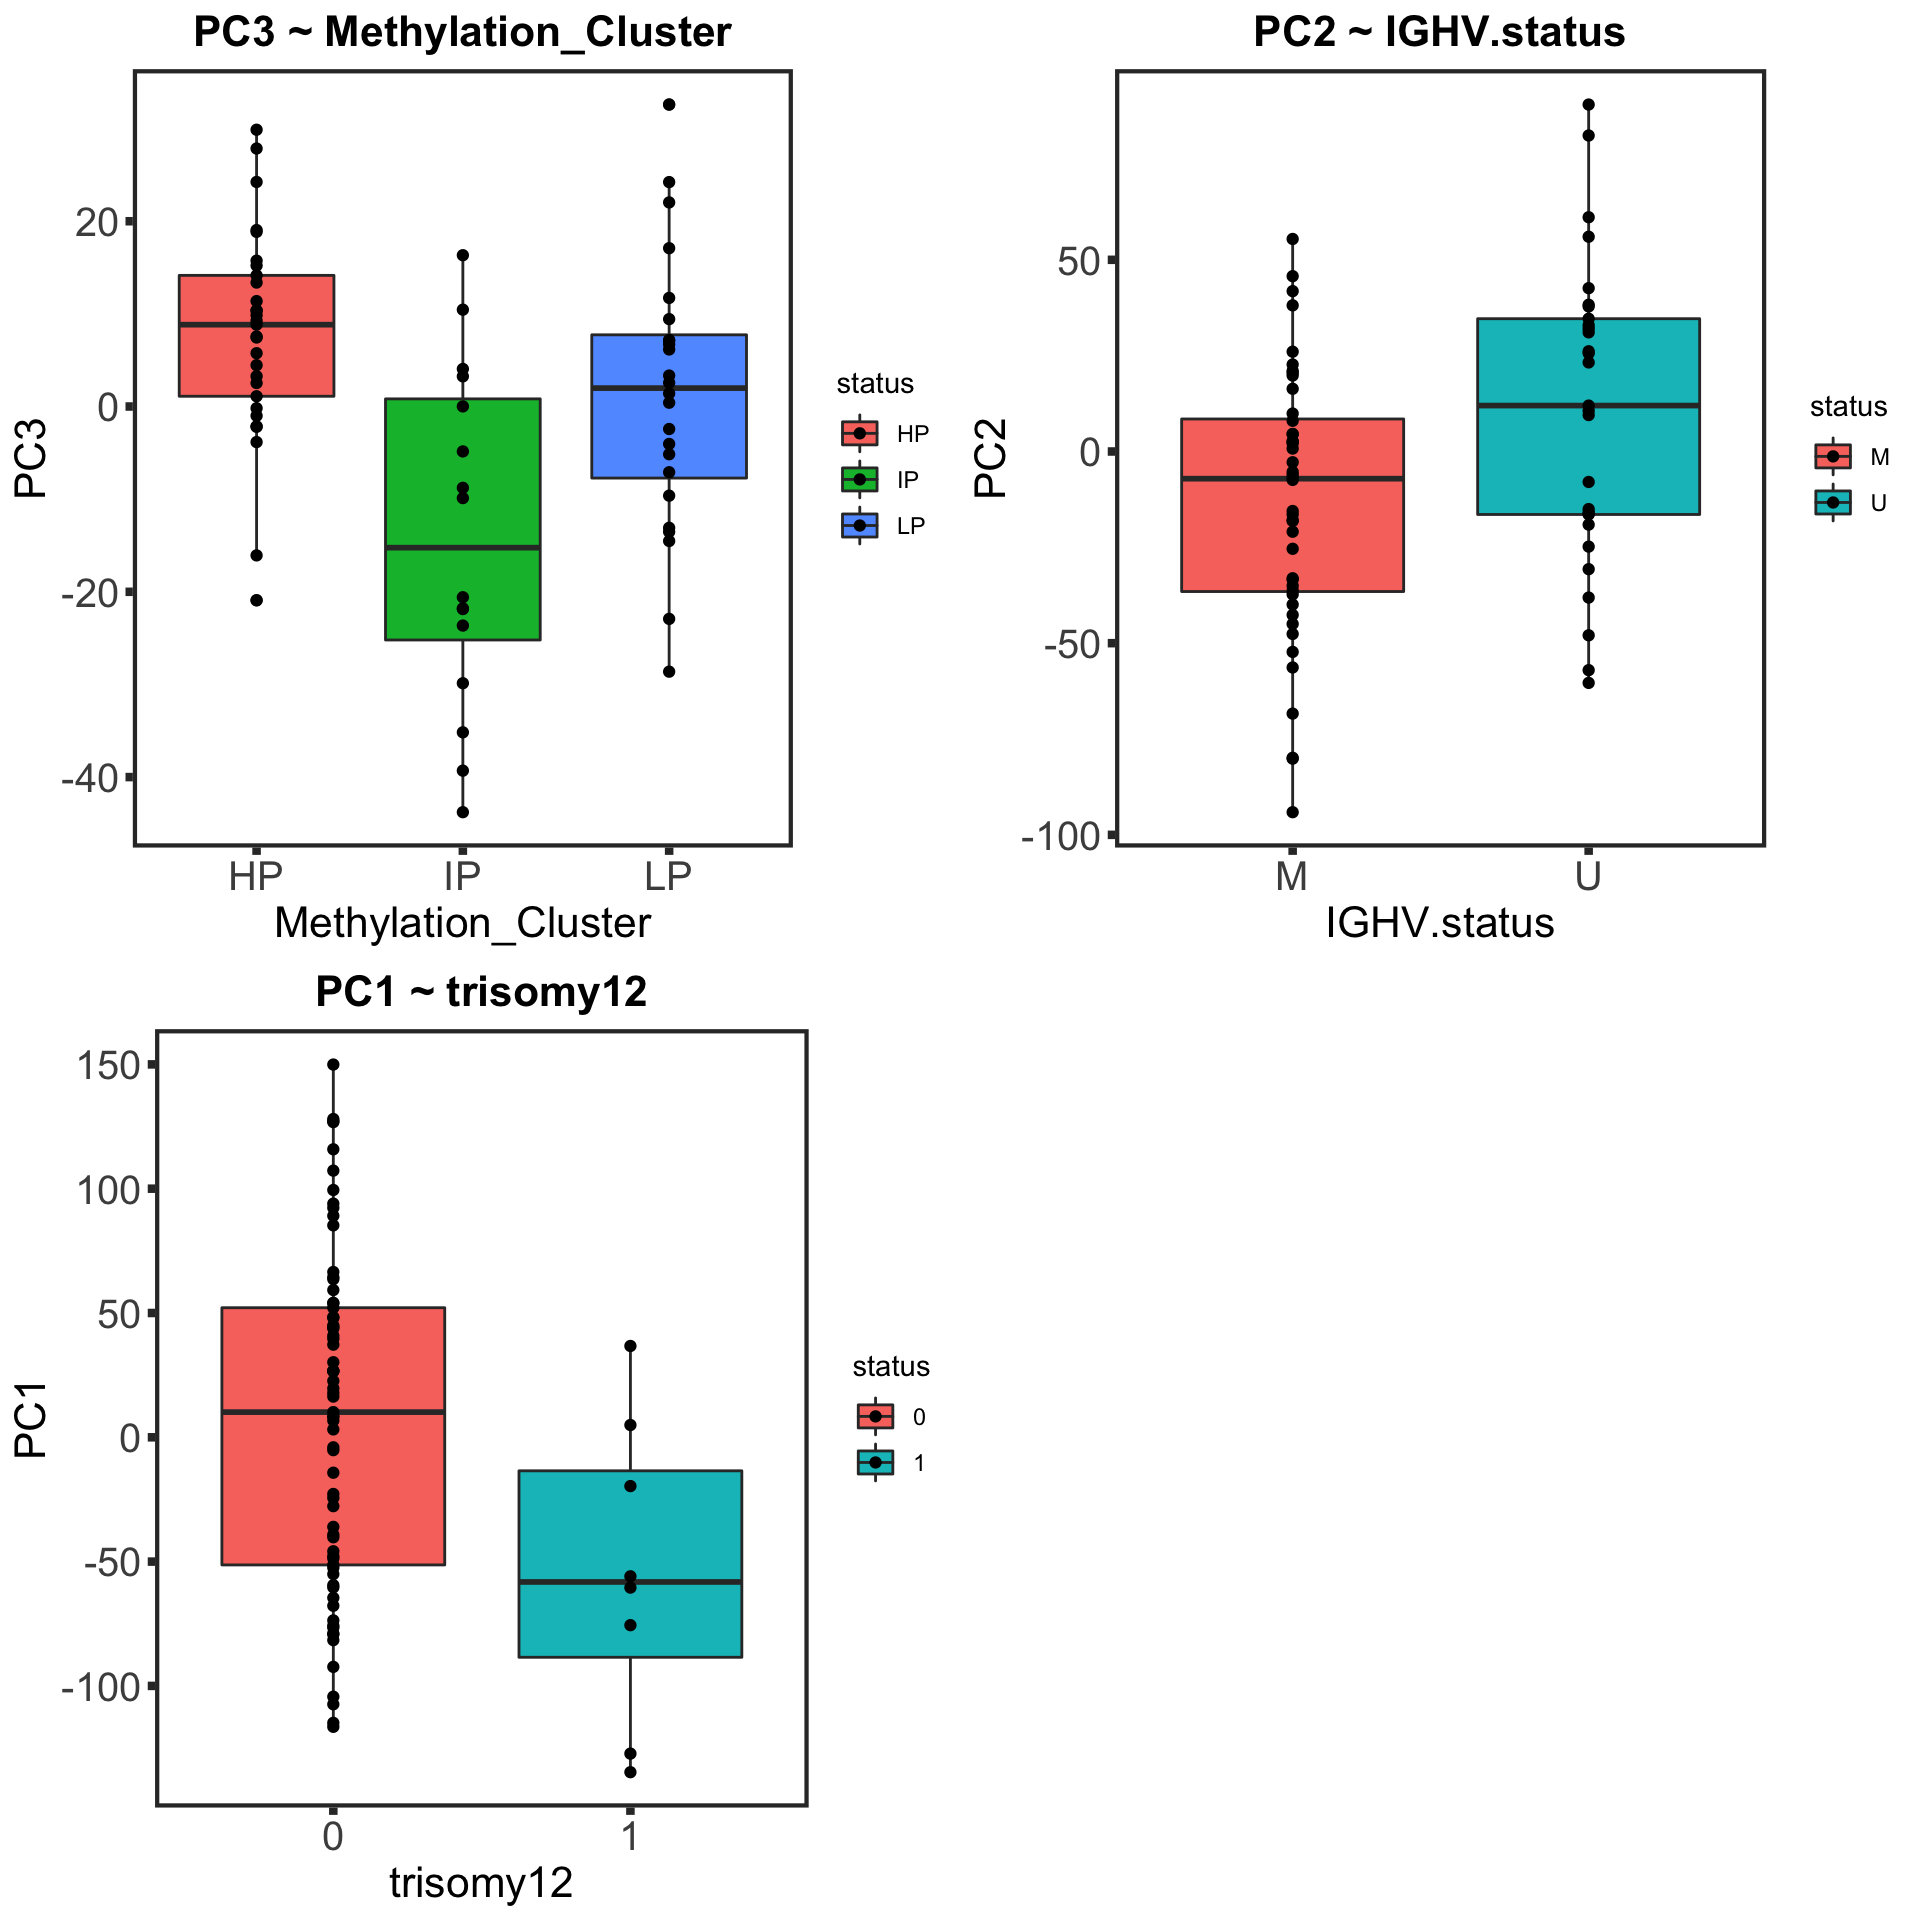
Plot feature loadings on the first three PCs 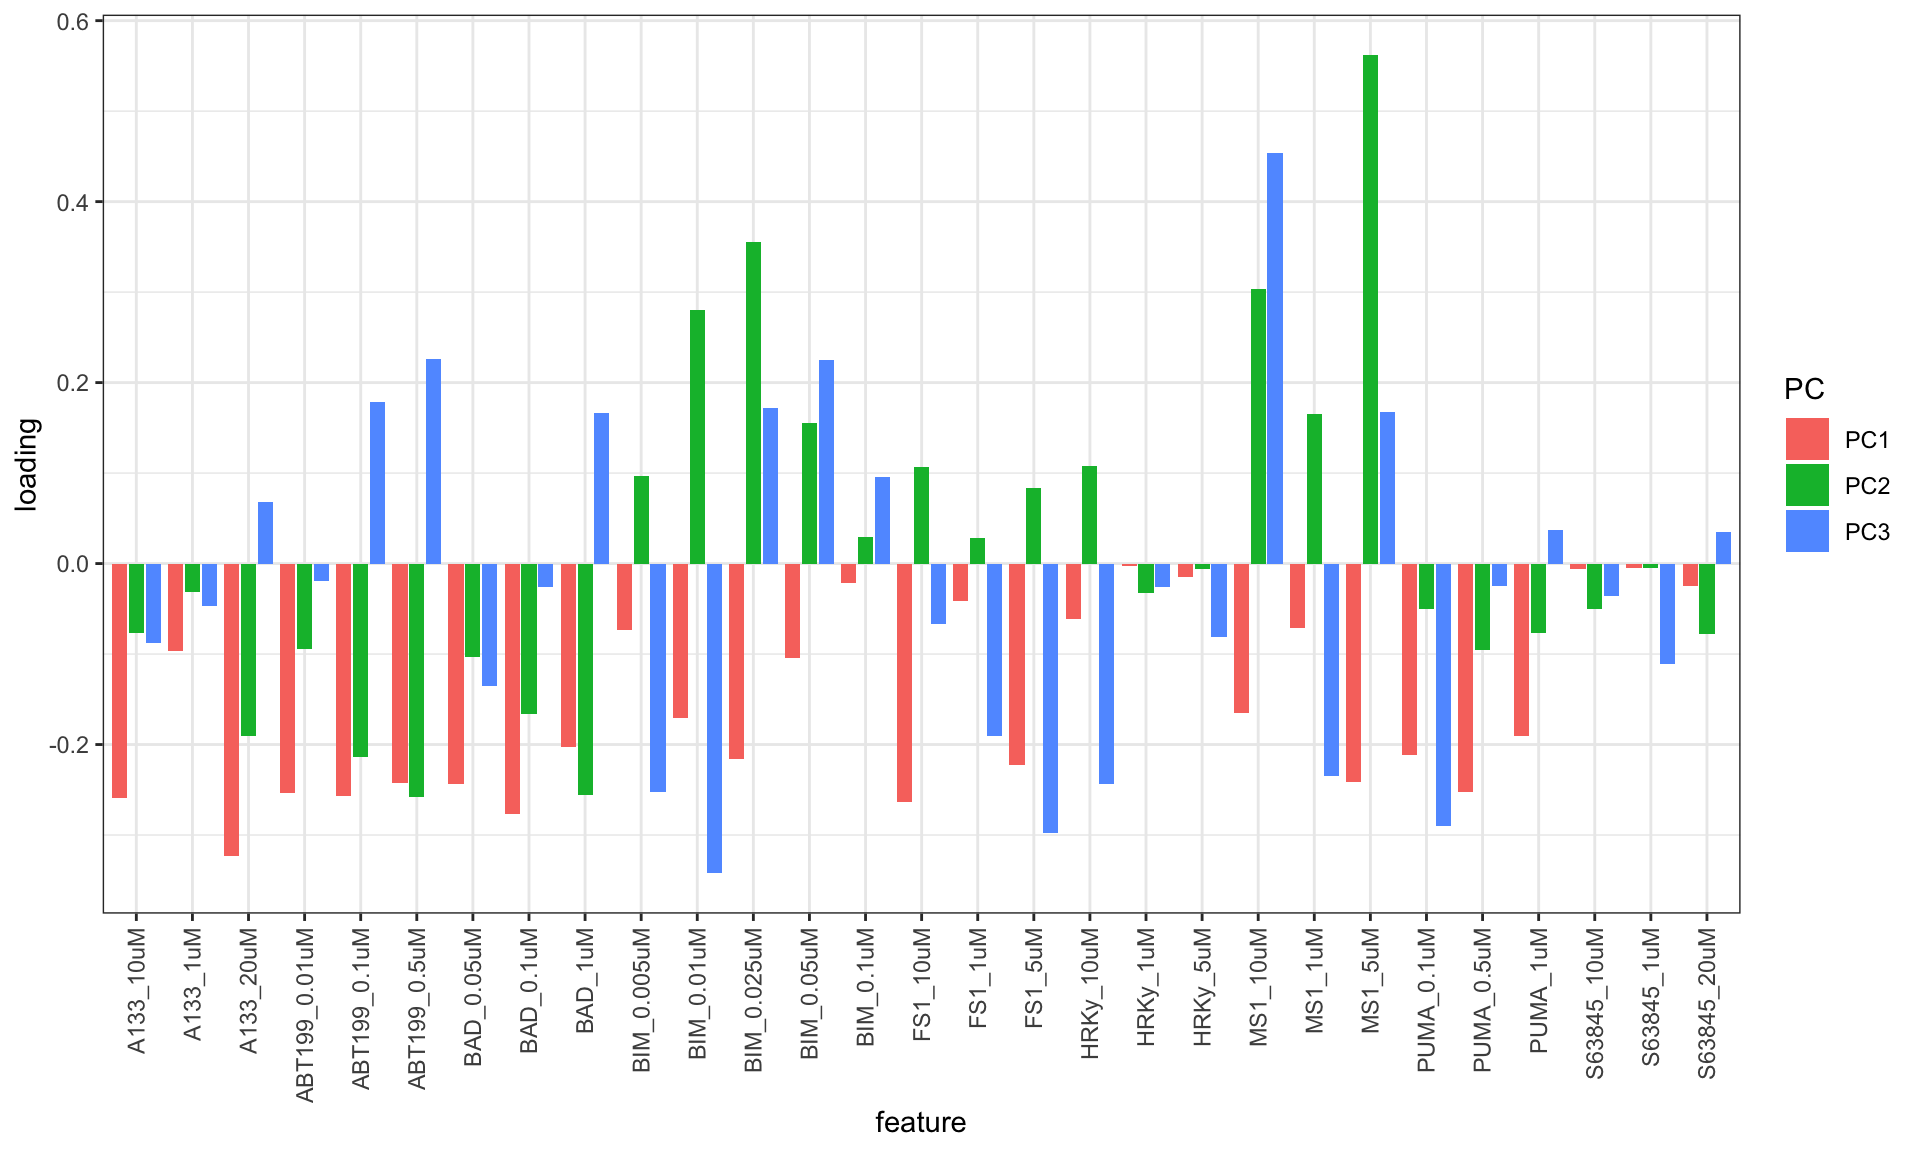
Association test with patient genomic background
Table of associations
P value histogram
All 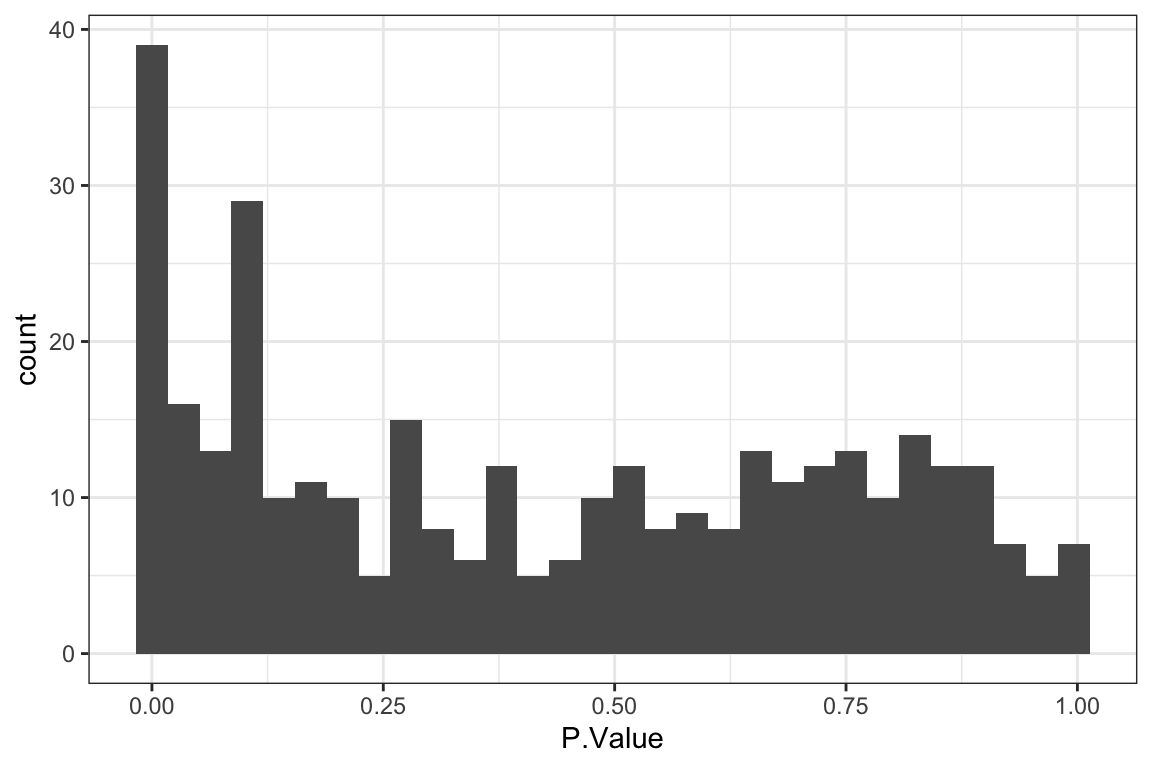
Per-gene 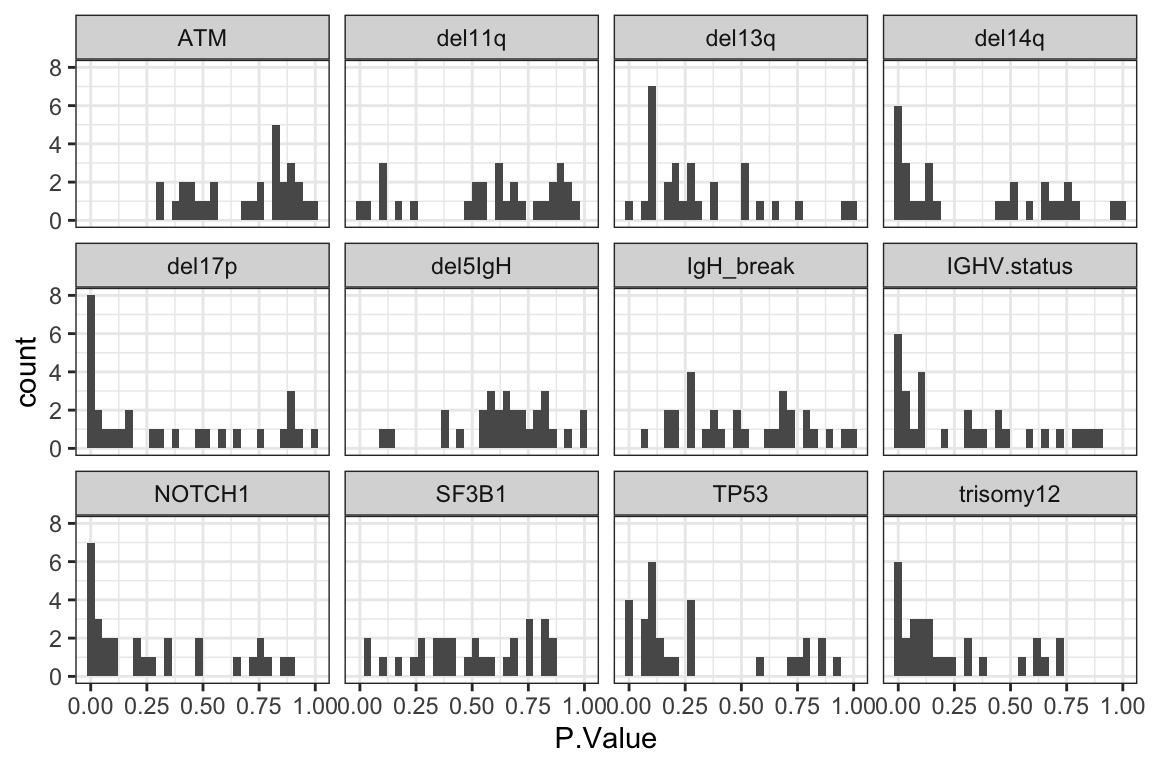
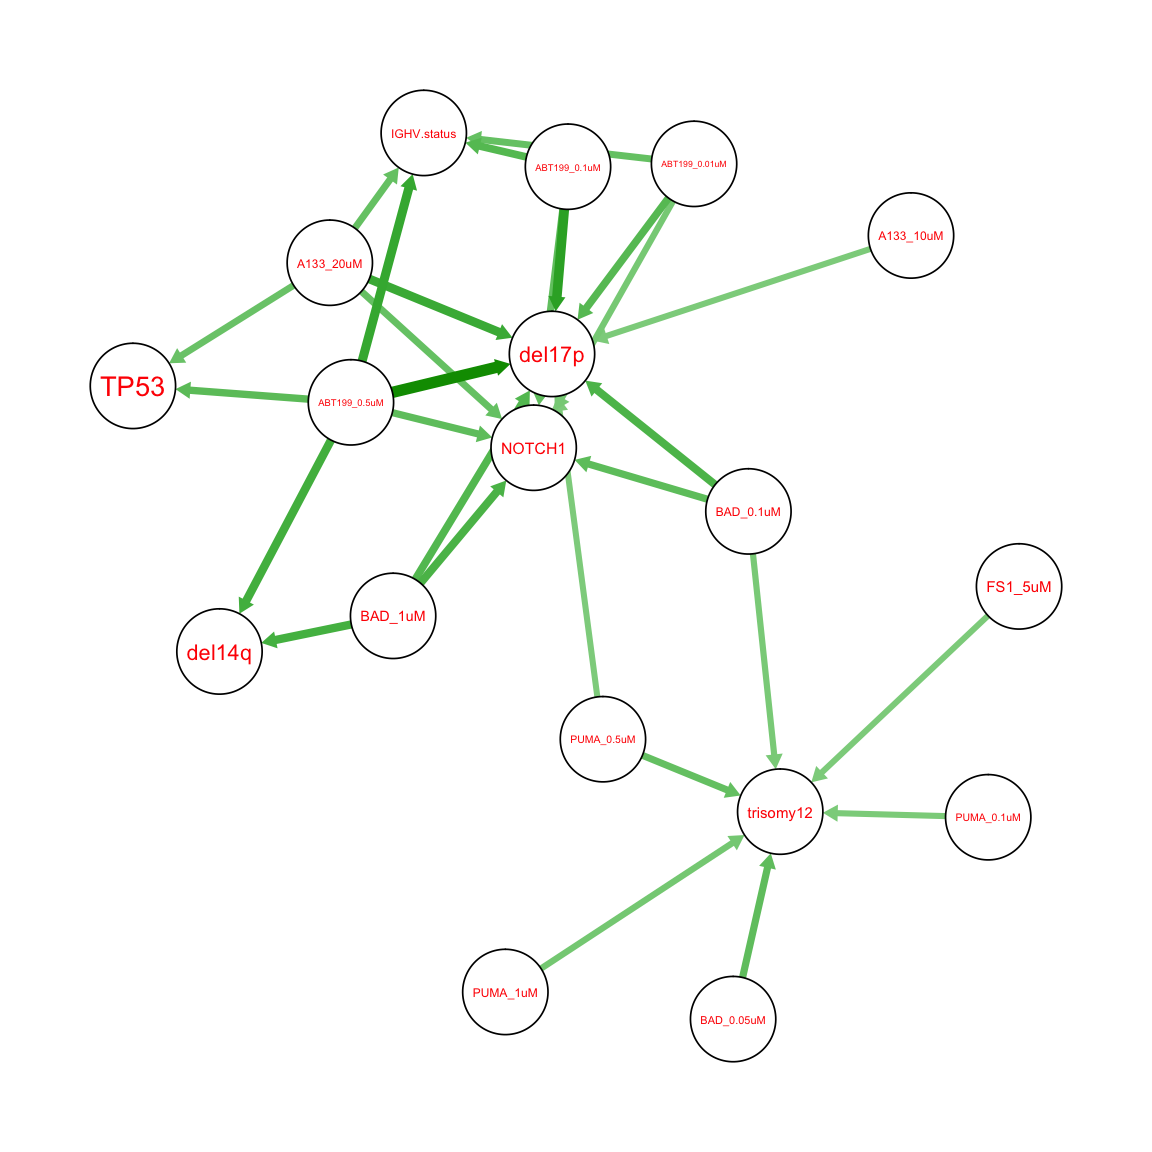
Association network (10% FDR)
Summarise plot for all concentrations
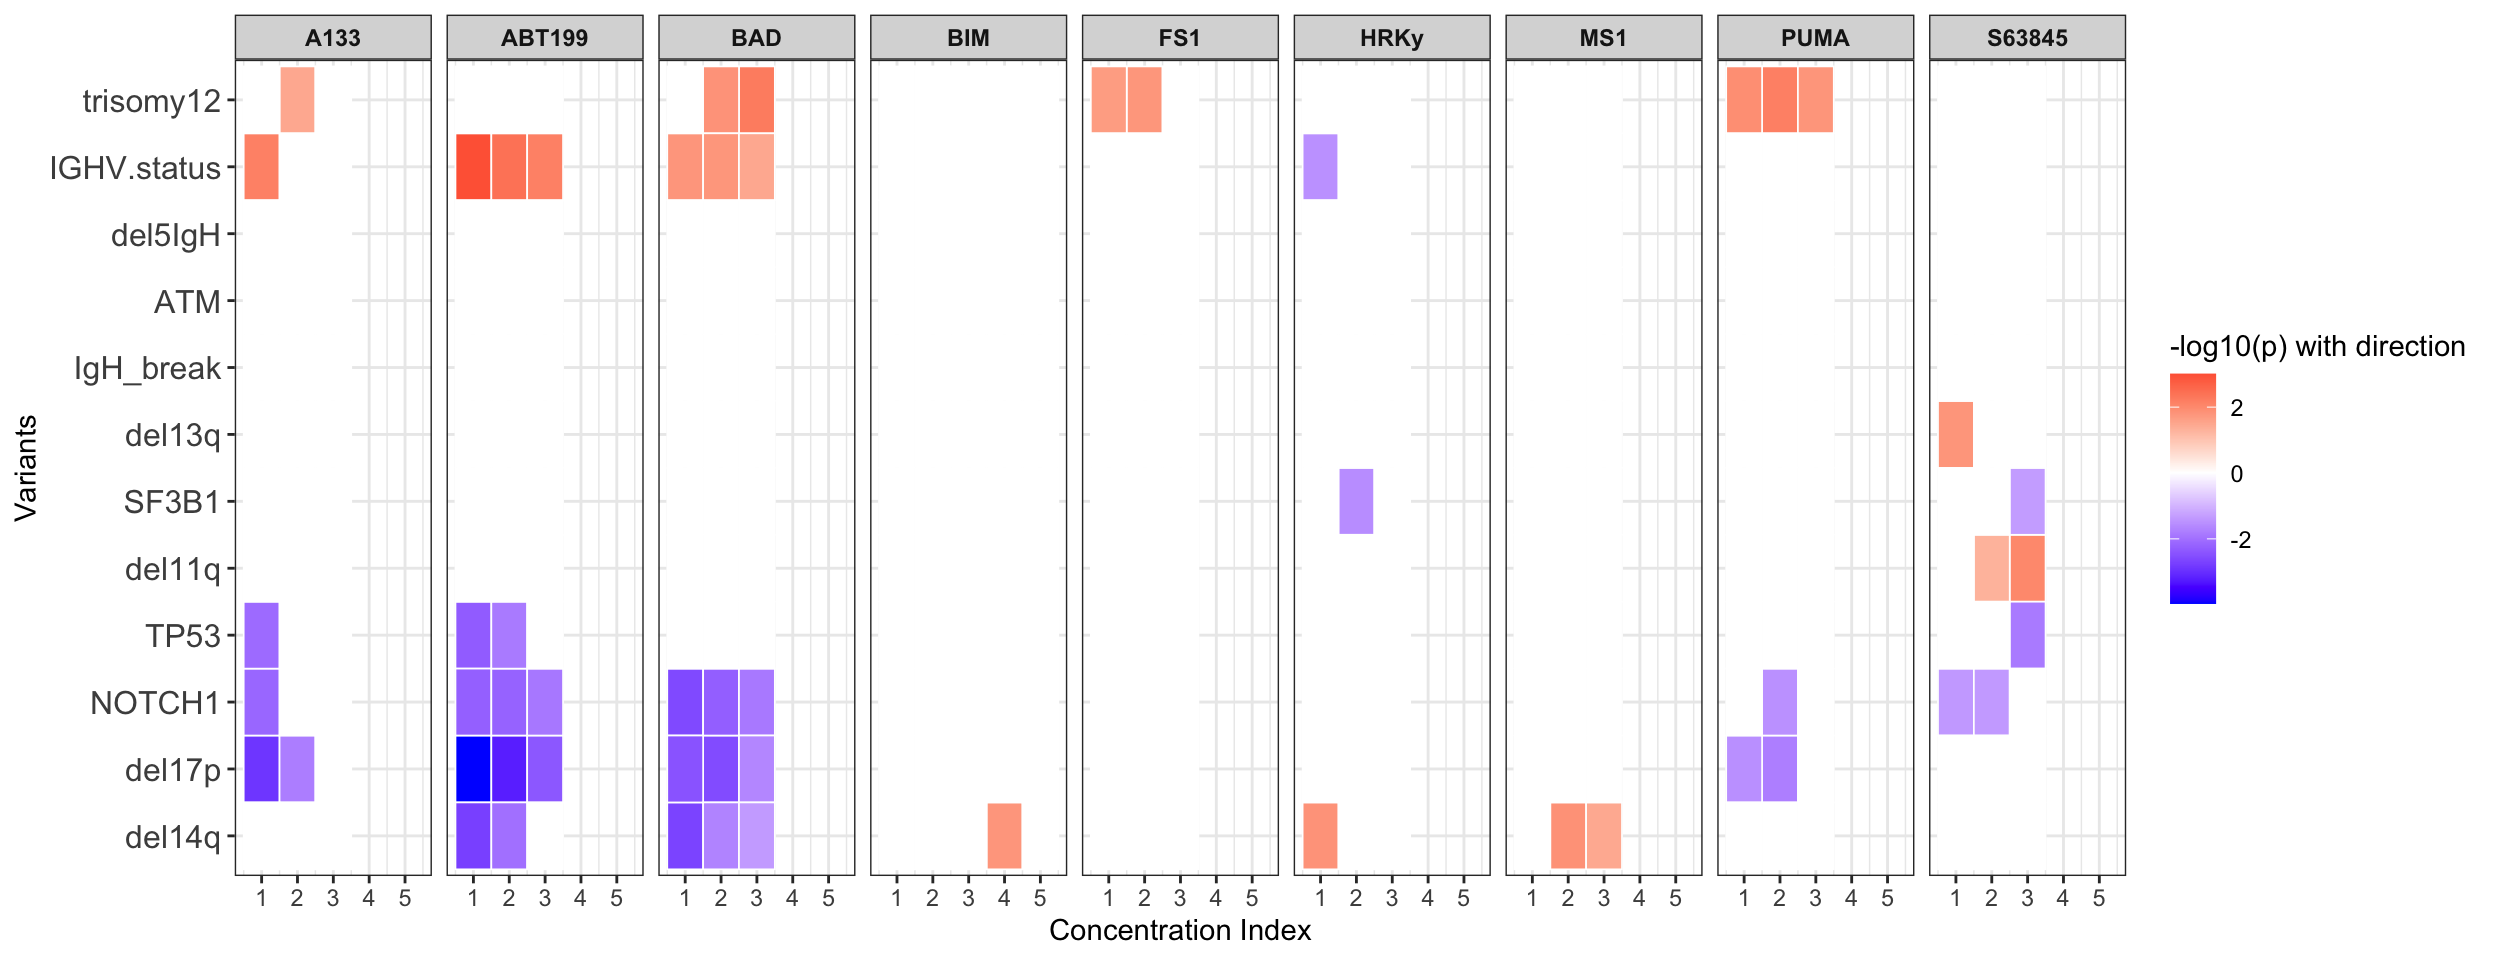 1 is the highest concentration and 5 is the lowest concentration. Only the P-values < 0.05 are colored.
Box plots for the significant associations (P < 0.01)
If multiple concentrations are identified as significant, only show the most significant concentration. 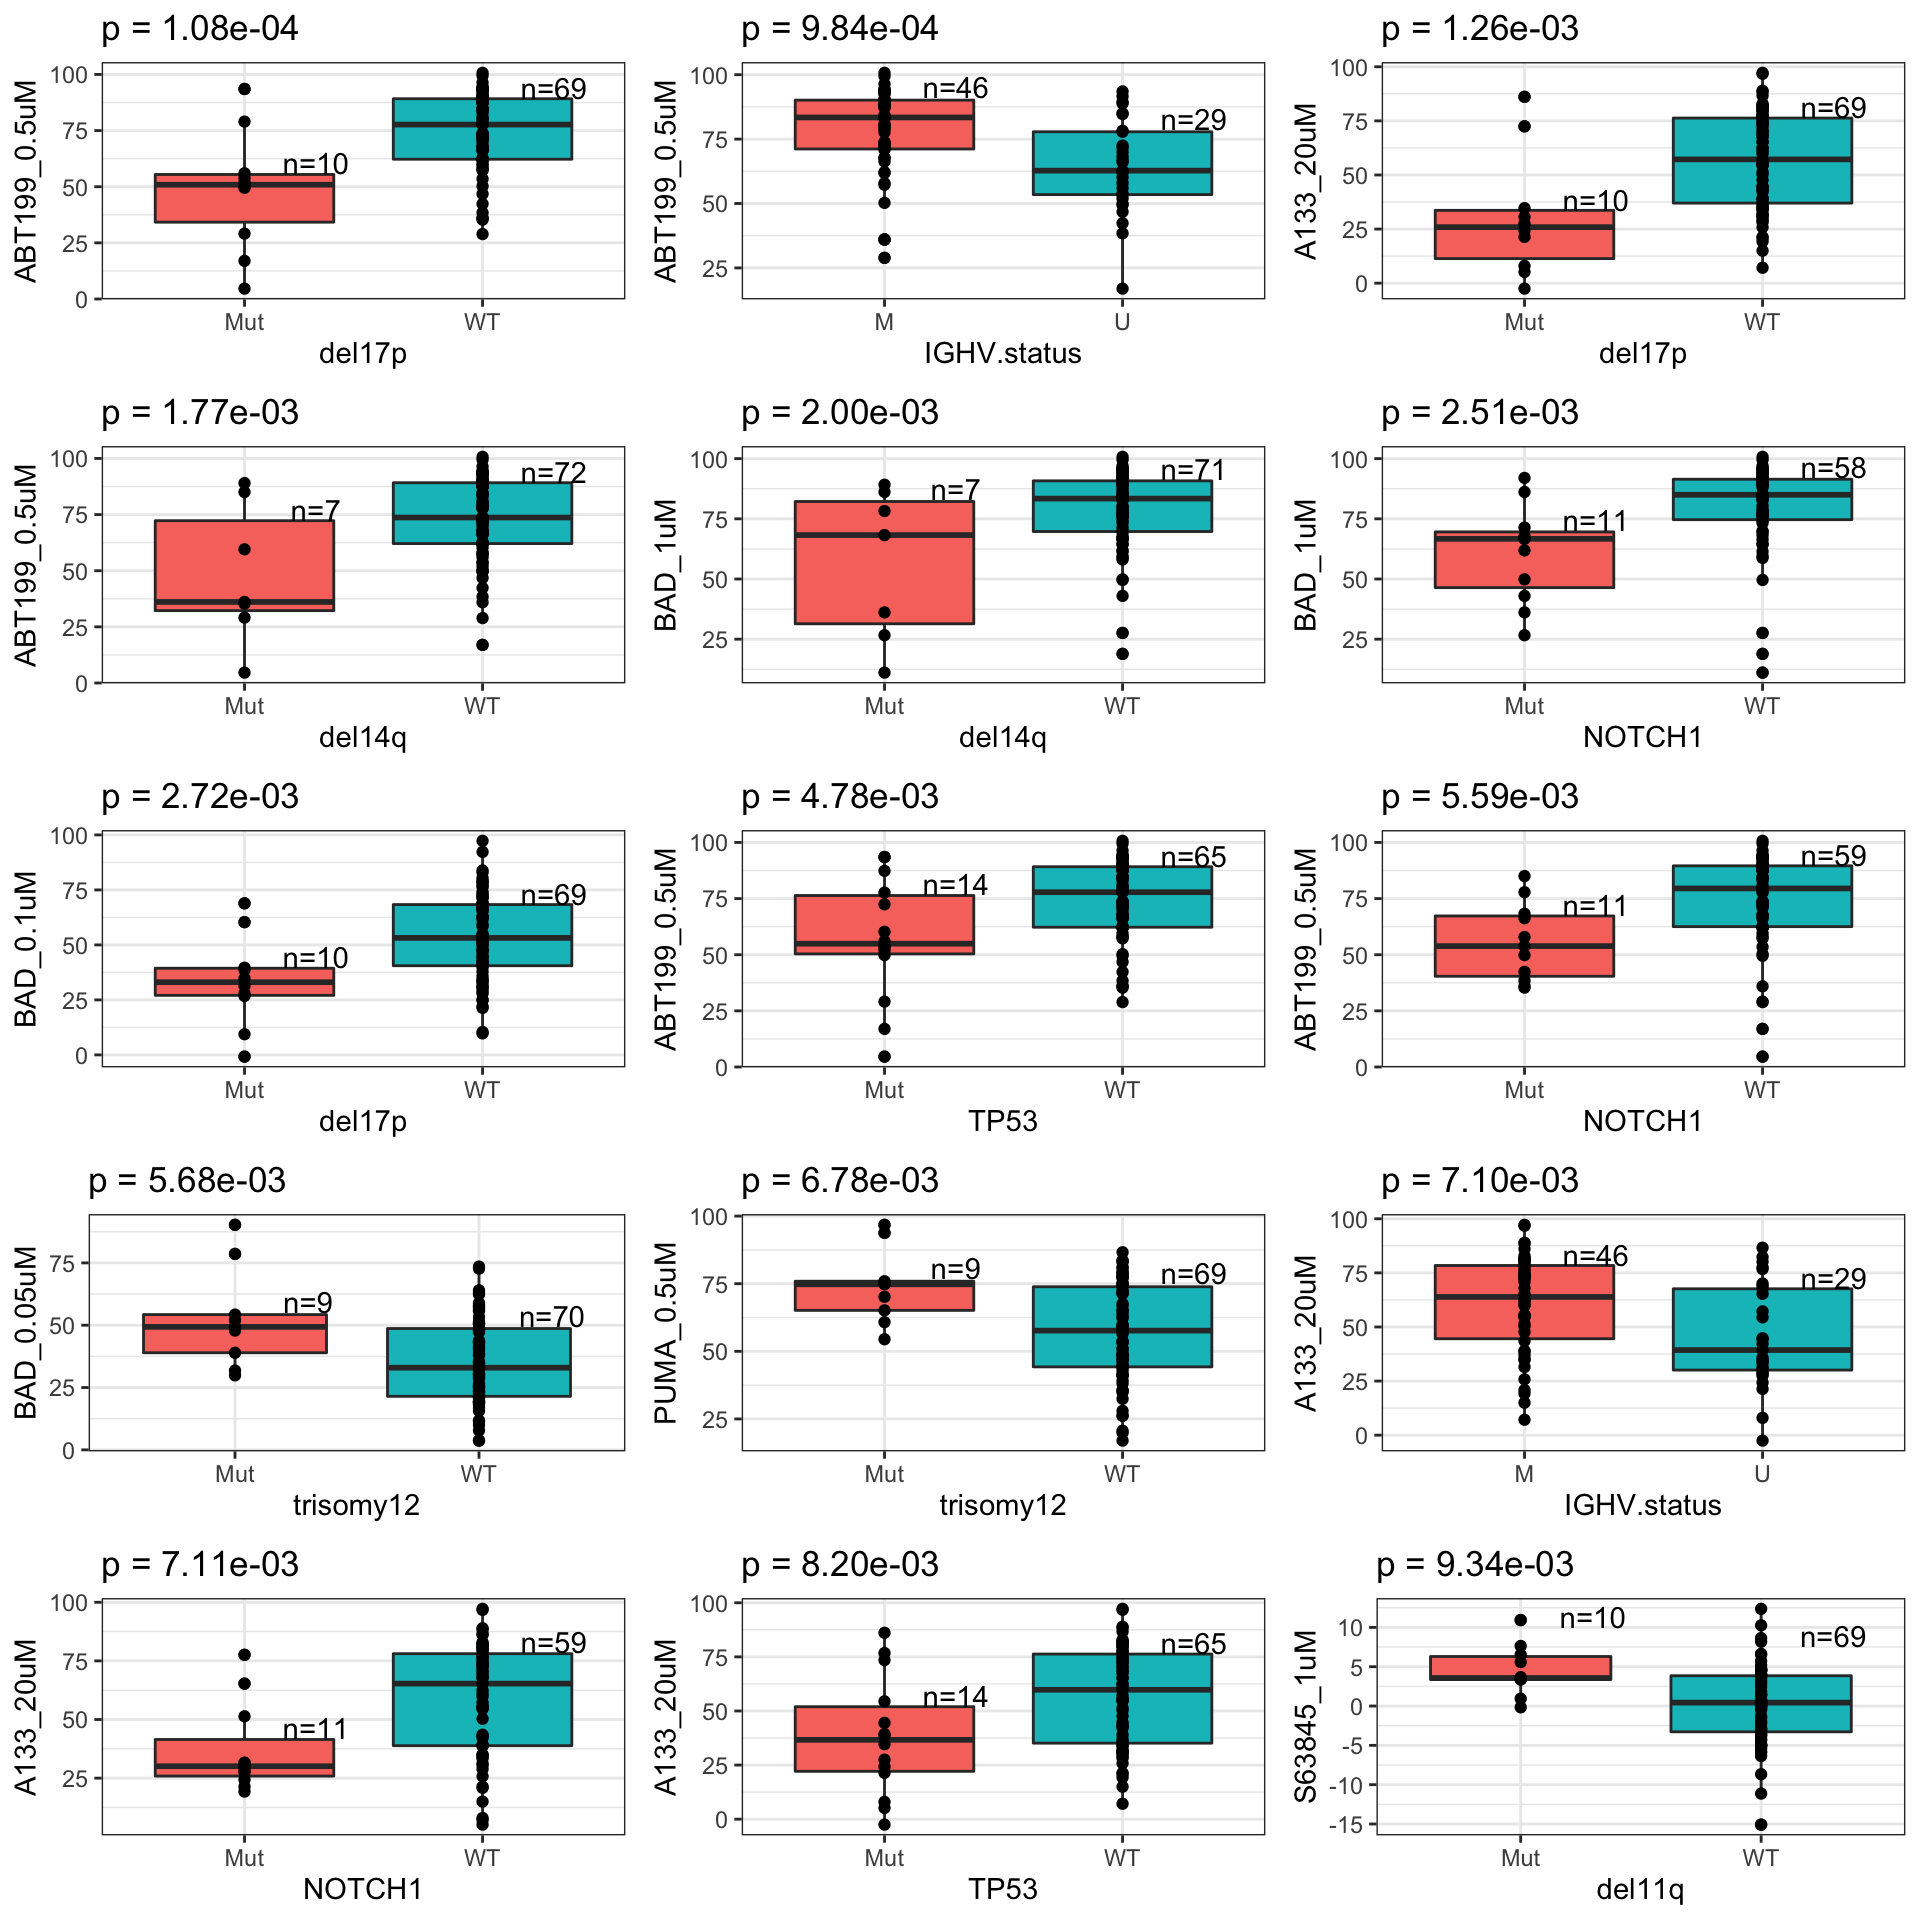
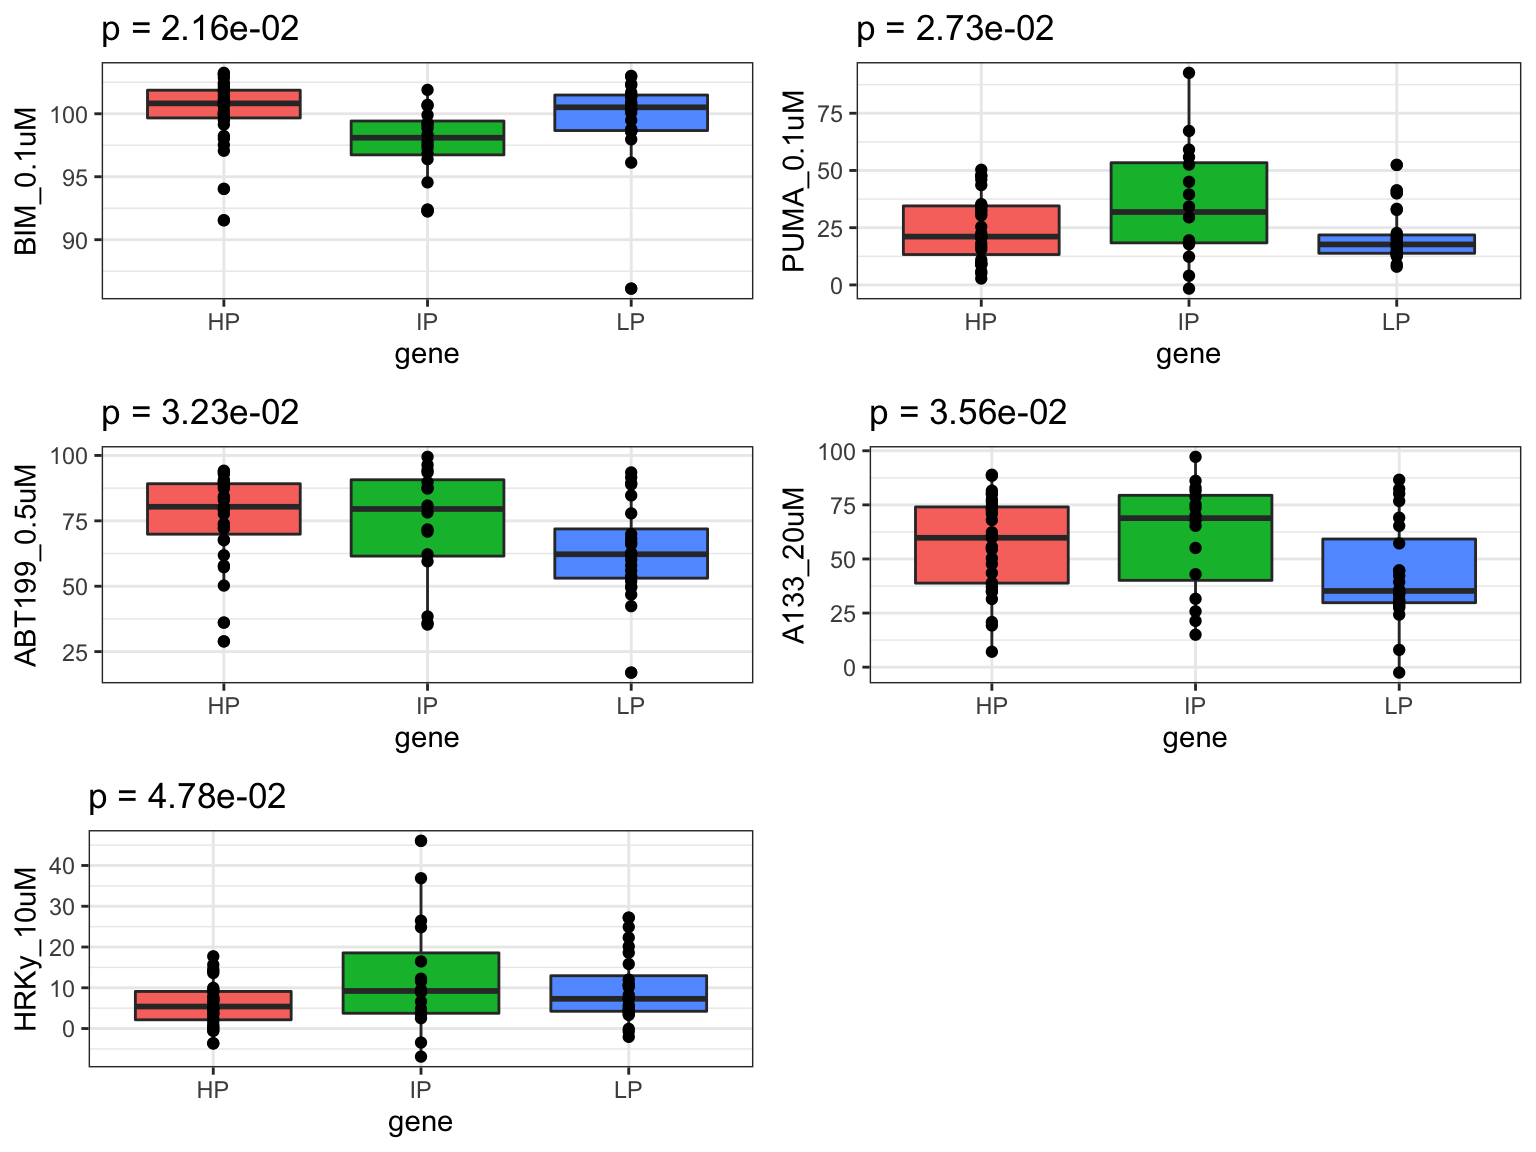
Associations with methylation cluster
Plot associations with p value < 0.05
Association with transcriptomics
Preprocessing
RNAseq
BH3 profiling
Association test for each feature
Number of significant associations per feature (10% FDR)
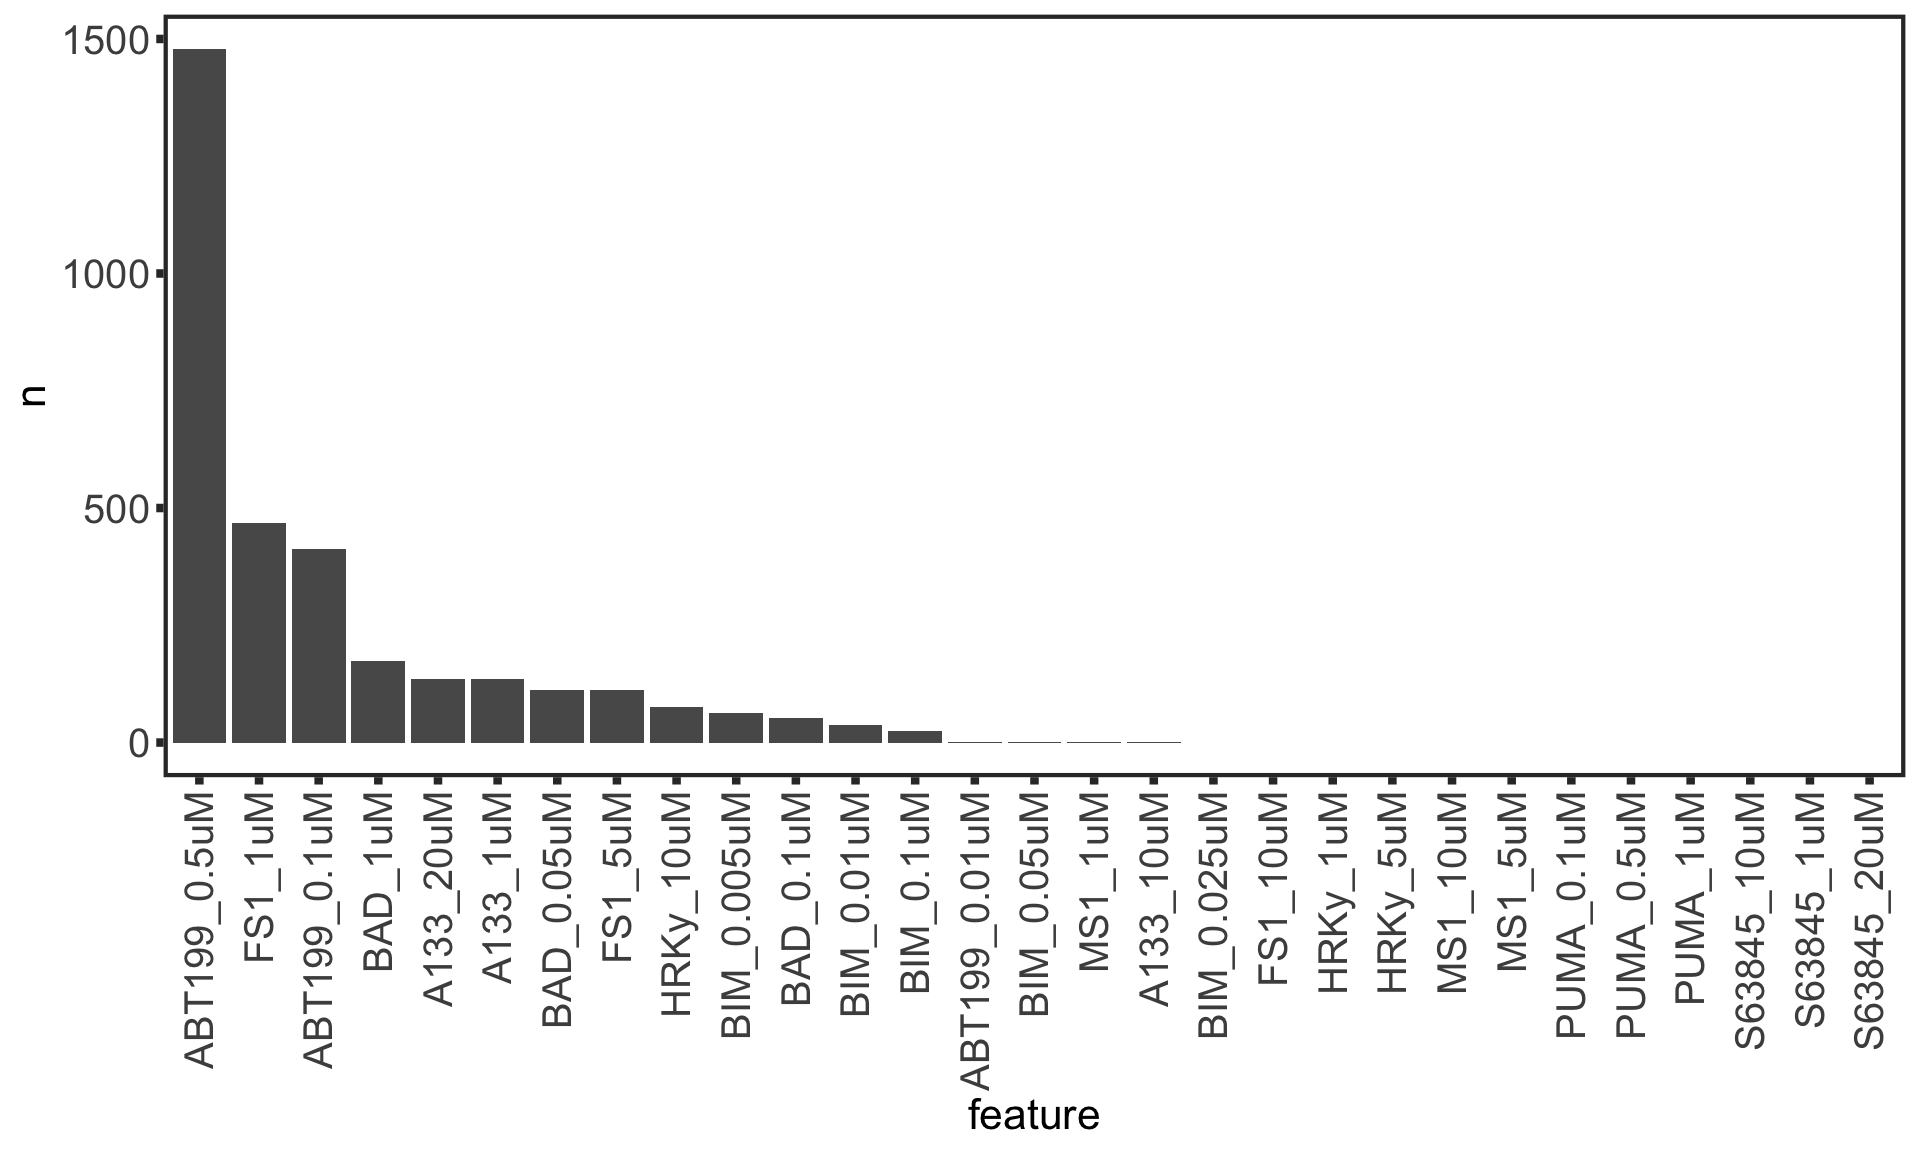
Table of significant associations
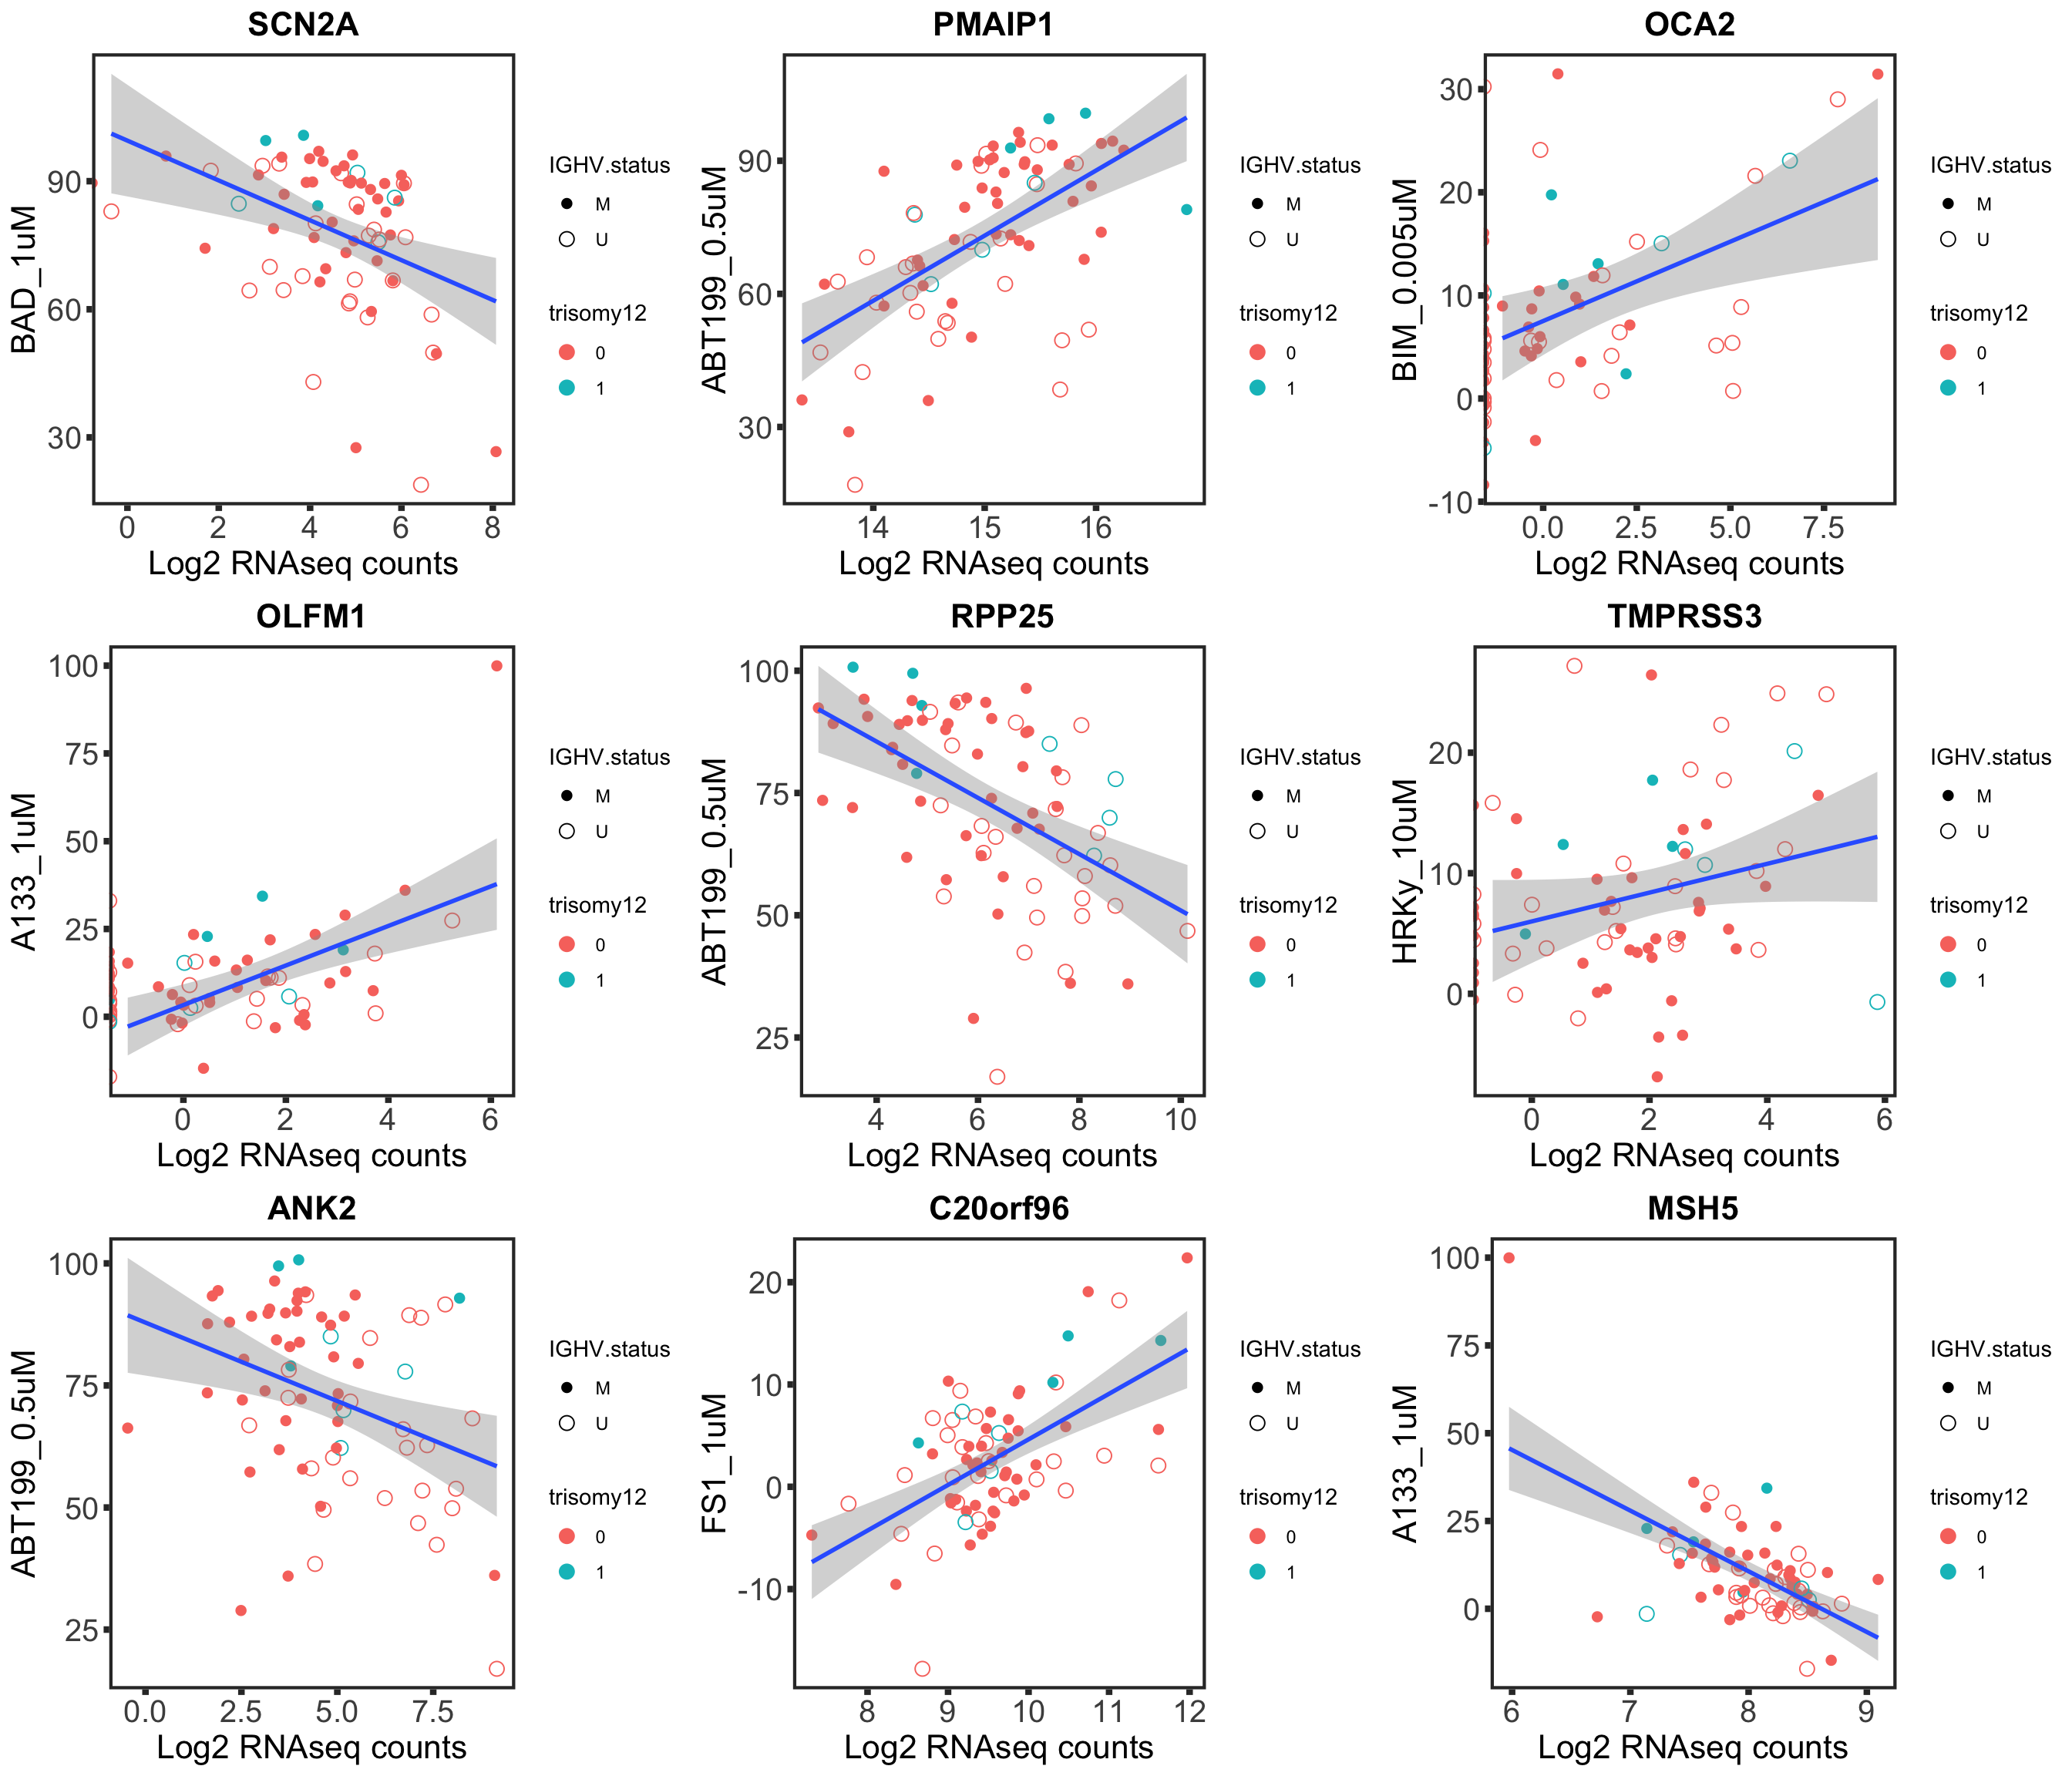
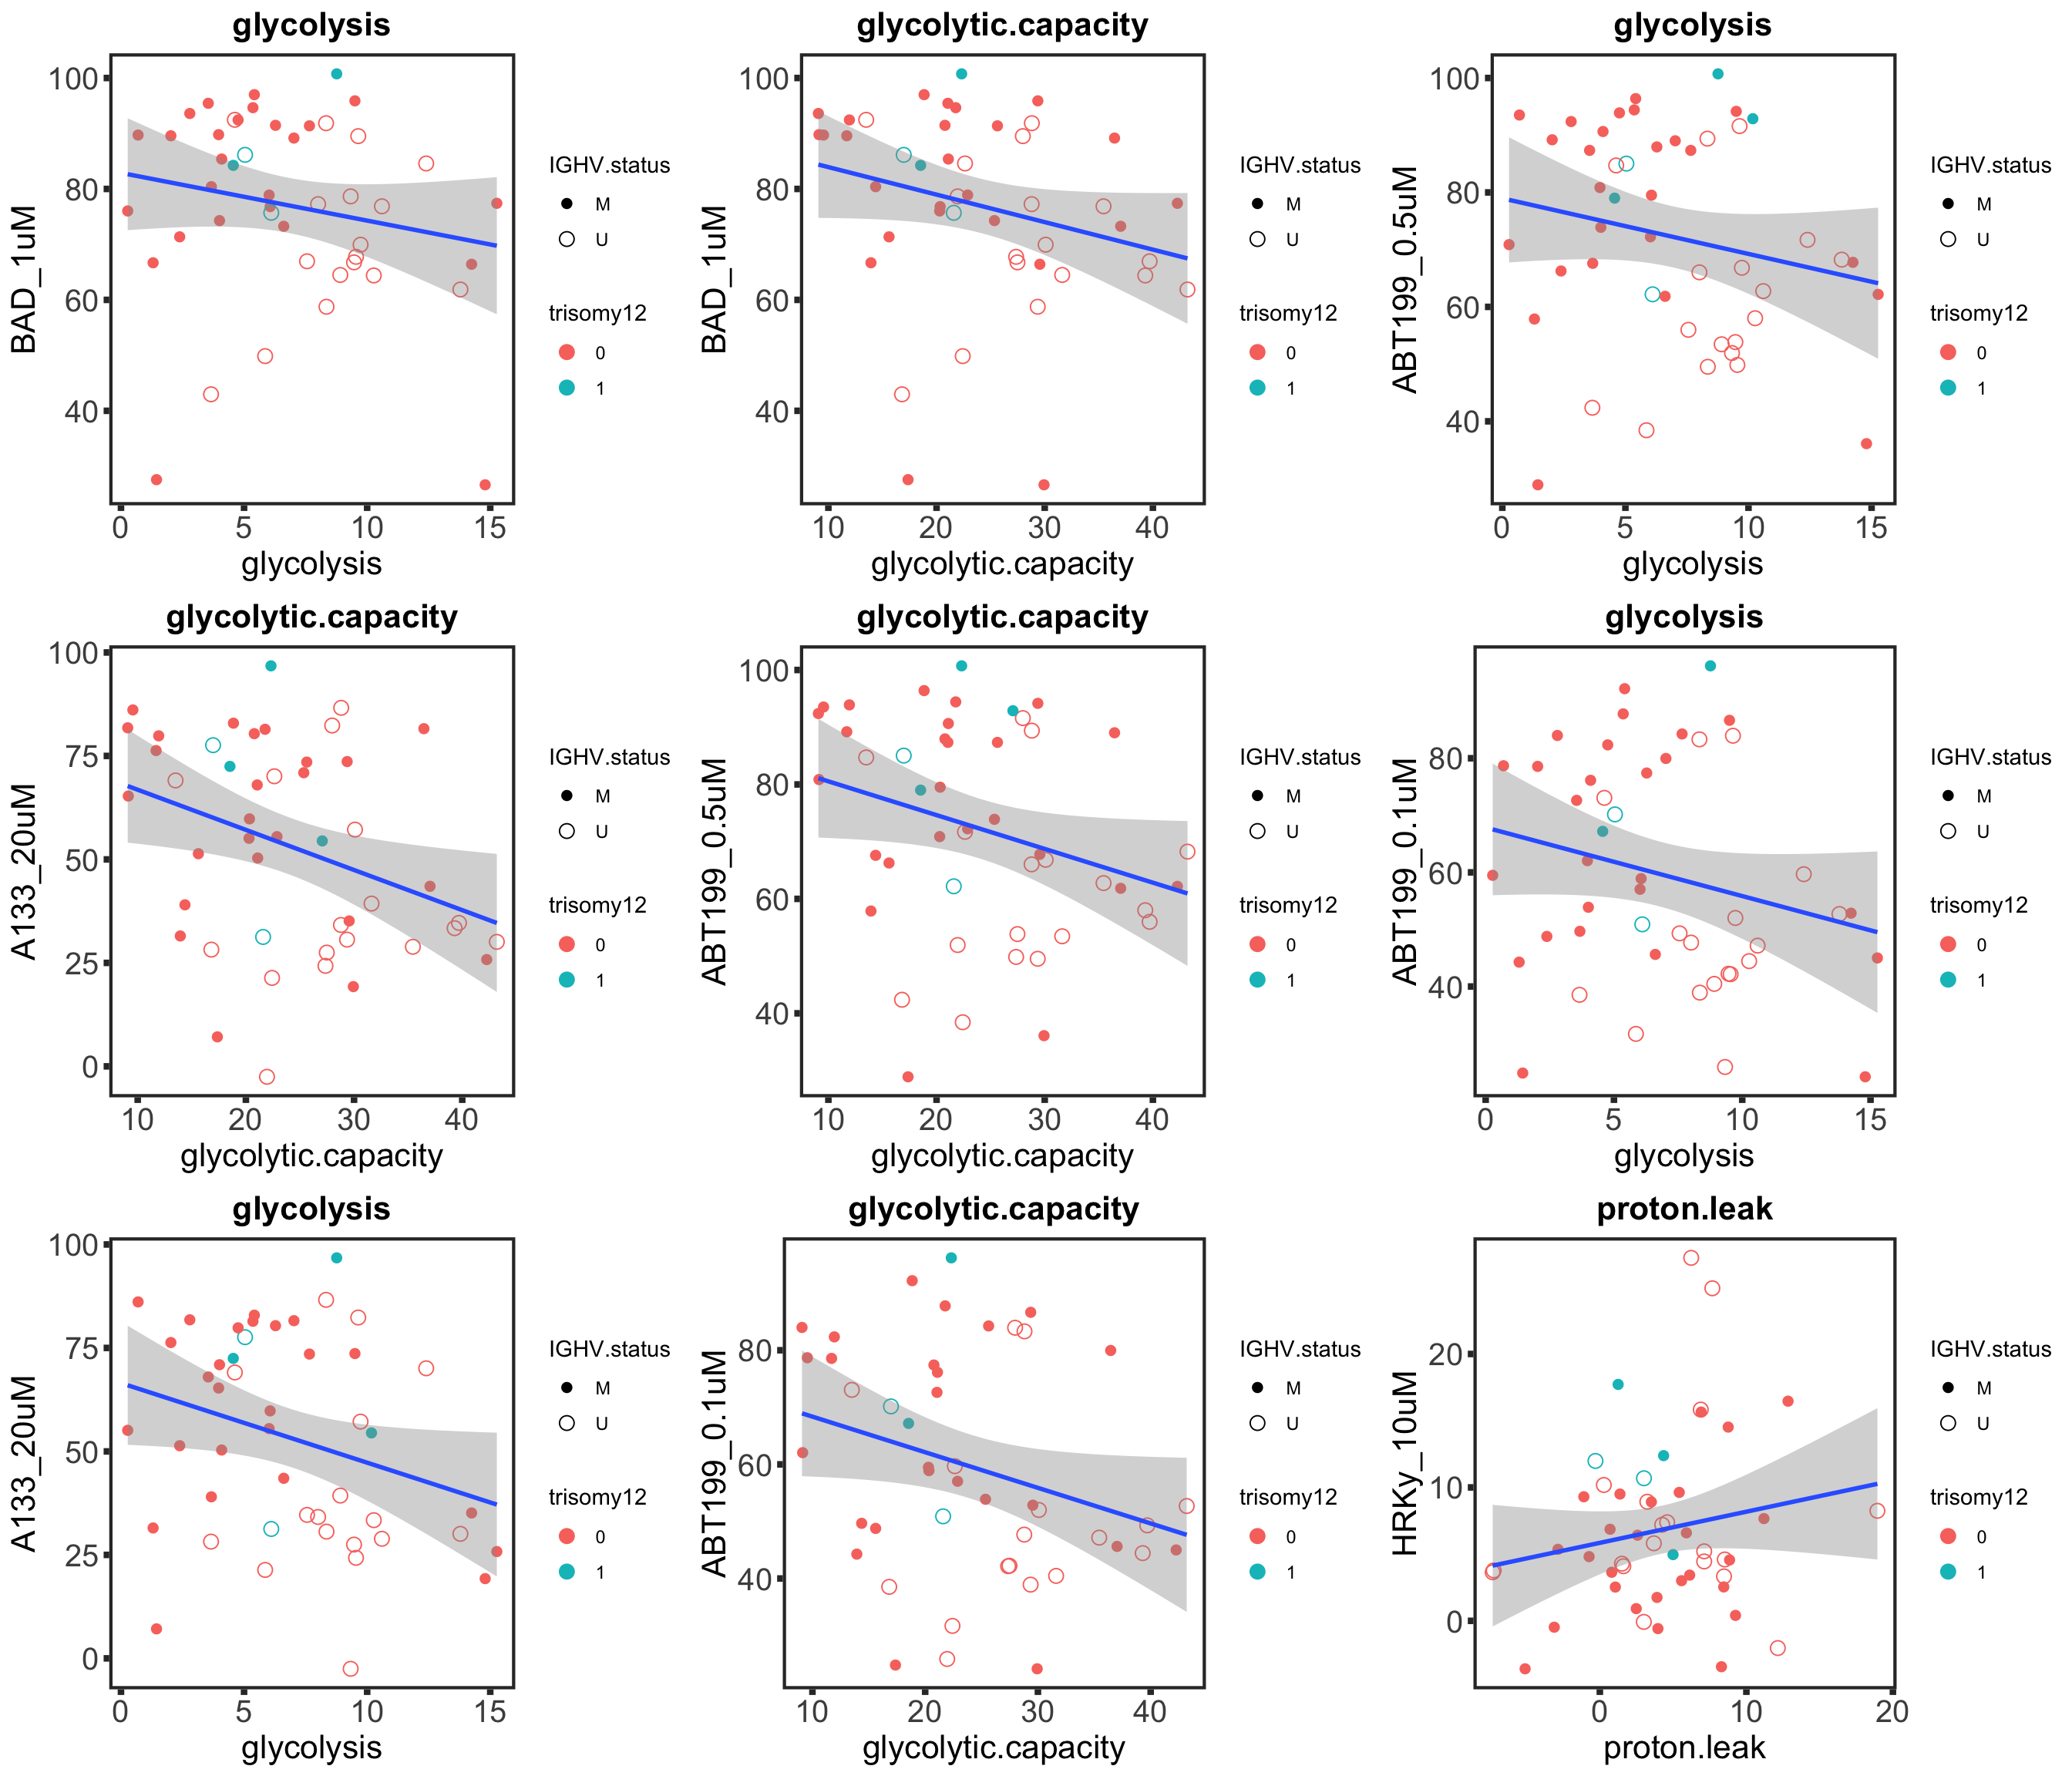
Plot top 9 significant associations
Pathway enrichment analysis for features that associate with gene expression
[1] "No sets passed the criteria"
[1] "No sets passed the criteria"
$ABT199_0.5uM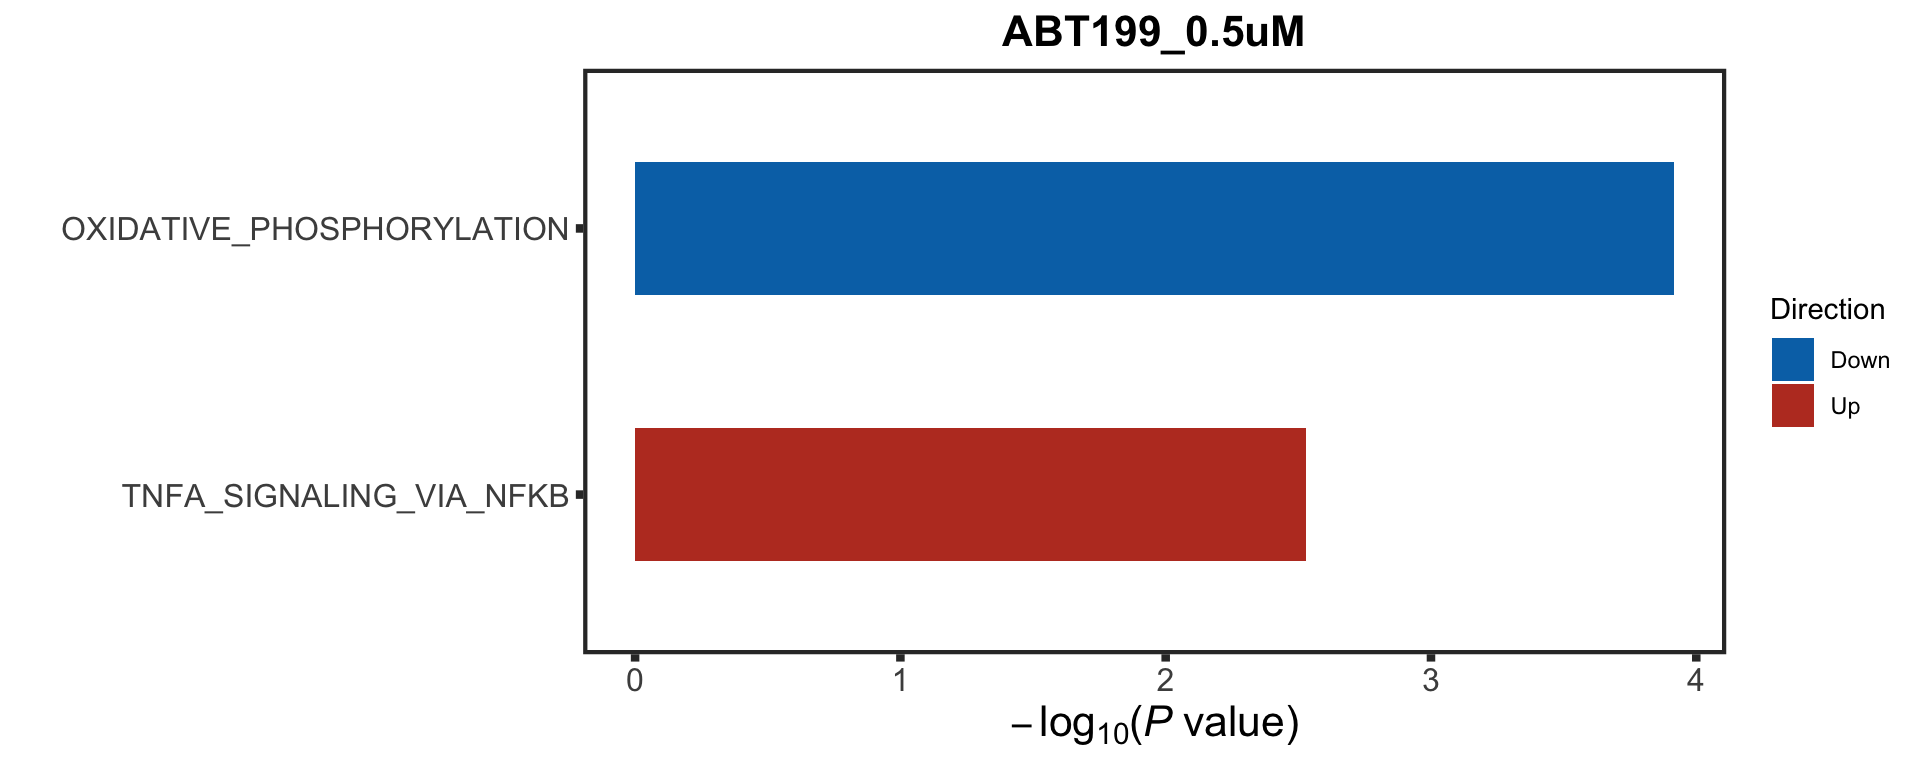
$FS1_1uM
NULL

$ABT199_0.1uM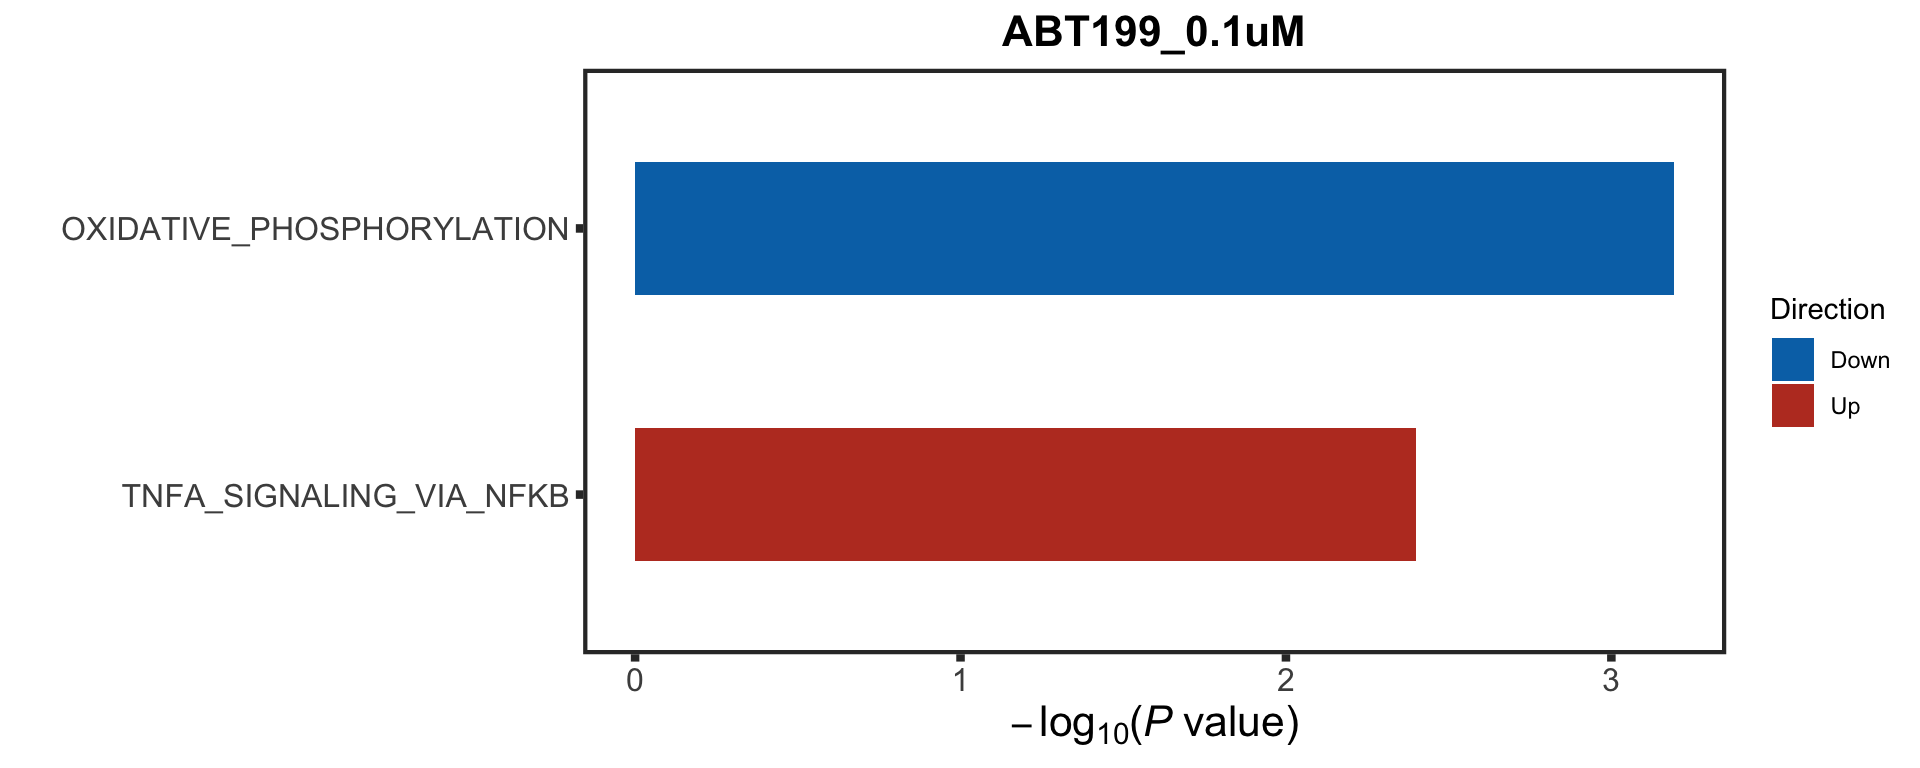
$BAD_1uM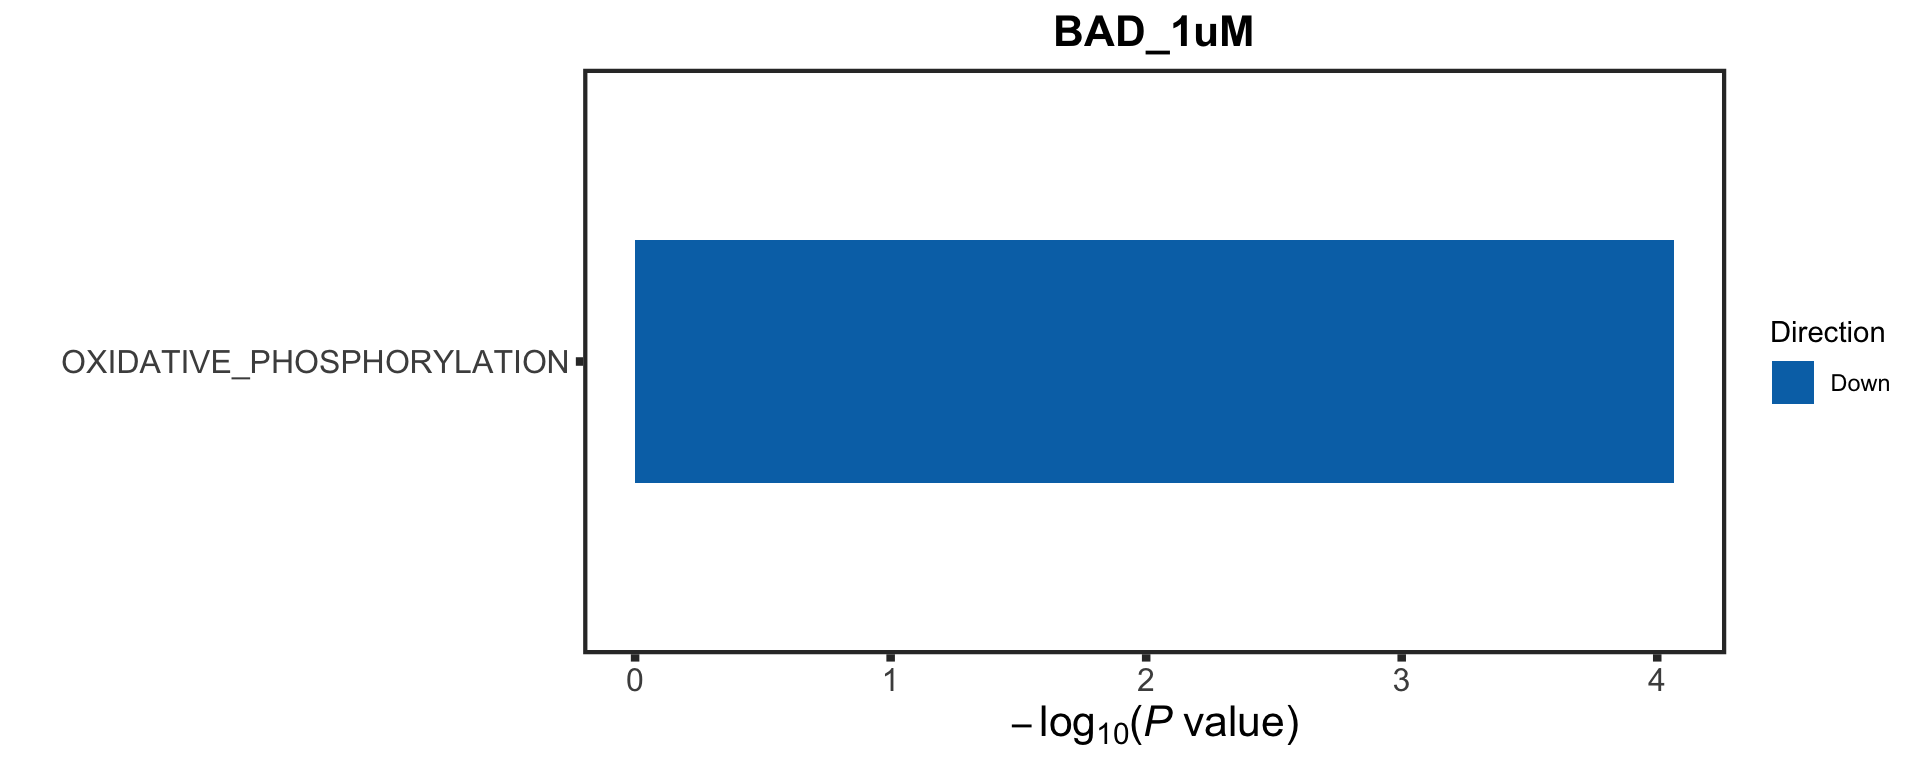
$A133_20uM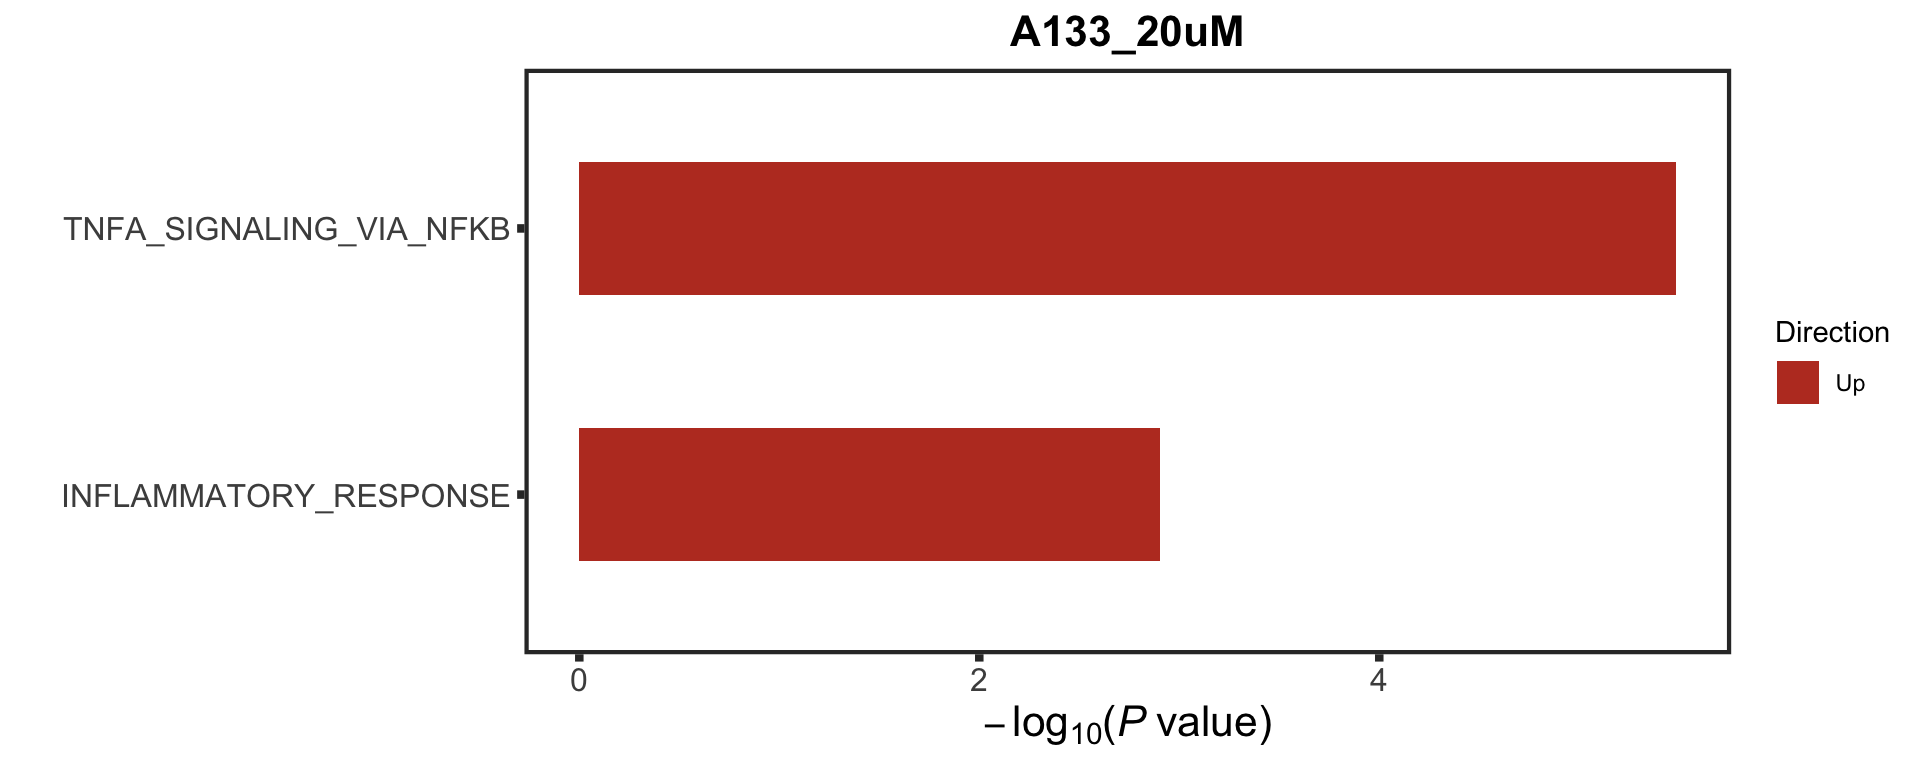
$A133_1uM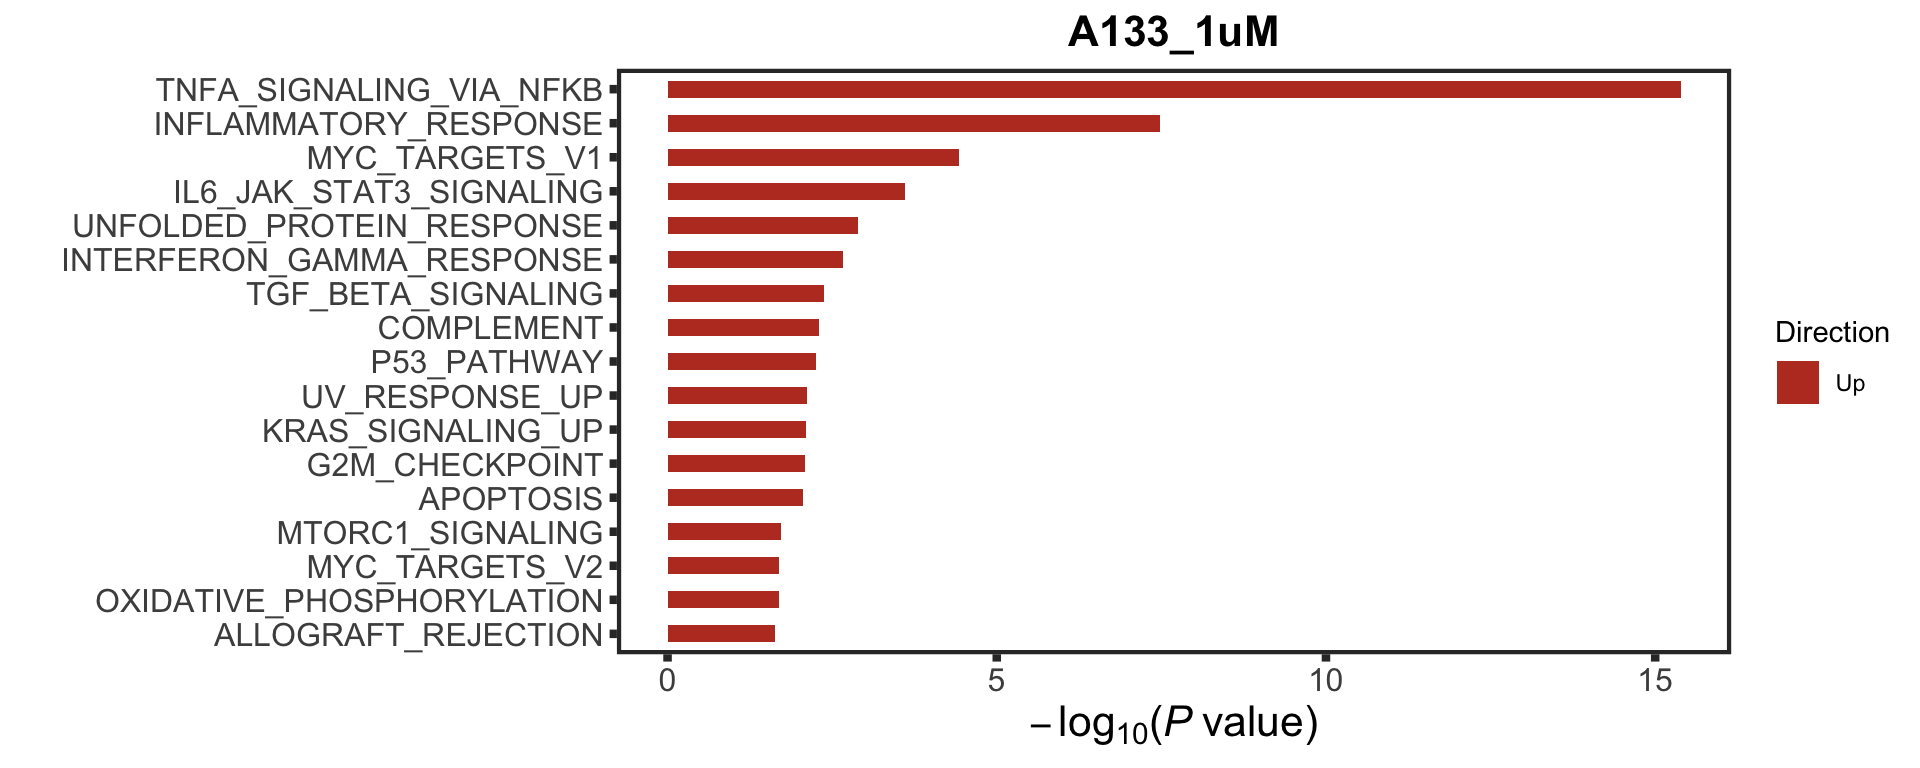
$BAD_0.05uM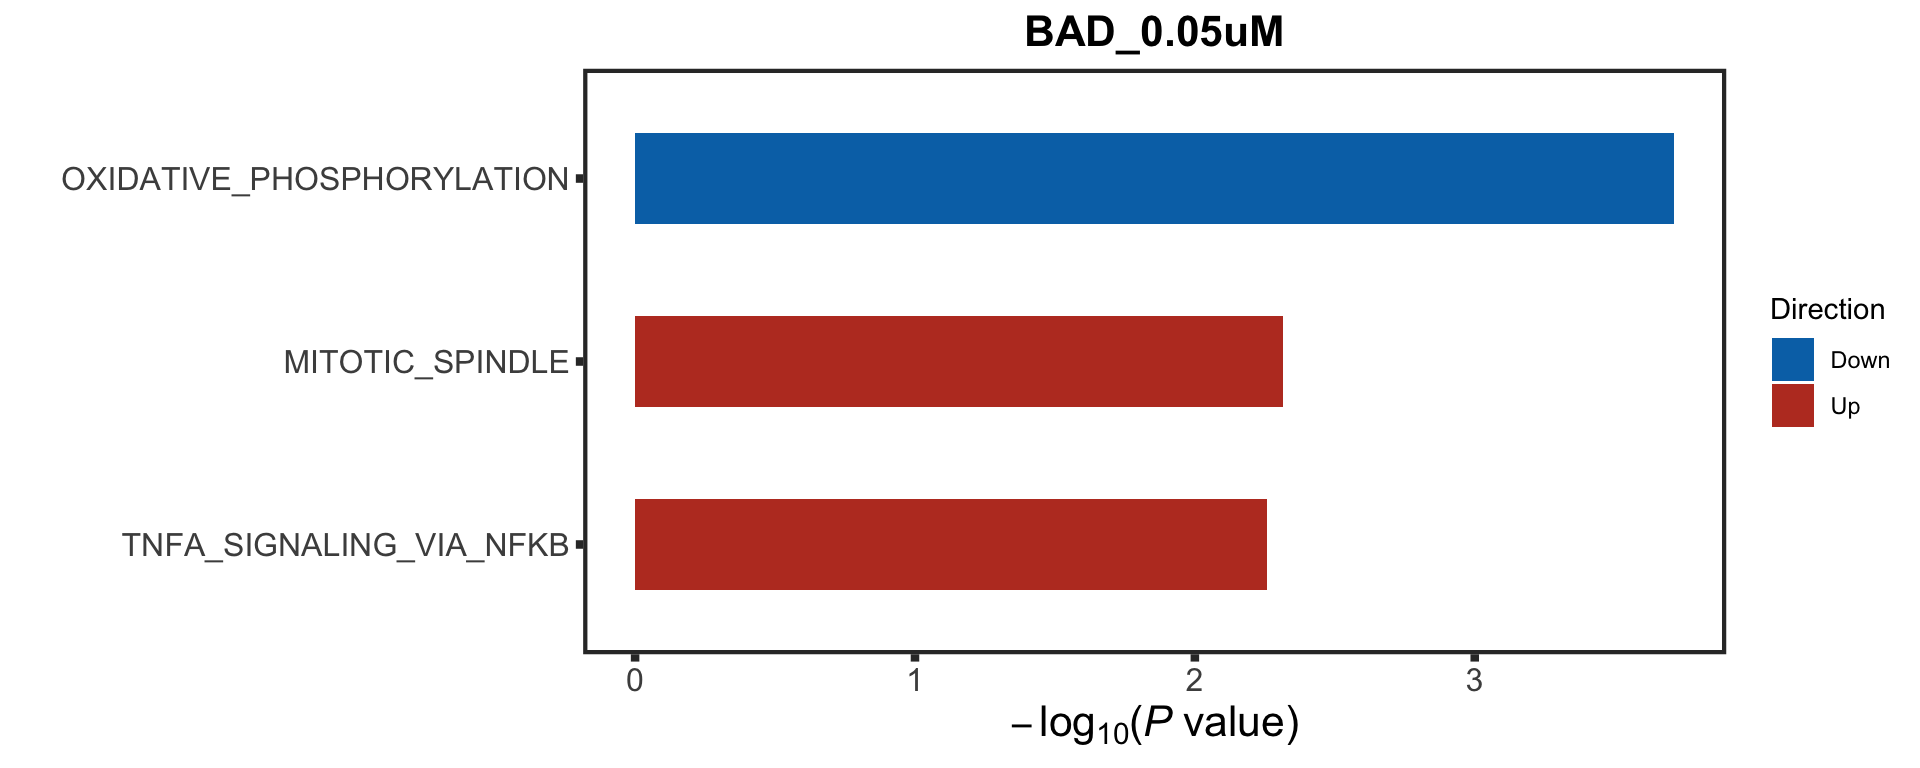
$FS1_5uM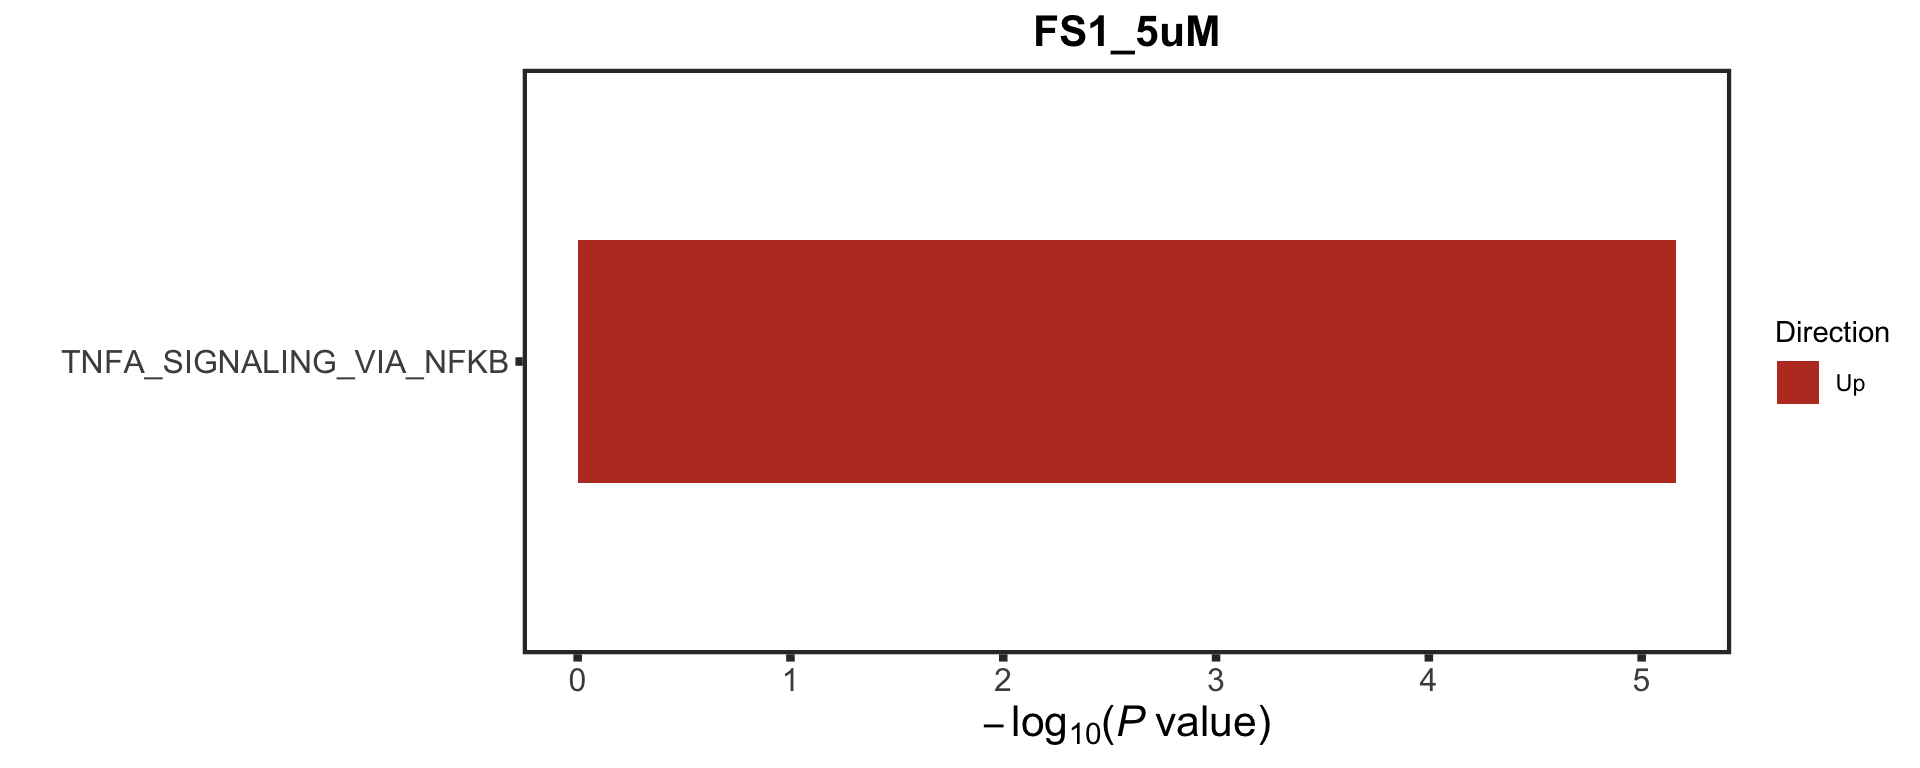
$HRKy_10uM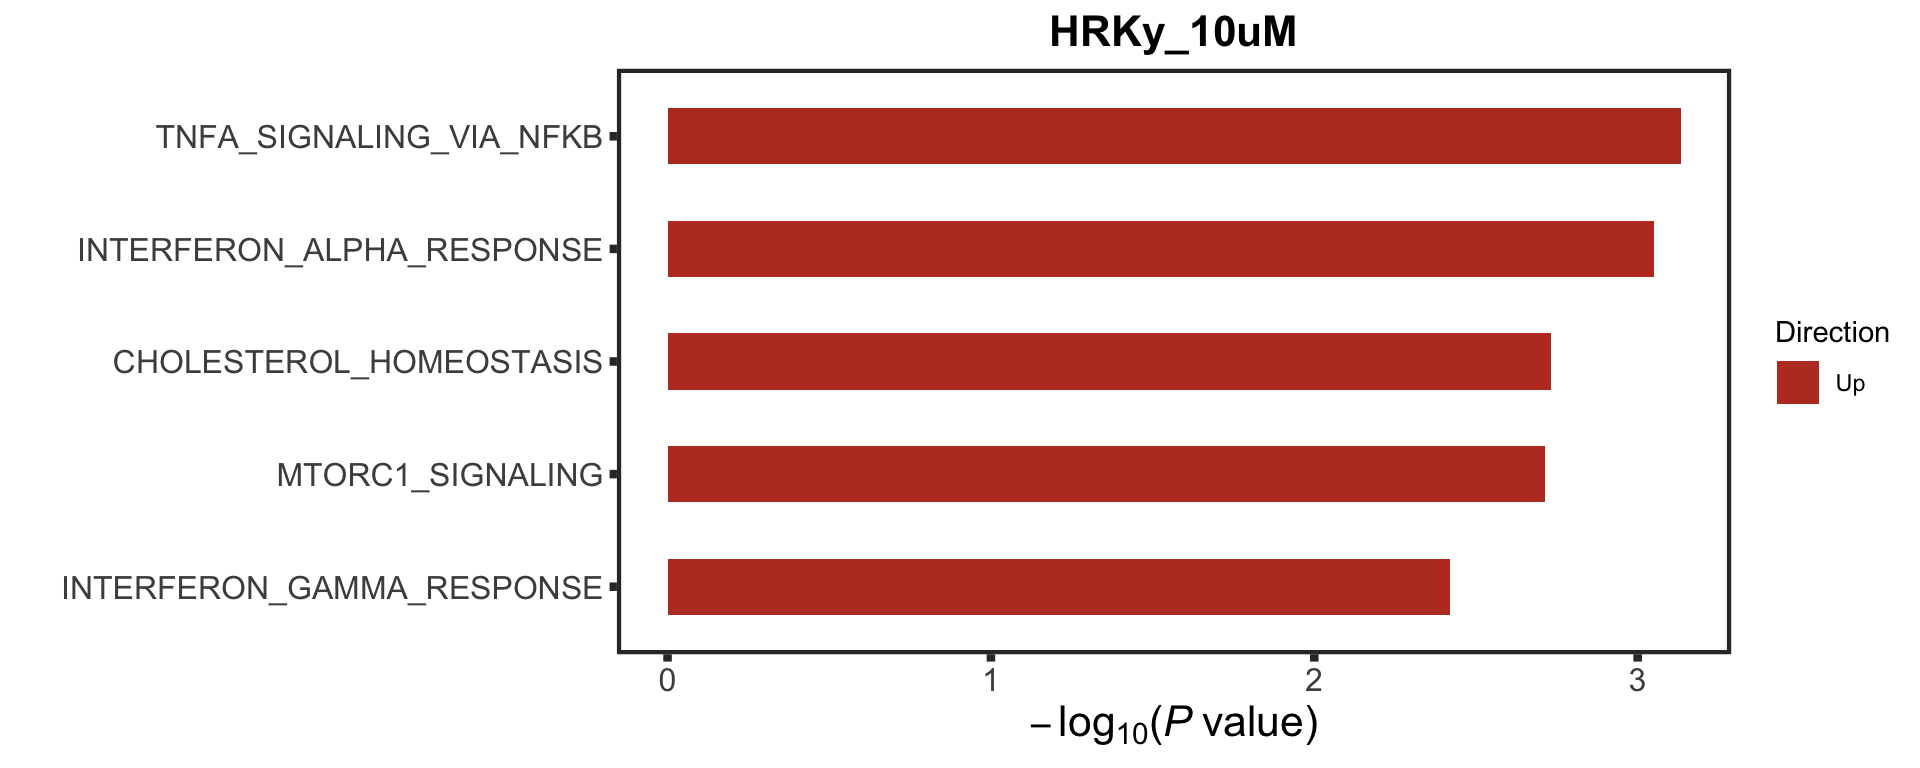
$BIM_0.005uM
NULL

$BAD_0.1uM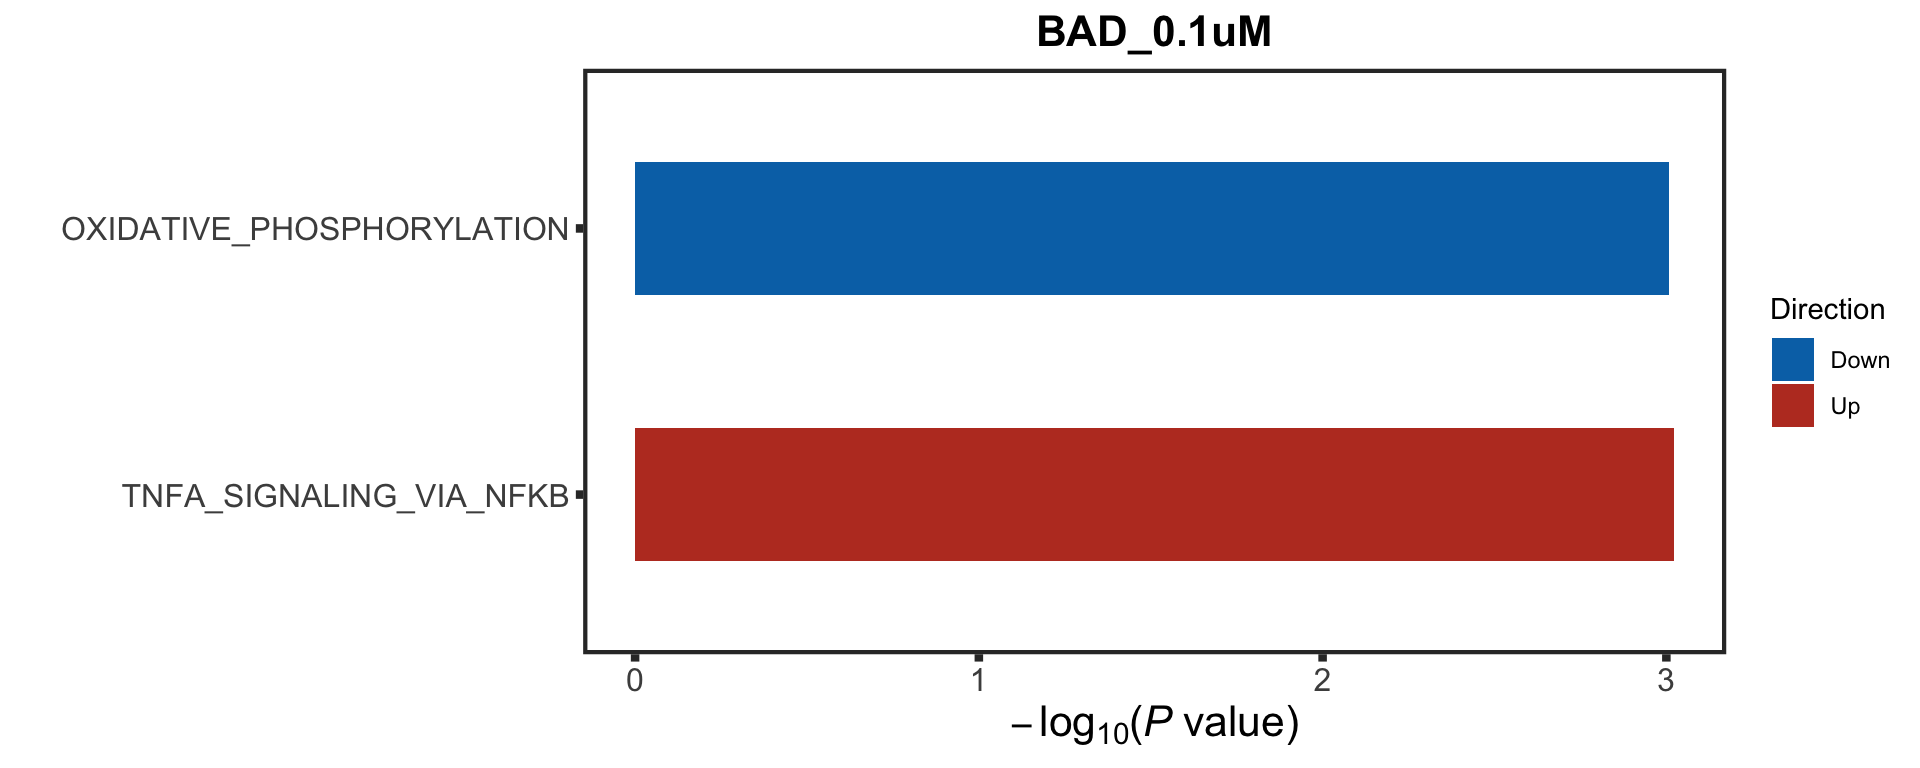
$BIM_0.01uM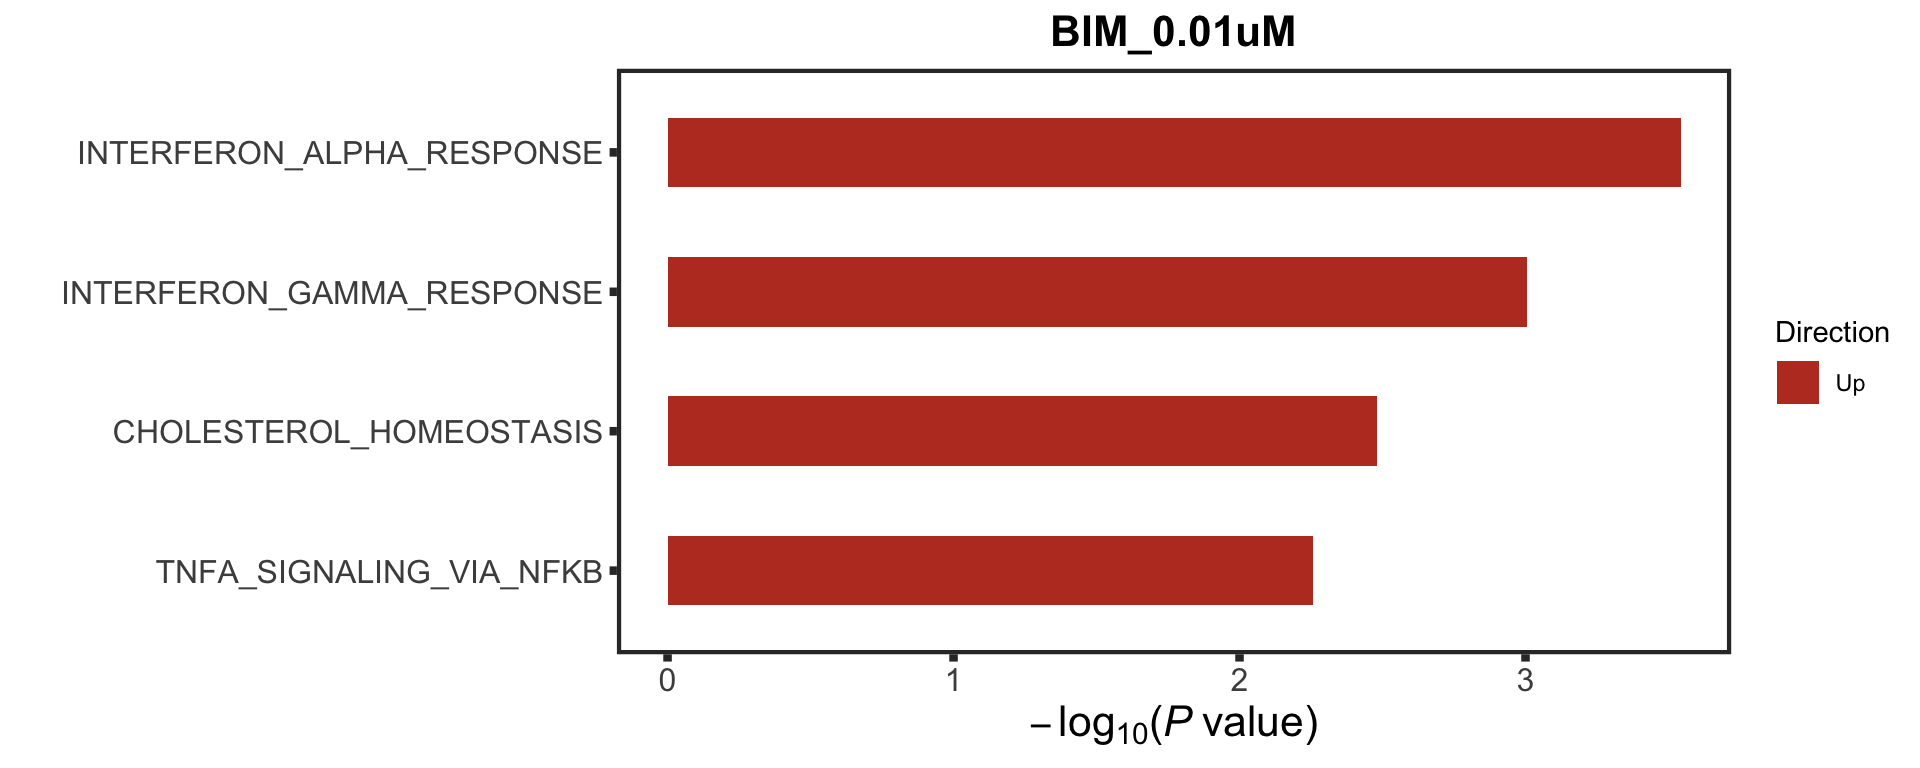
$BIM_0.1uM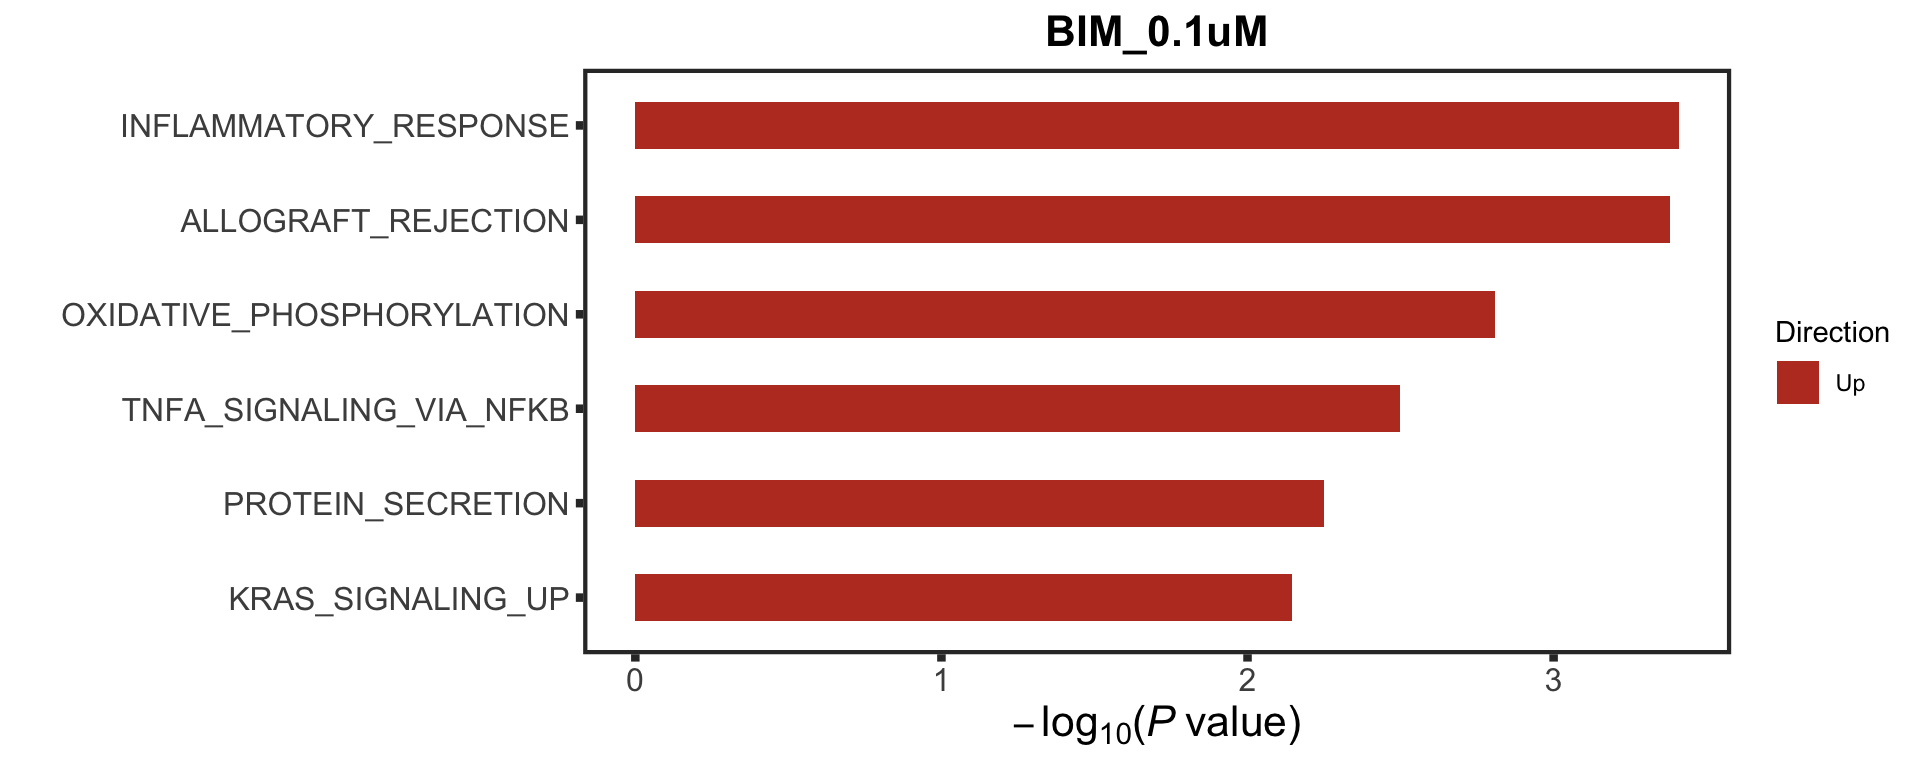
$ABT199_0.01uM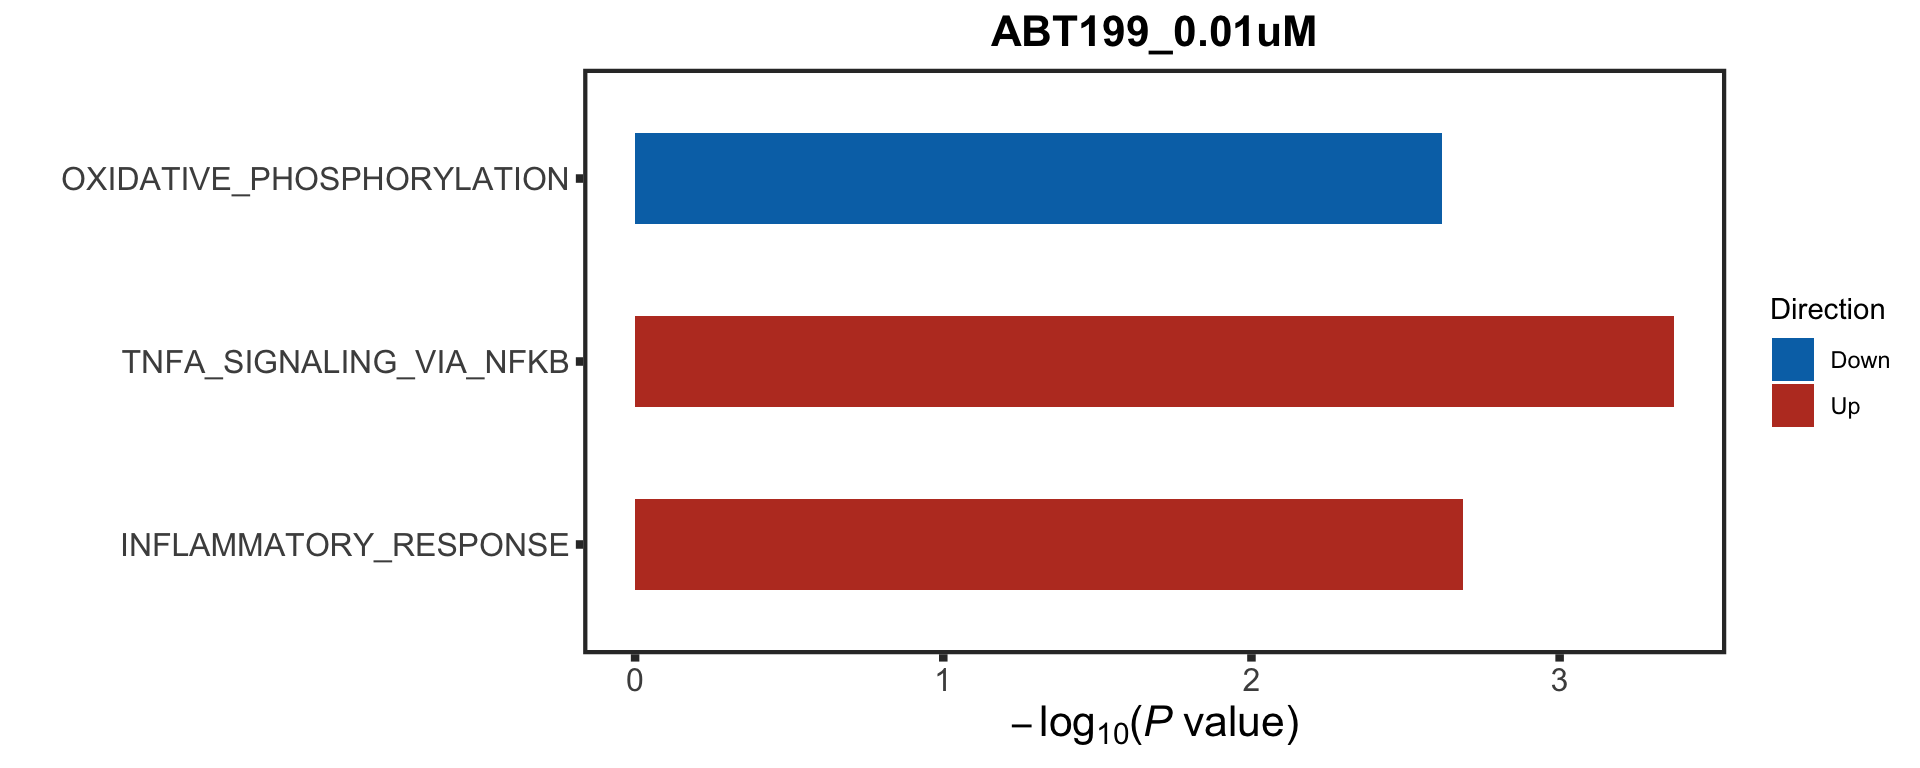
$BIM_0.05uM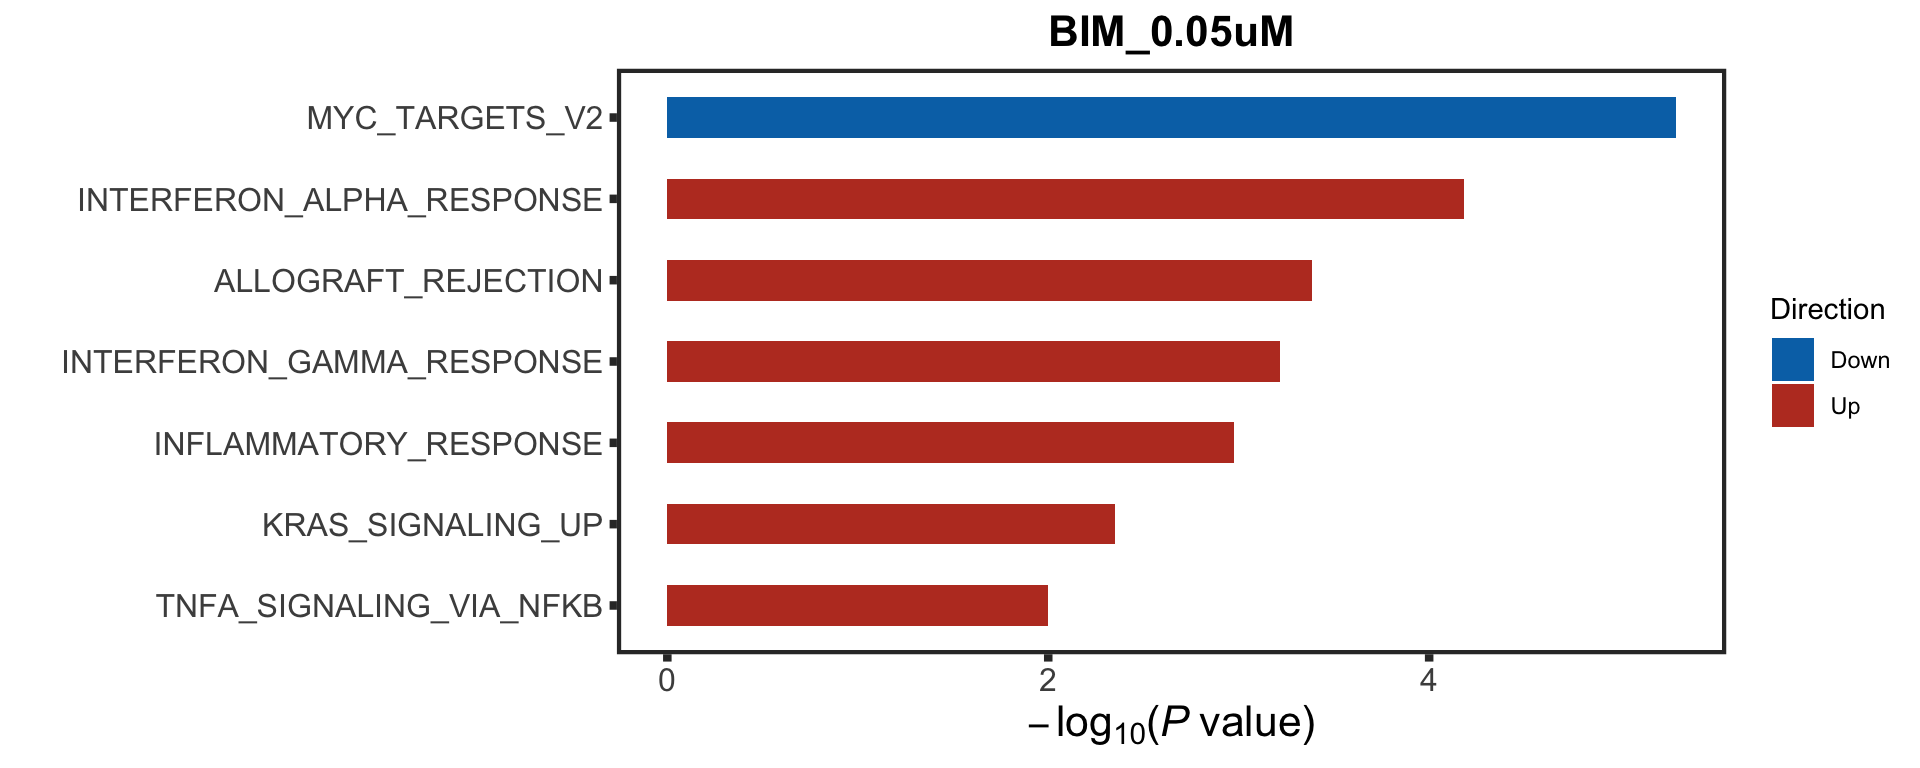
$MS1_1uM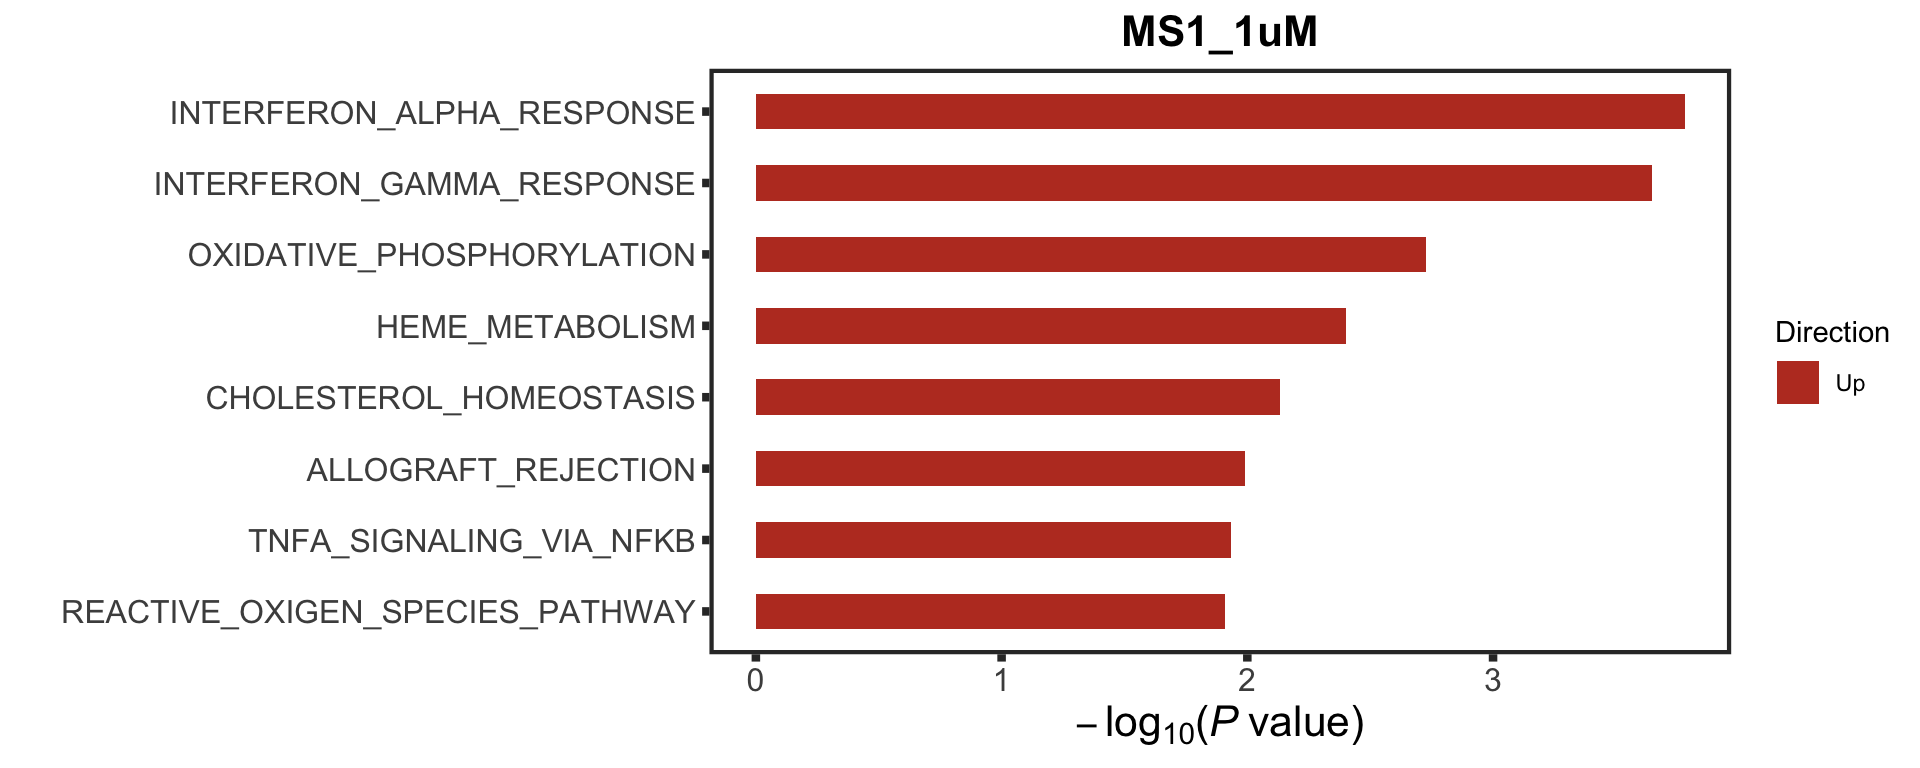
$A133_10uM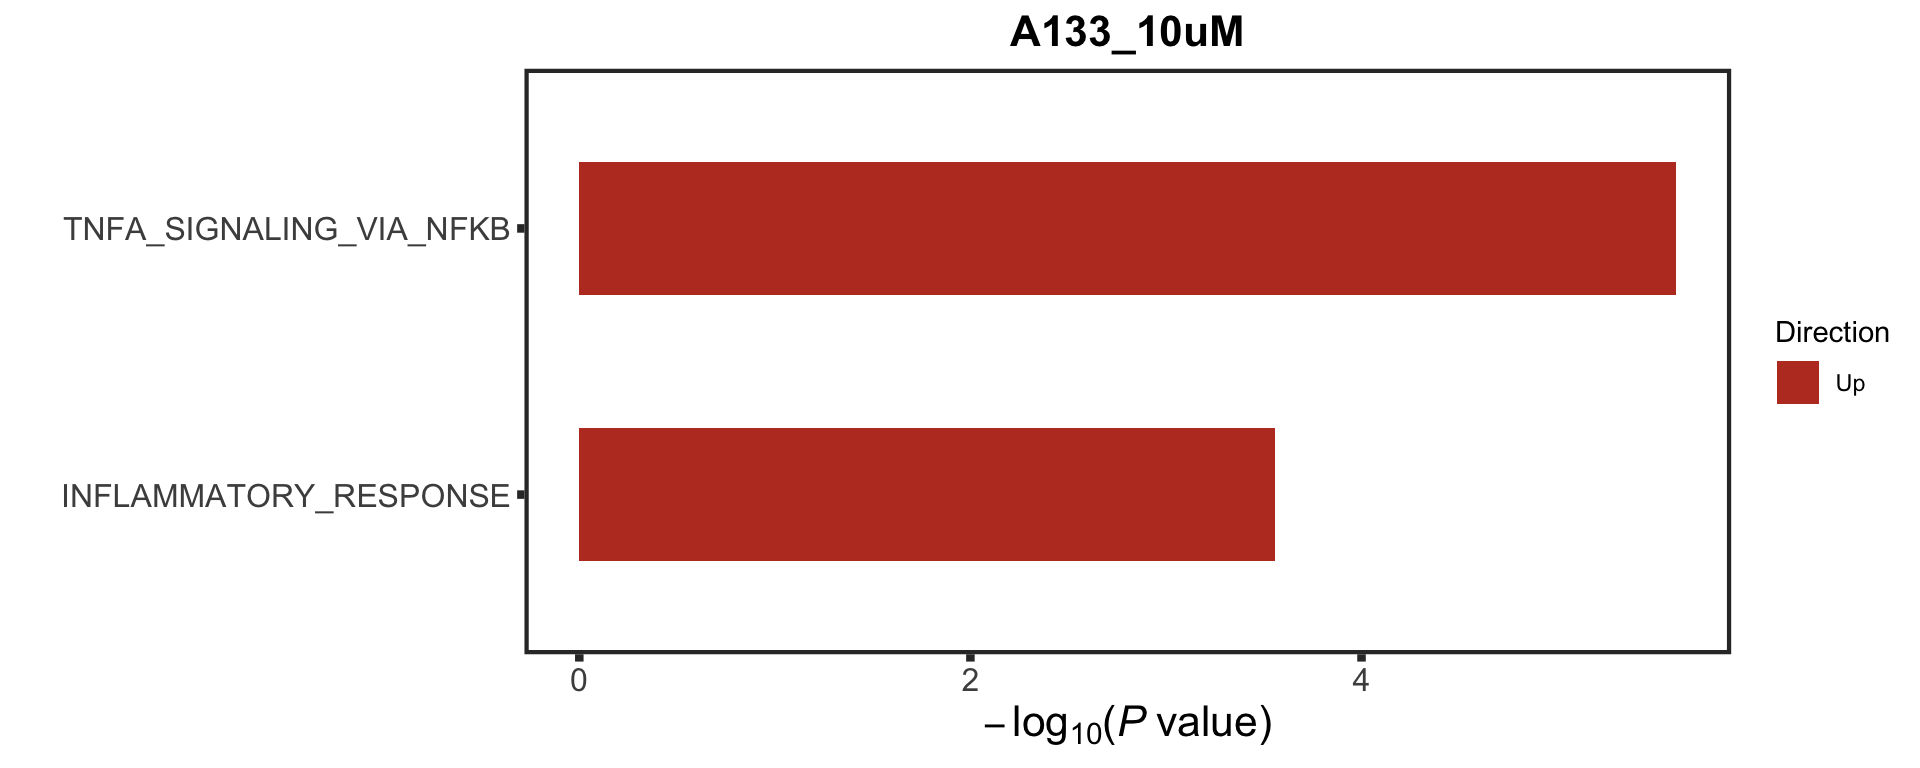
Association with proteomics
Preprocessing
Proteomics
[1] 4316 21BH3 profiling
Association test for each feature
Number of significant associations per feature (10% FDR)
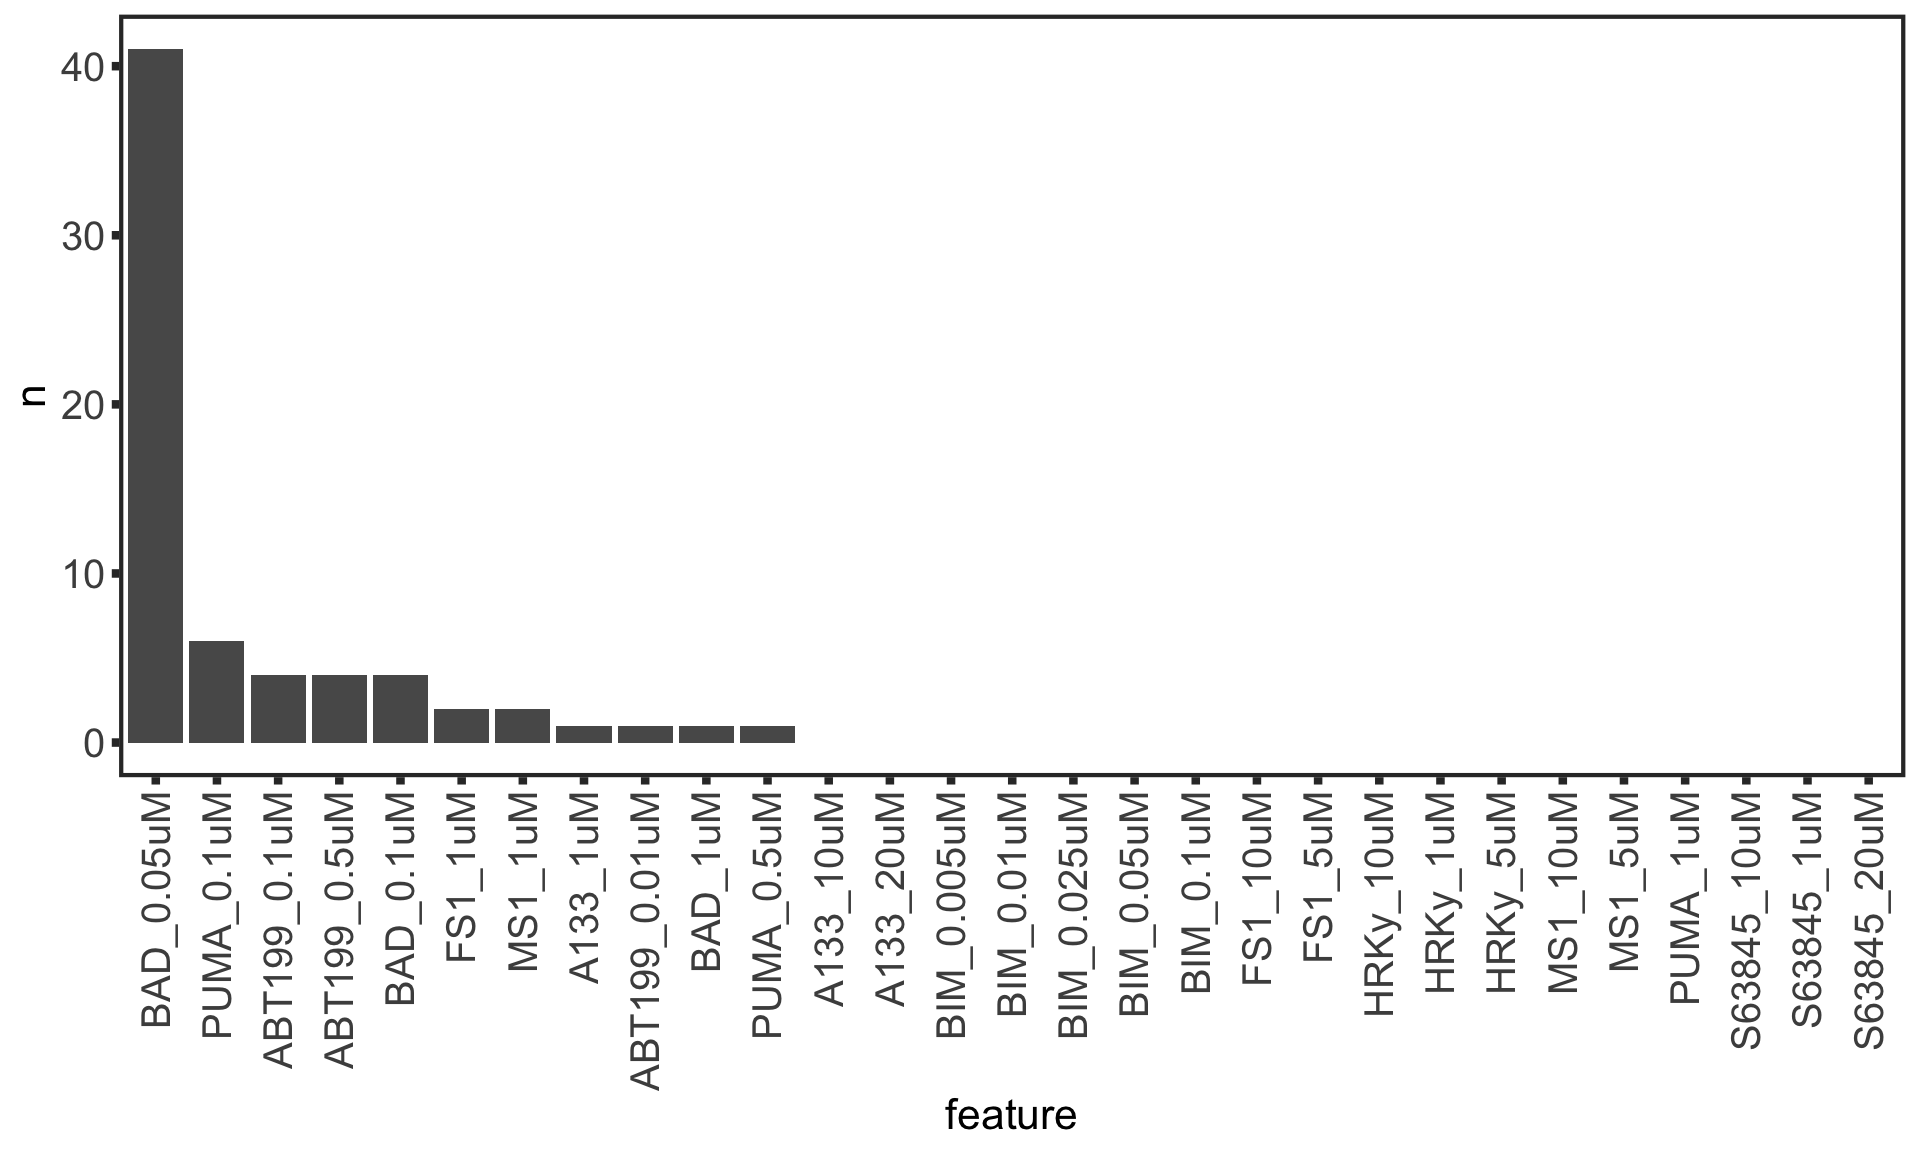
Table of significant associations
Plot top 9 significant associations
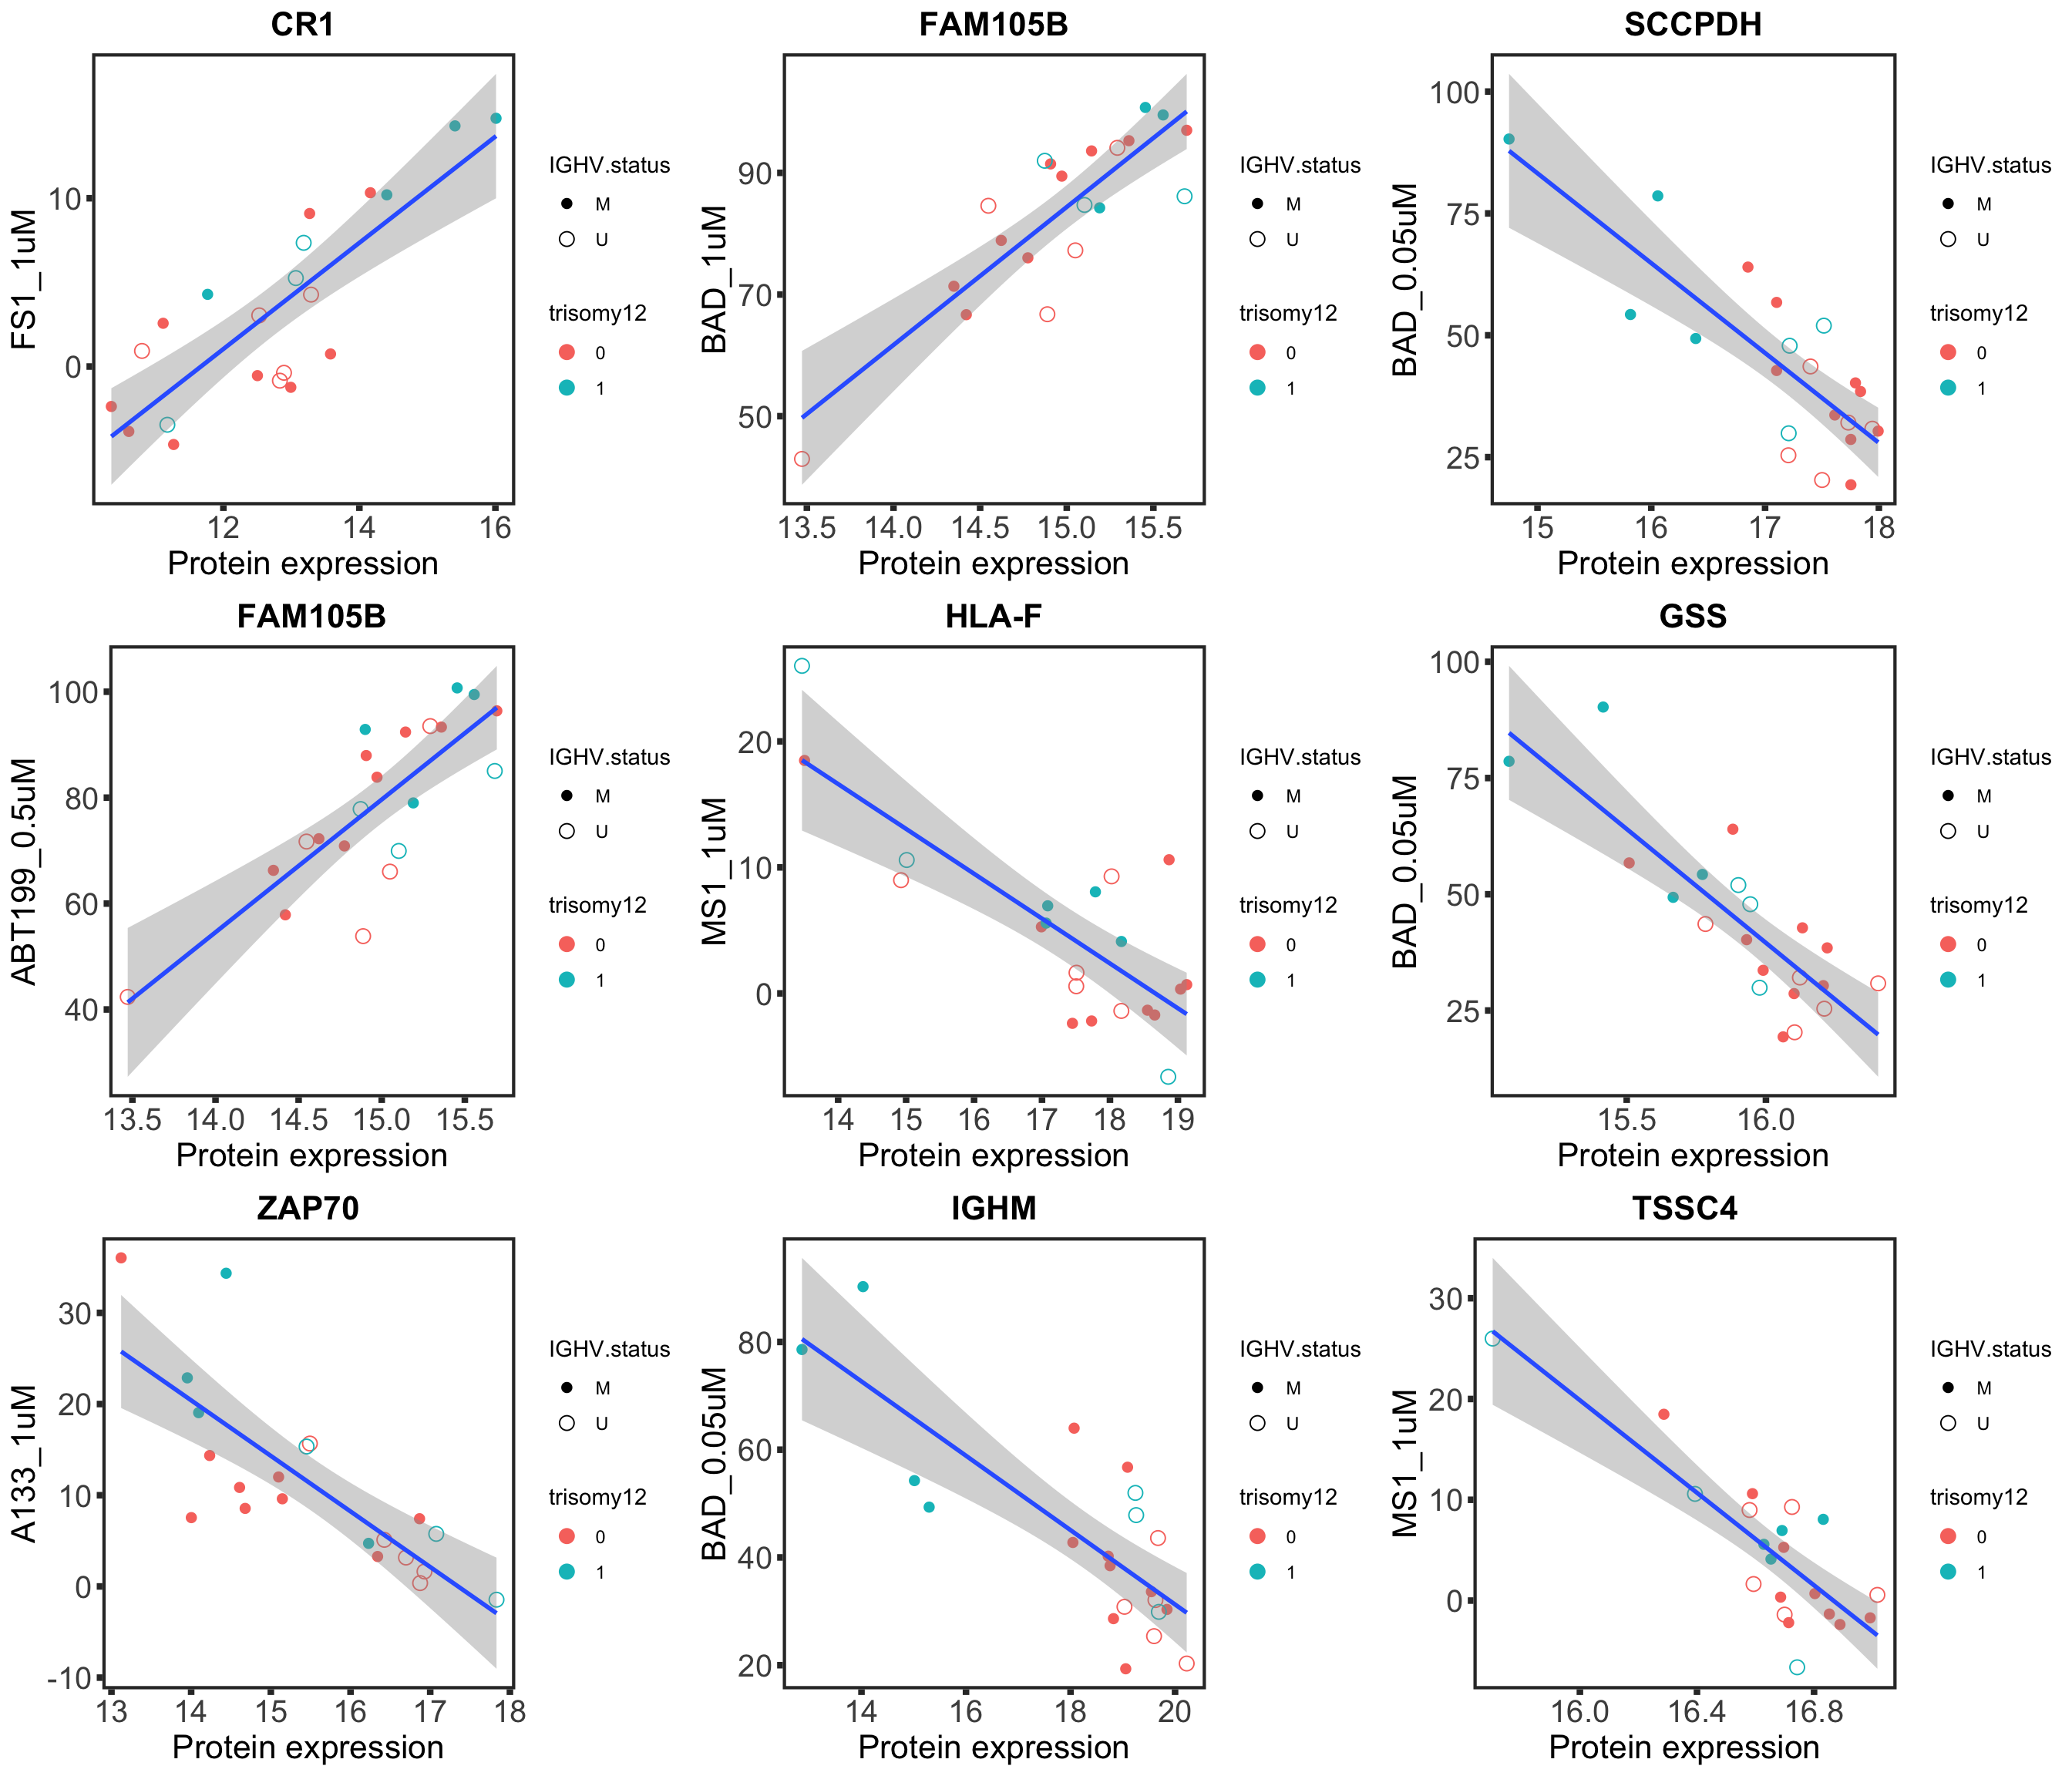
Pathway enrichment analysis for features that associate with gene expression
[1] "No sets passed the criteria"
[1] "No sets passed the criteria"
[1] "No sets passed the criteria"
[1] "No sets passed the criteria"
$BAD_0.05uM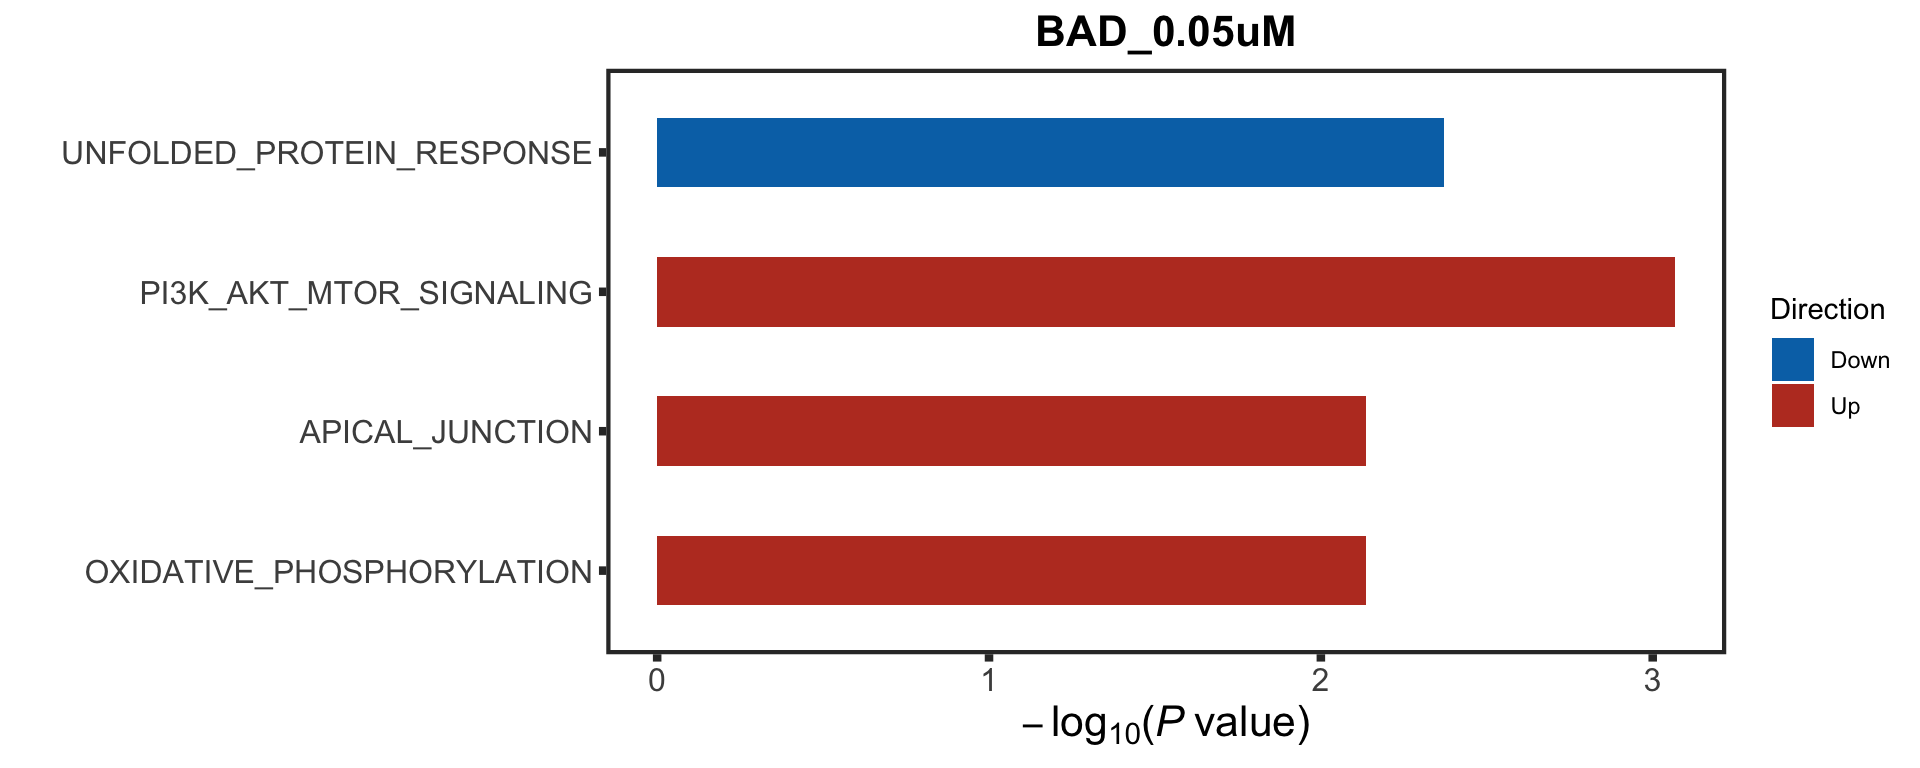
$PUMA_0.1uM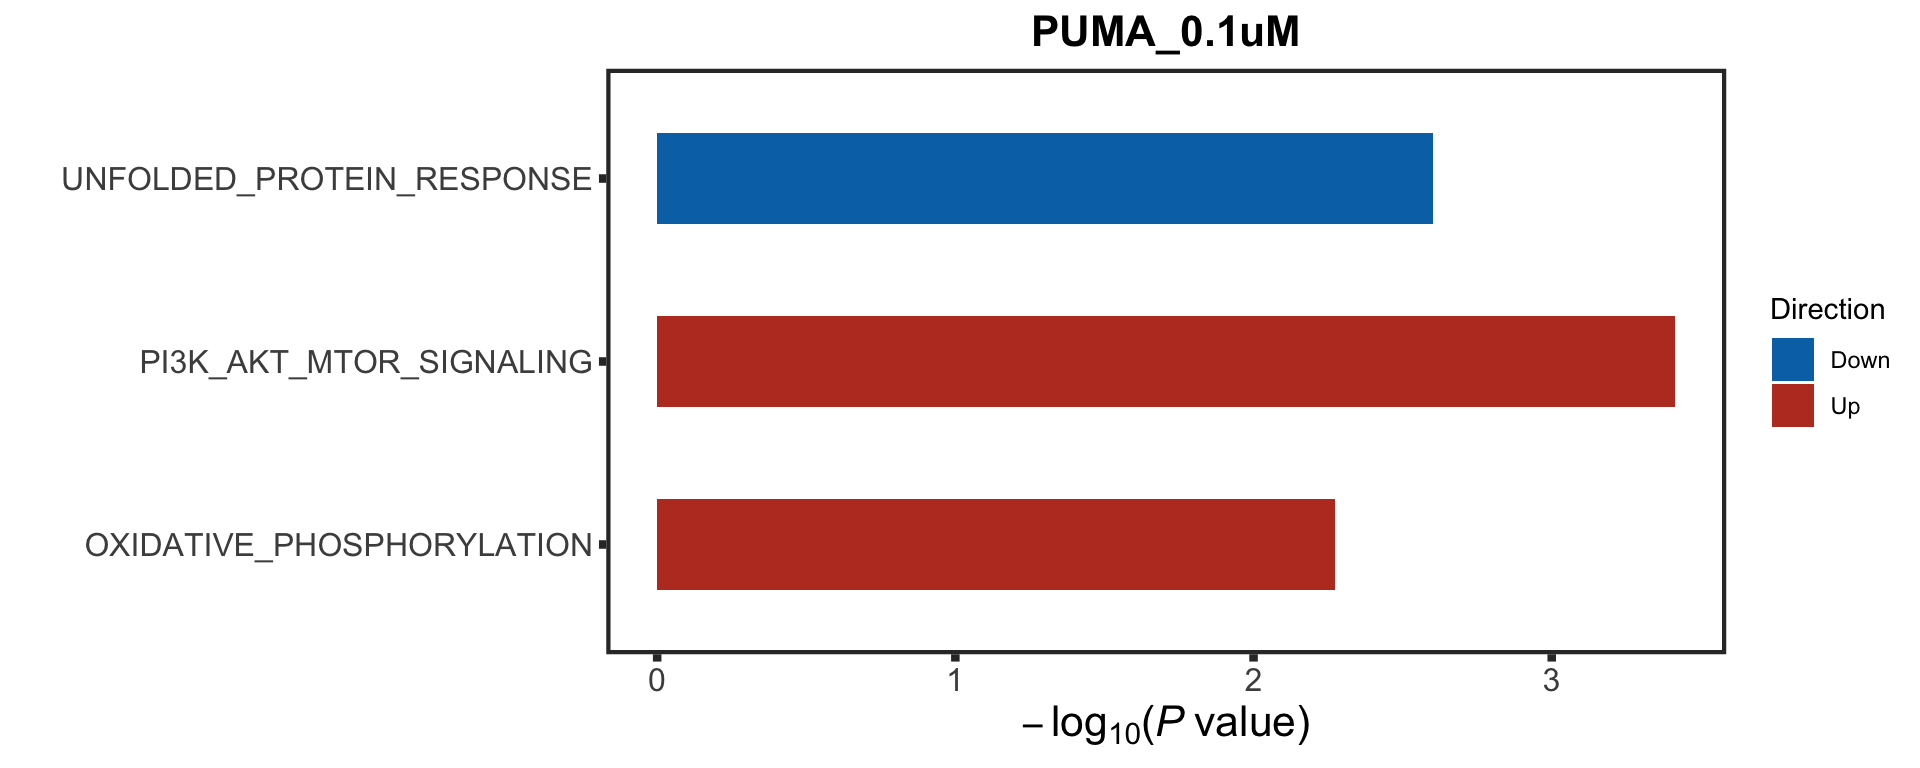
$ABT199_0.1uM
NULL

$ABT199_0.5uM
NULL

$BAD_0.1uM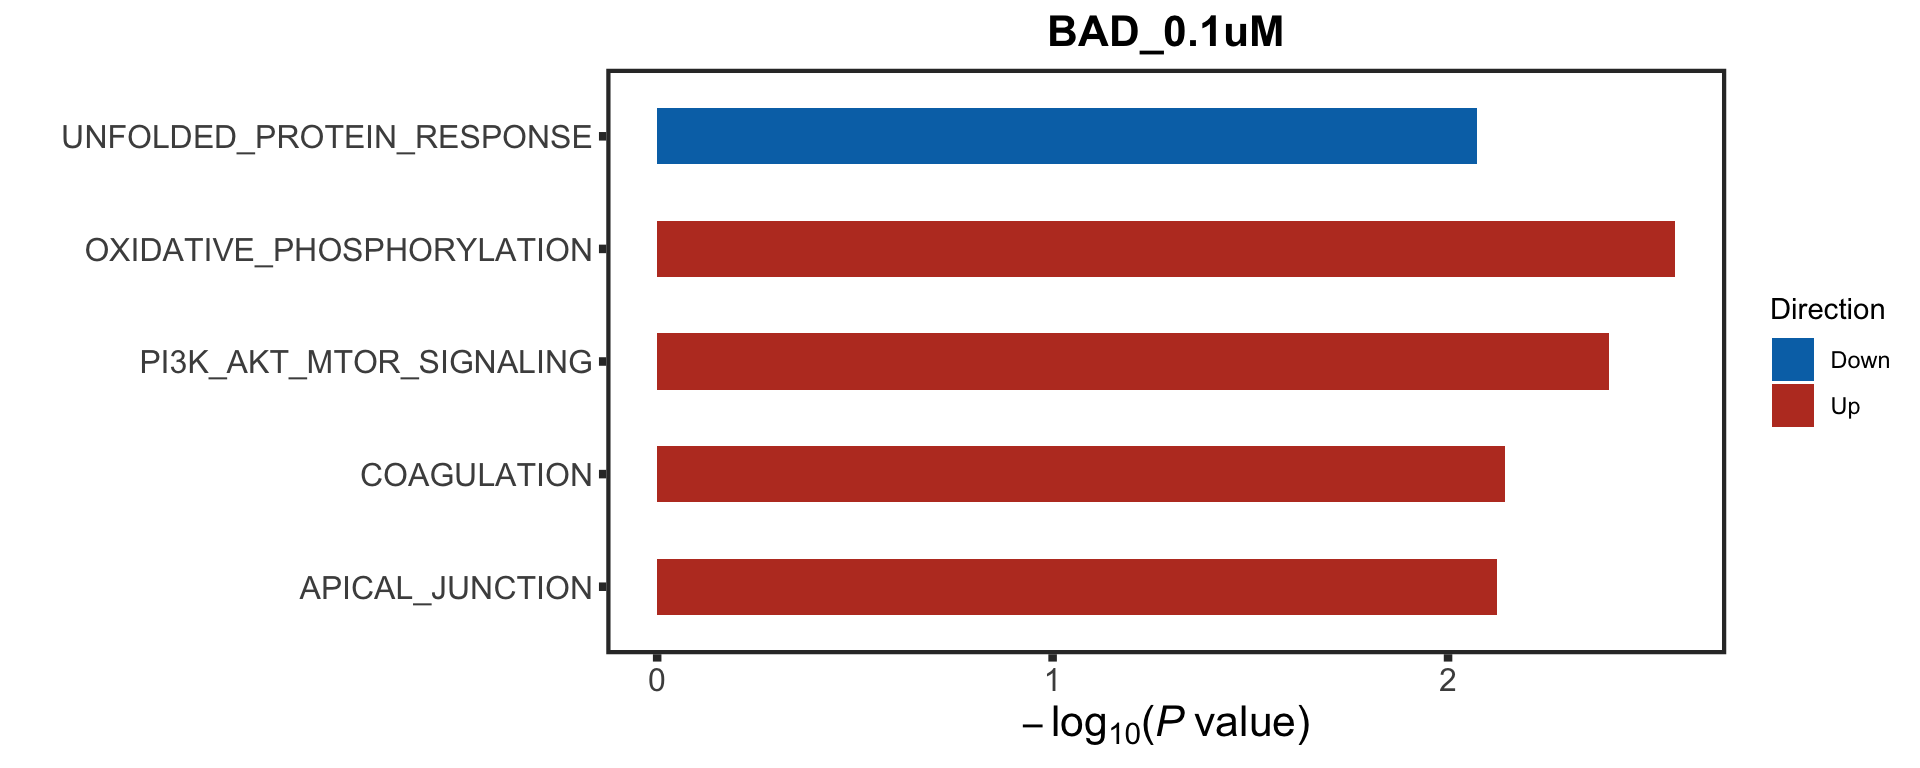
$FS1_1uM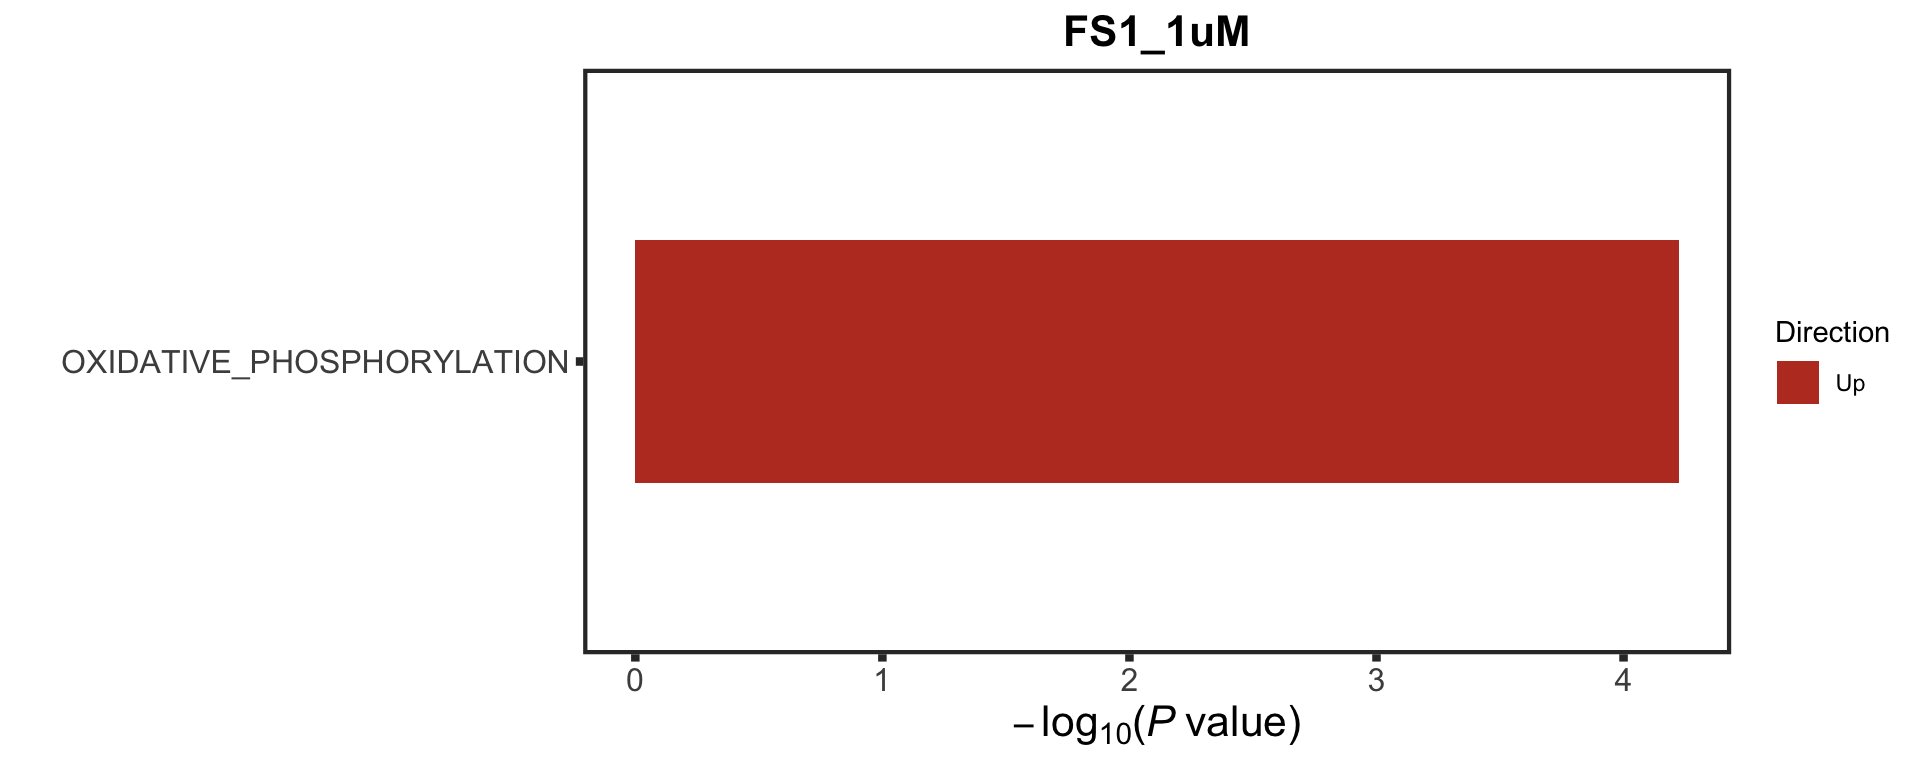
$MS1_1uM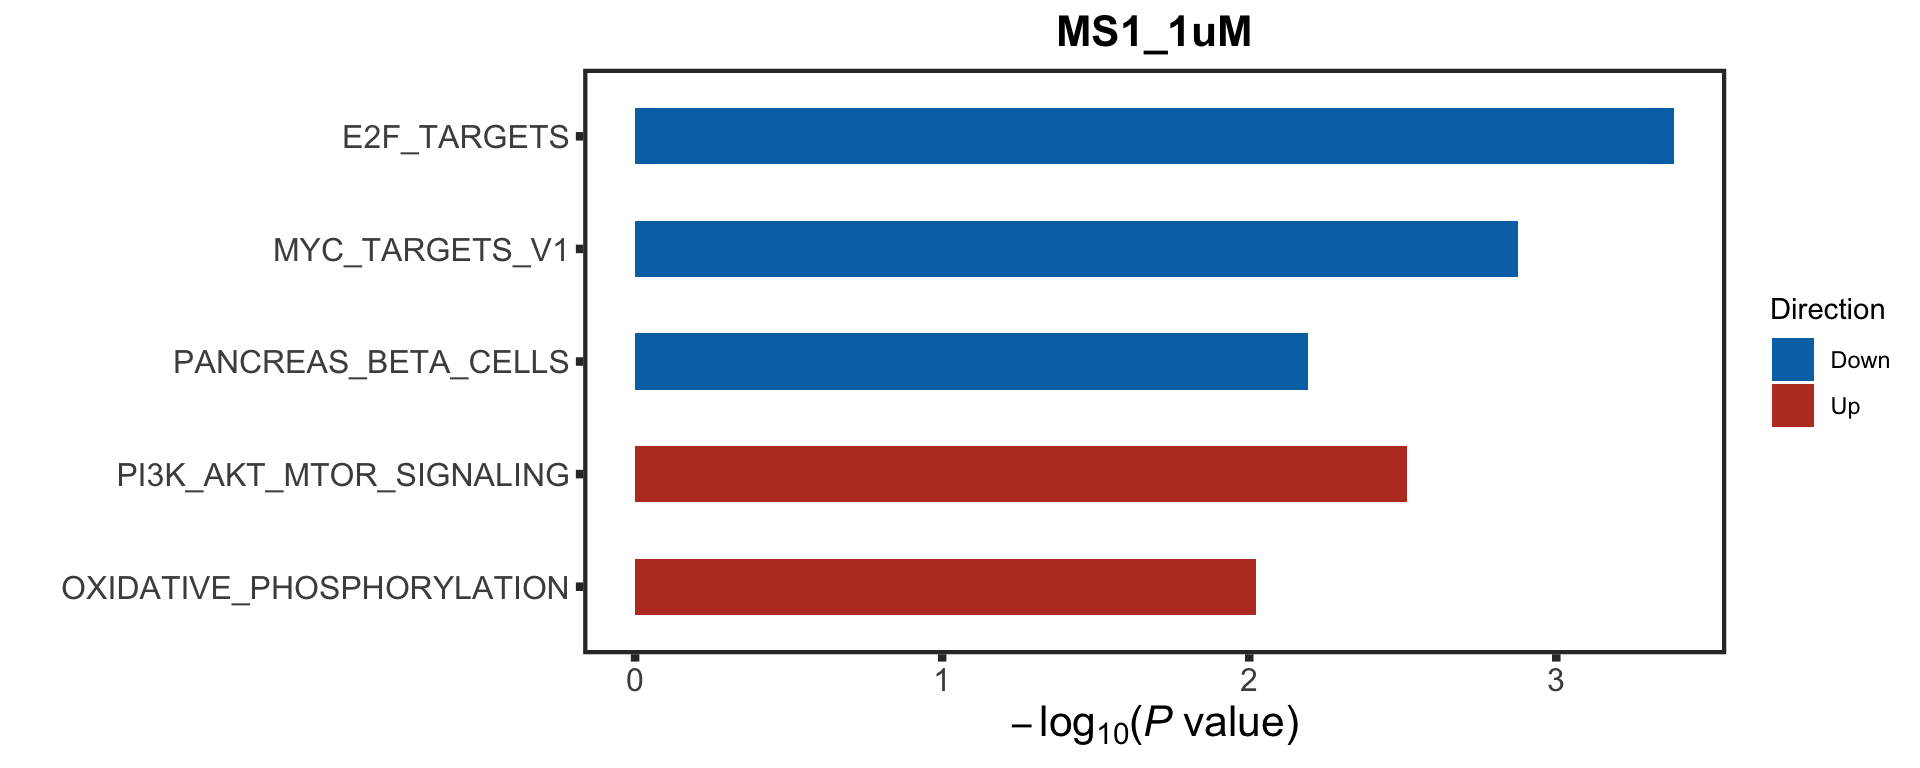
$A133_1uM
NULL

$ABT199_0.01uM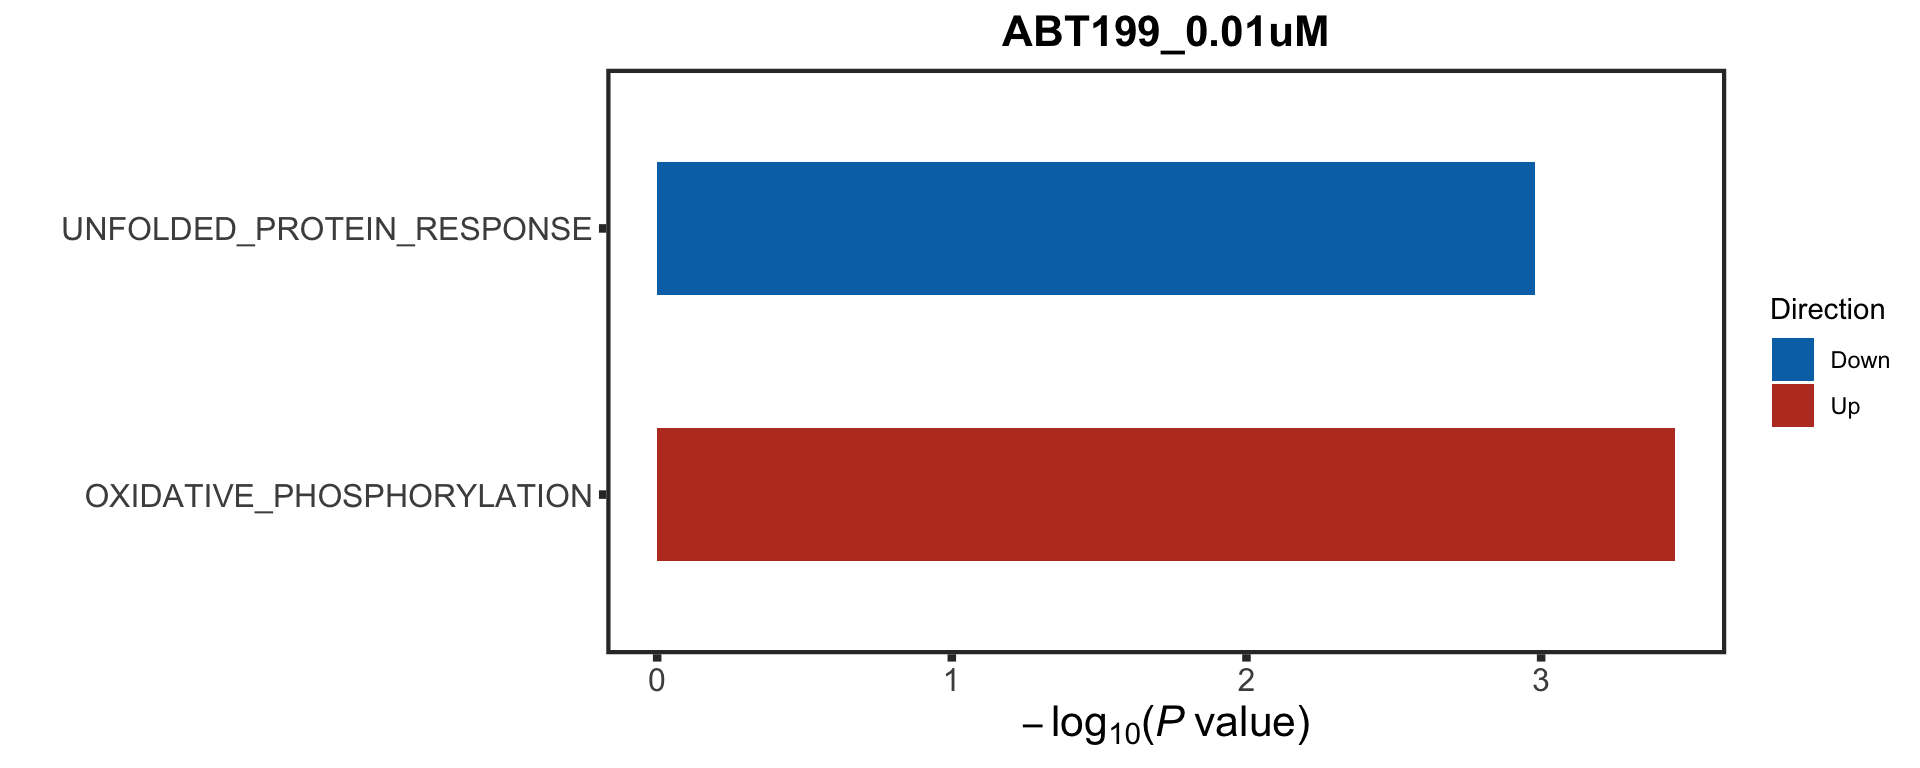
$BAD_1uM
NULL

$PUMA_0.5uM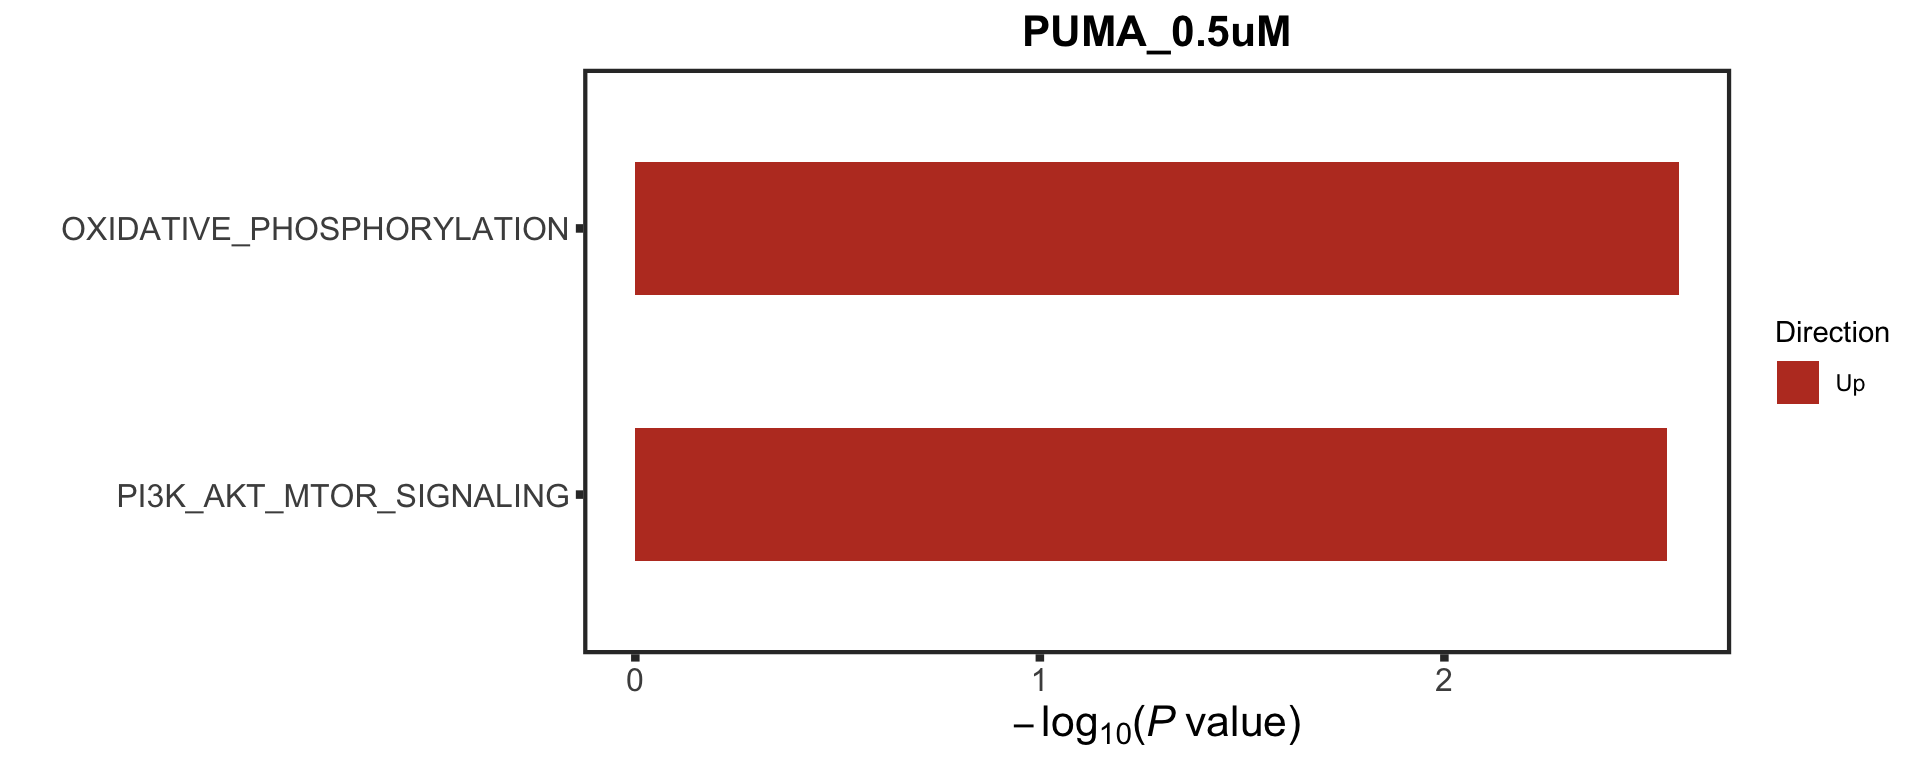
Association with energy metabolomics
Preprocessing
Proteomics
[1] 11 53BH3 profiling
Association test for each feature
Number of significant associations per feature (10% FDR)
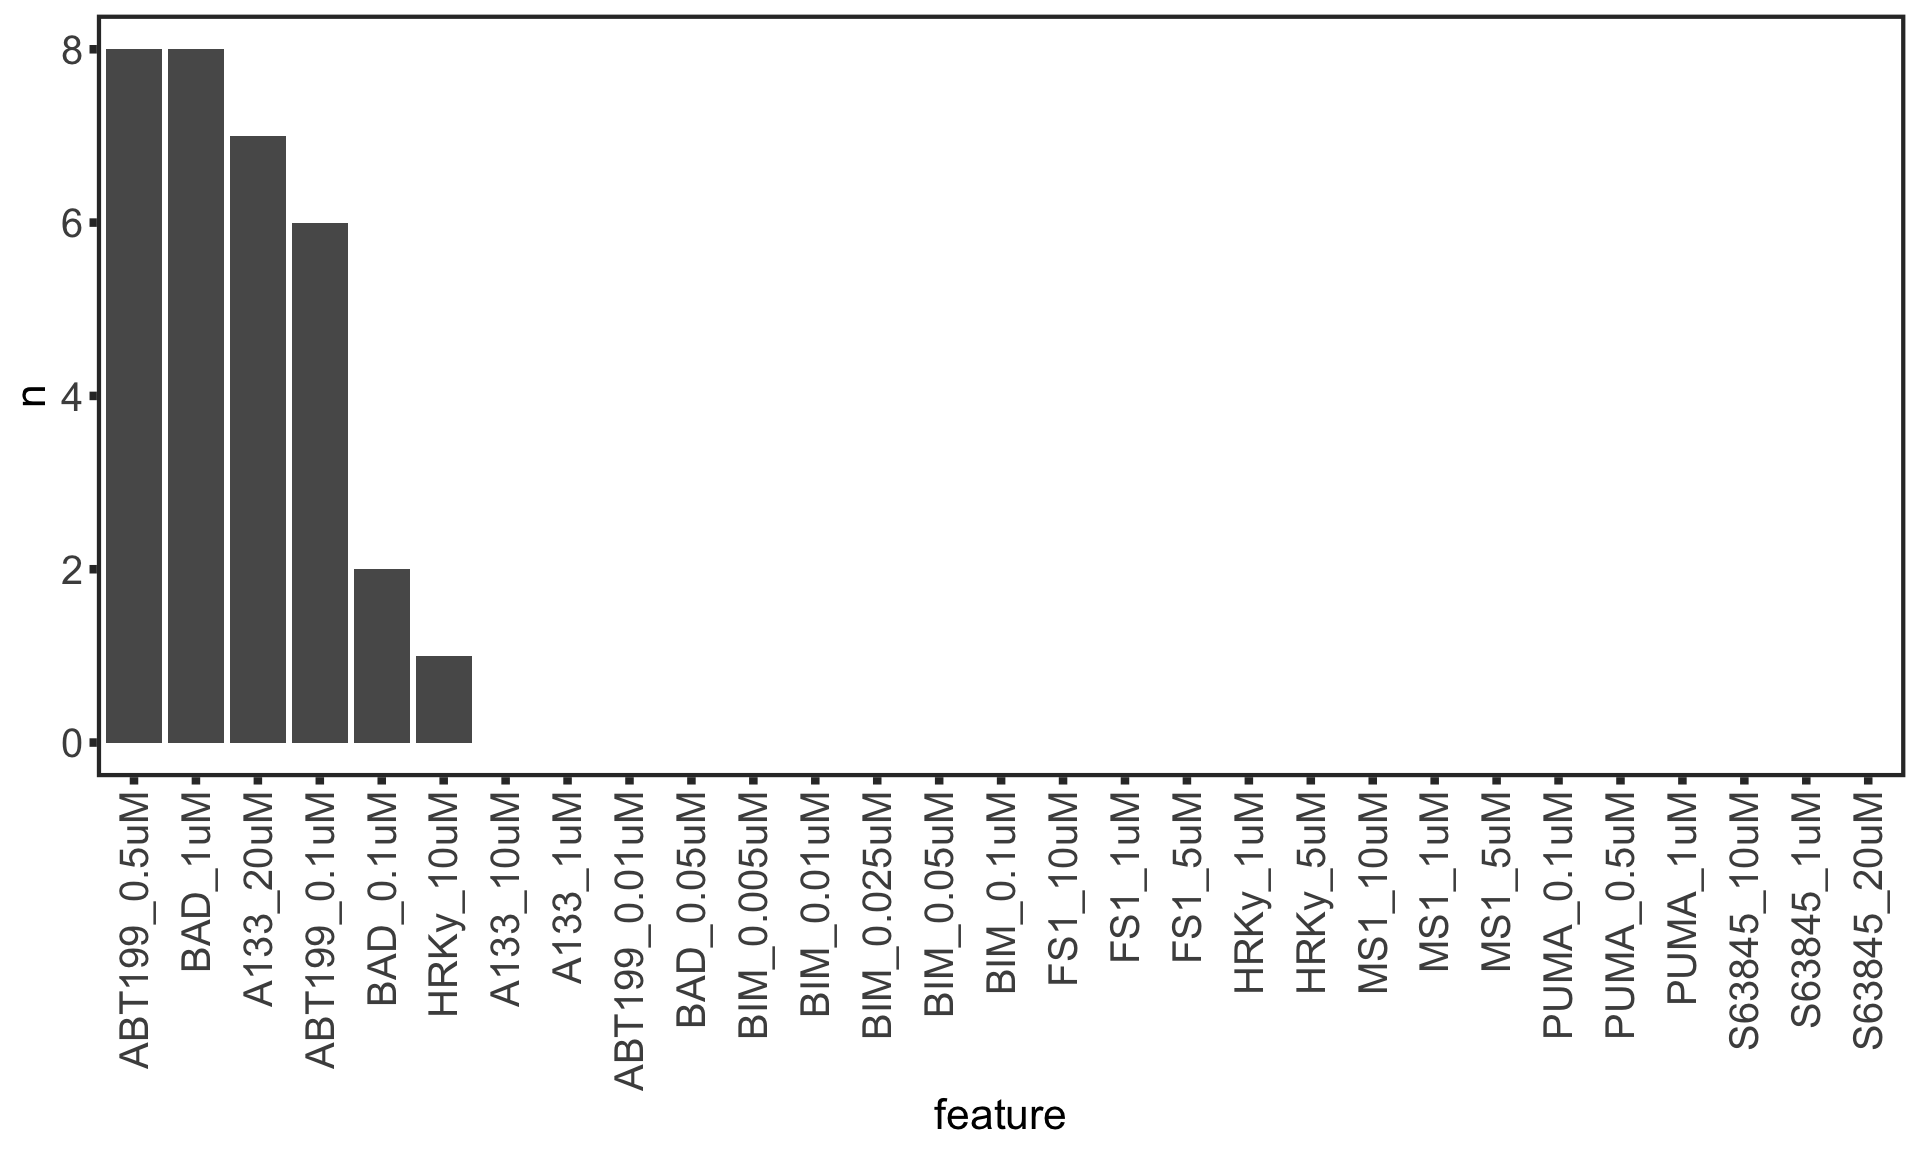
Table of significant associations
Plot top 9 significant associations
Association with spontaneous apoptosis measured by image data
Scatter plots showing significant correlations (5% FDR)
If multiple concentrations are identified as significant, only show the most significant concentration. 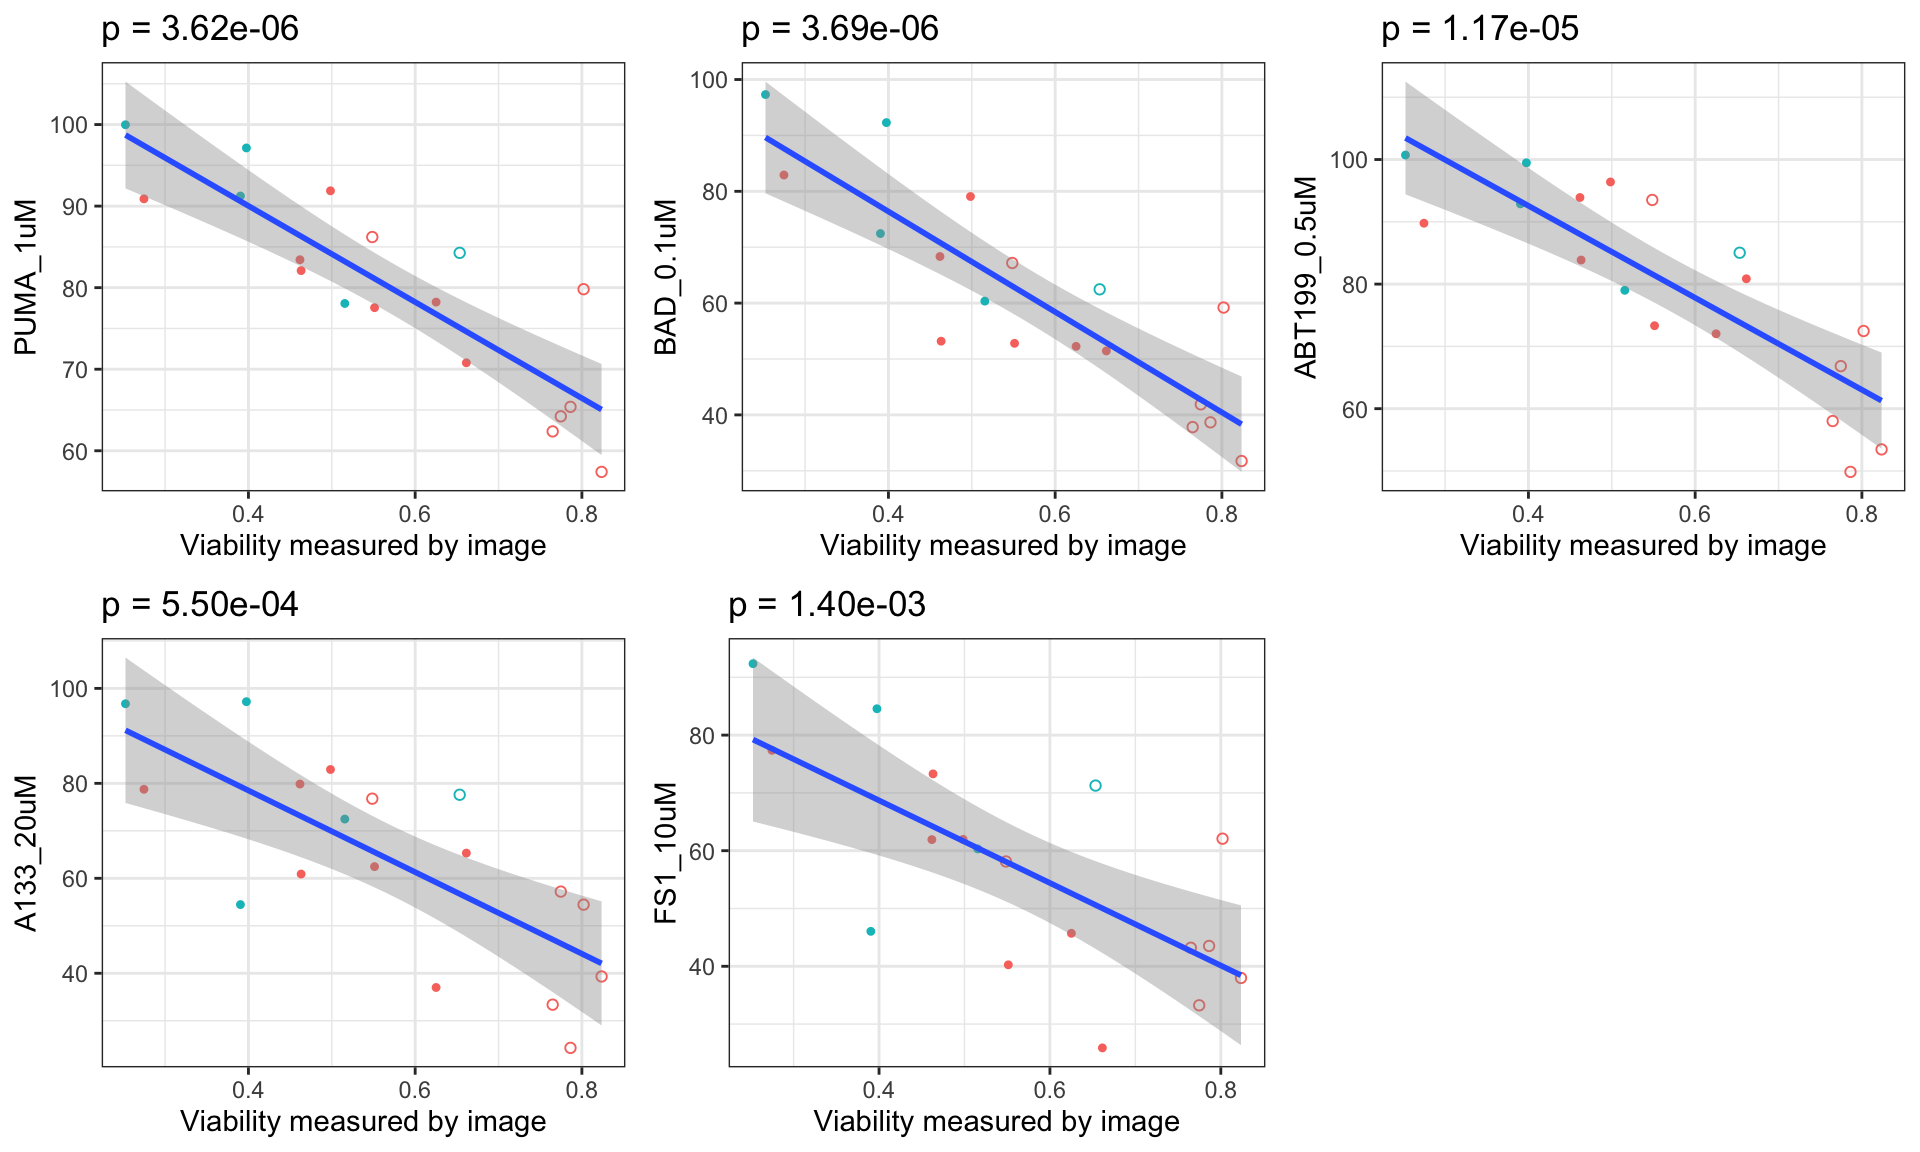
Association between baseline ATP levels of cells and BH3 profile
The baseline ATP levels represent the cell viability without any drug treatment in our screen. There are three features, ATP level at 0 hour, ATP level at 48 hour and the difference of those two values. These measurements can in some degree represent the intrinsic vulnerability/metabolic activity of the cells.
Association test between baseline ATP and BH3 profile
Scatter plots showing significant correlations (5% FDR)
If multiple concentrations are identified as significant, only show the most significant concentration. 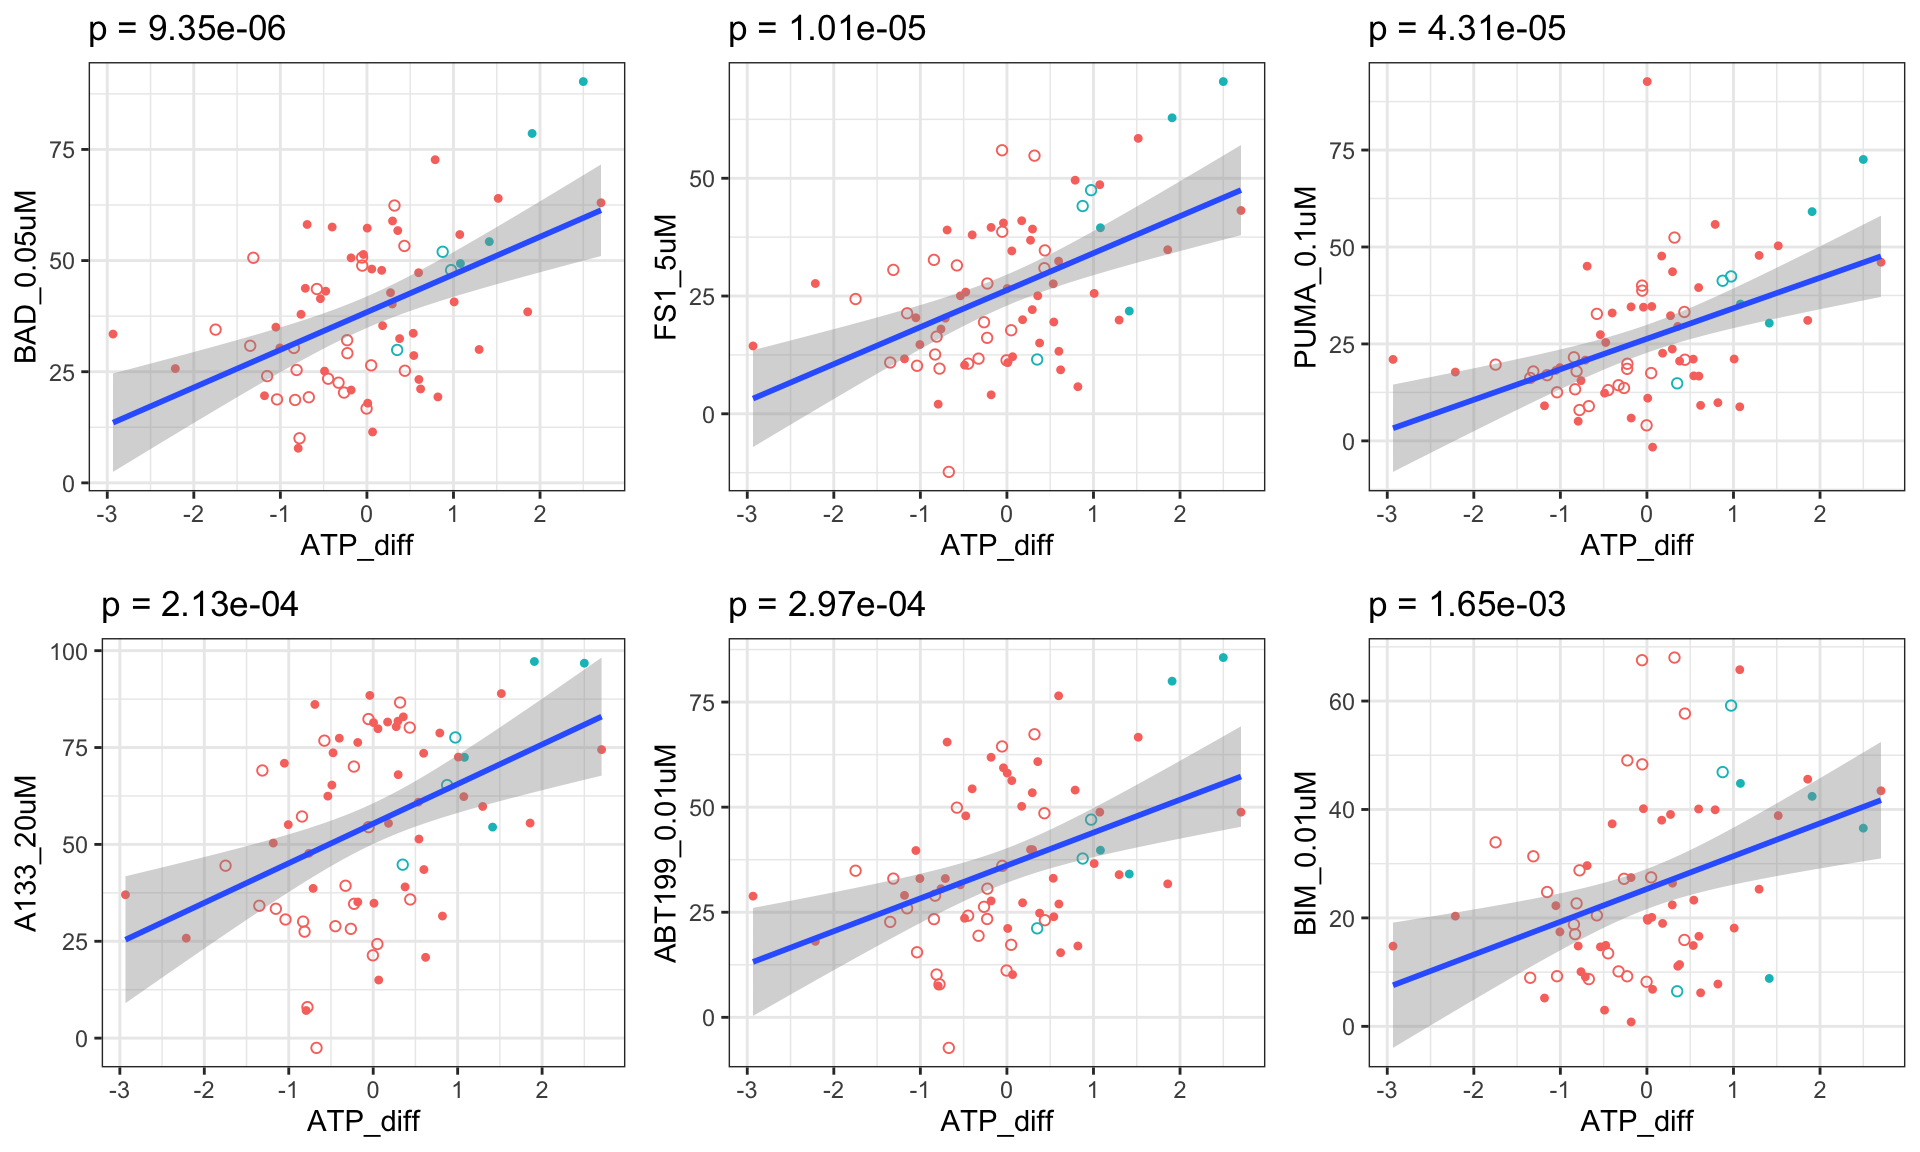 "ATP_diff" is the measurement of ATP loss during 48h culturing
Association between CLL-PD and BH3 profile
CLL-PD is the newly identified biomarker for CLL that potentially correlates with CLL cell proliferation
Scatter plots showing significant correlations (10% FDR)
If multiple concentrations are identified as significant, only show the most significant concentration. 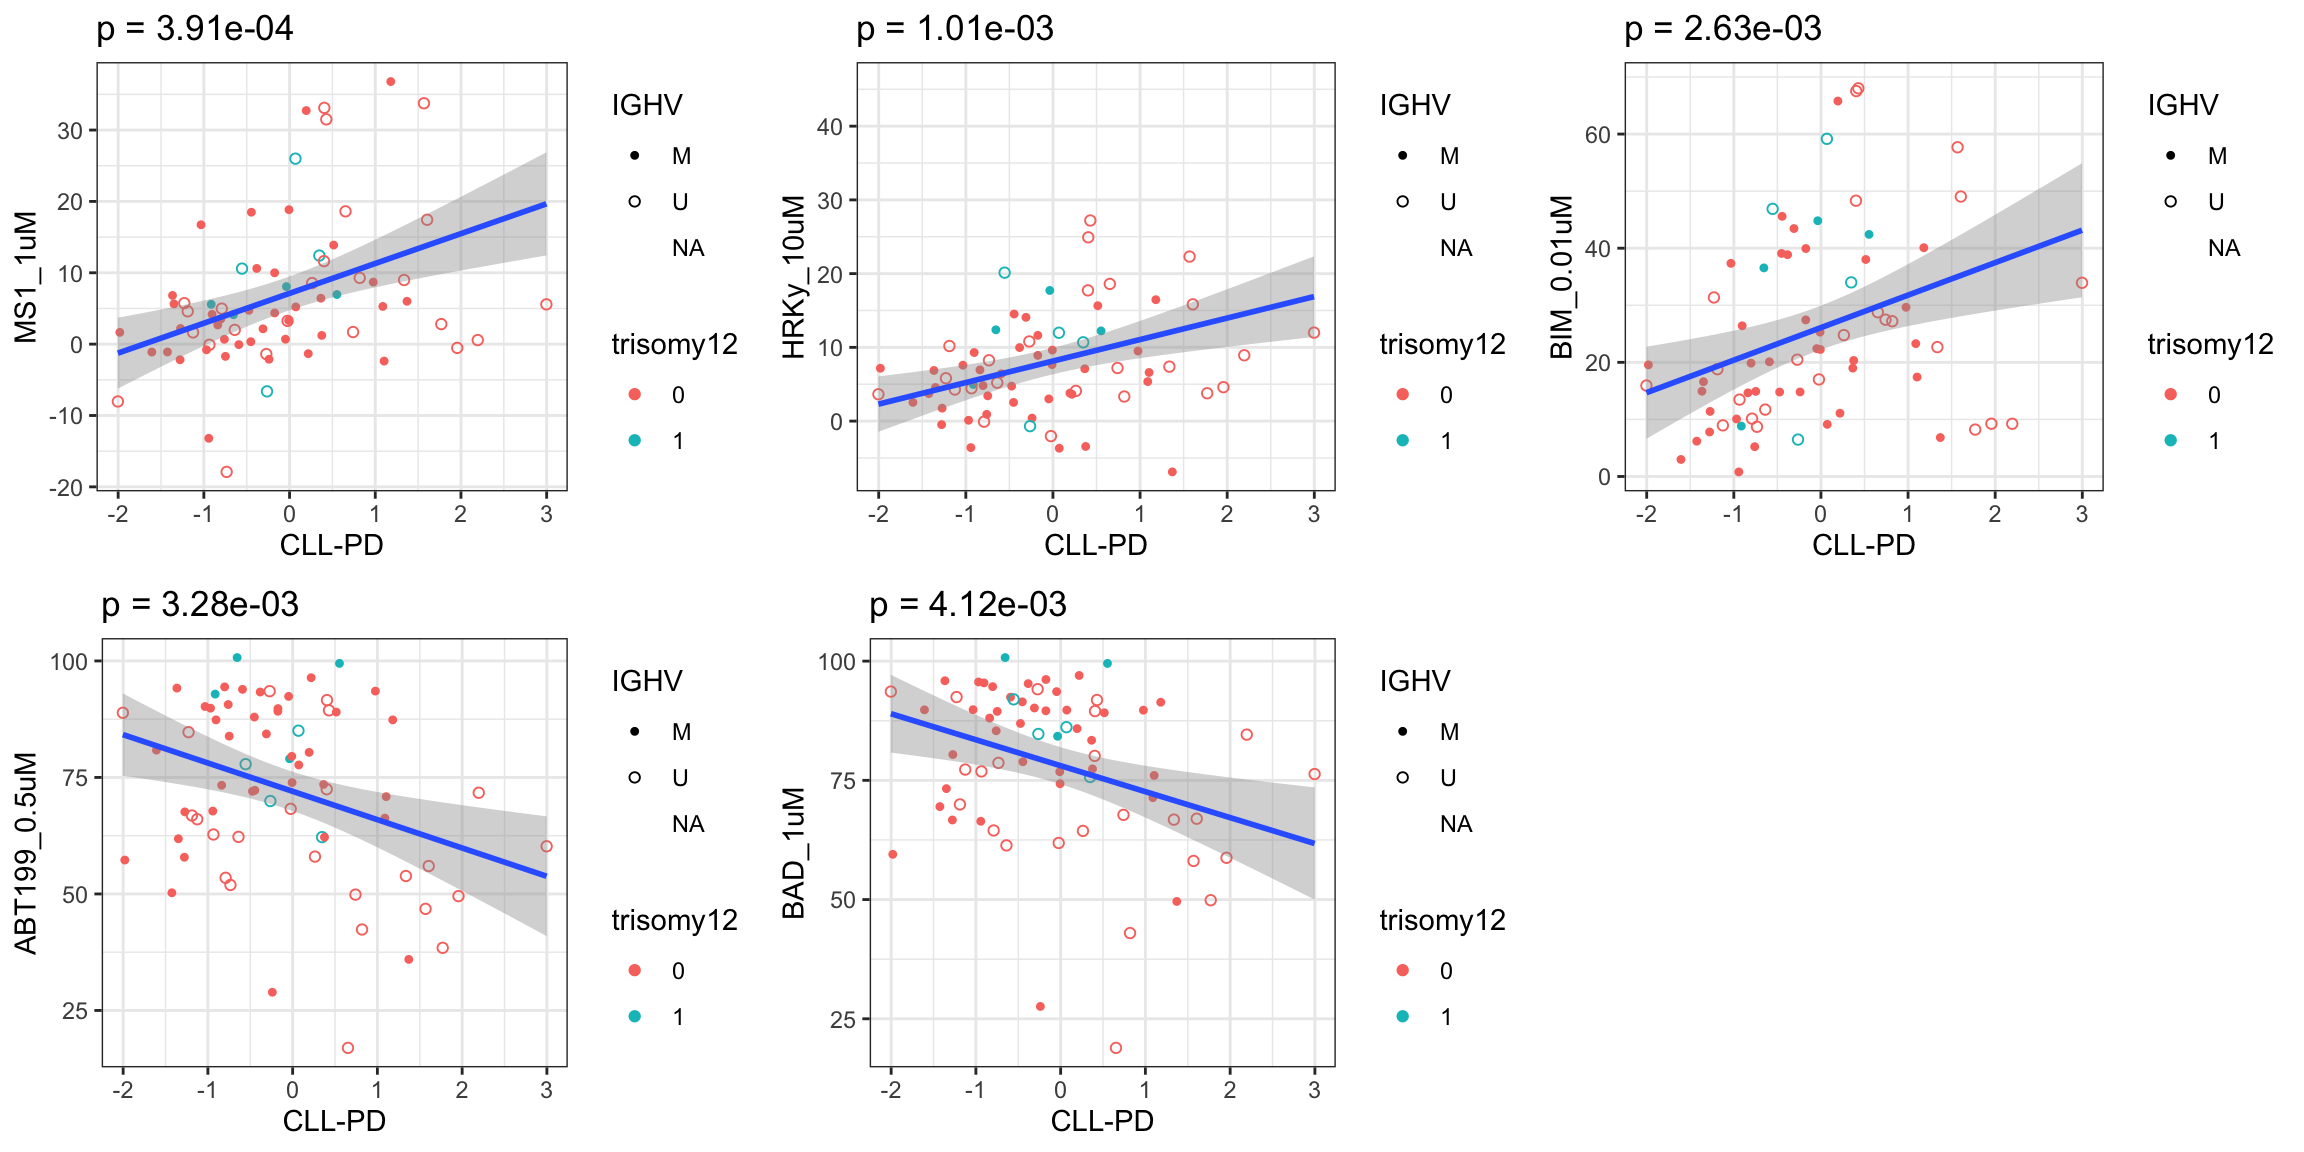
Multivariate feature selection for explaining BH3 profling in CLL
Data pre-processing
BH3 profiling
RNAseq
Methylation
For genomic data
For demographic and clinical data
Function to Generate the explanatory dataset for each BH3 profile
Calulate bioenergetic variance explained by multi-omics data set
Training models
Clean and integrate multi-omics data
Function for multi-variate regression
Perform lasso regression
Ploting results
Function for plotting variance explained for each measurement 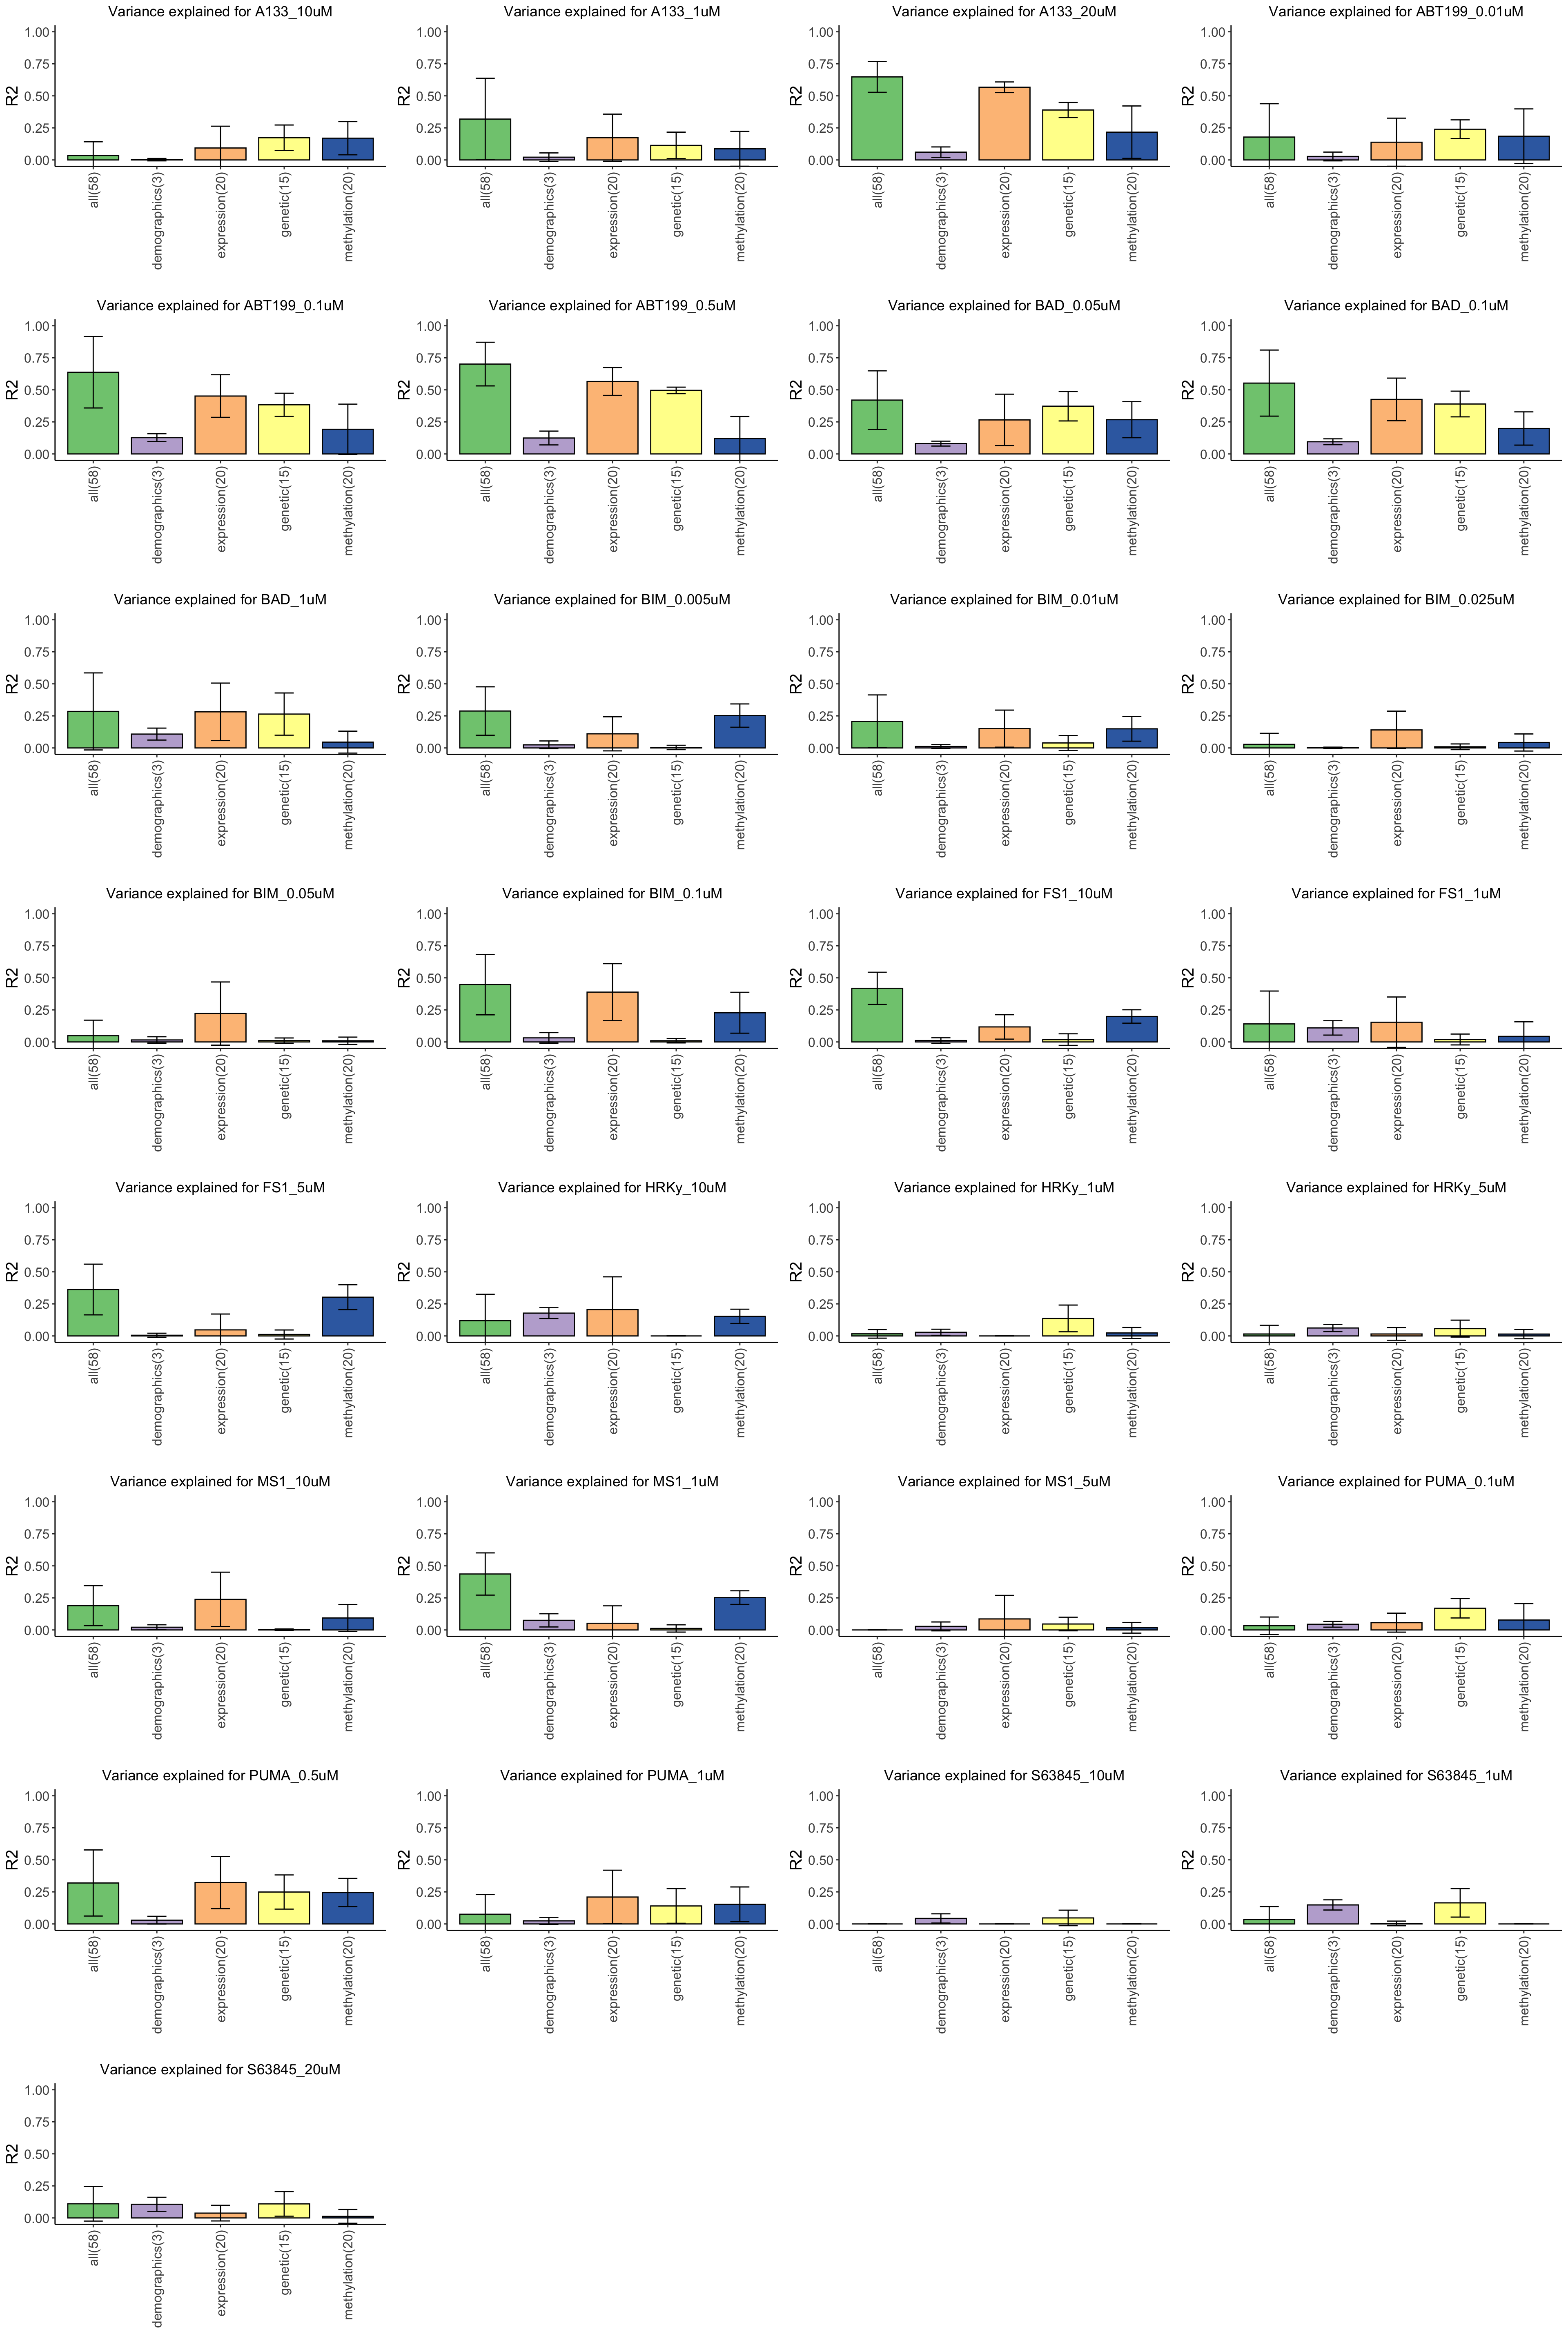
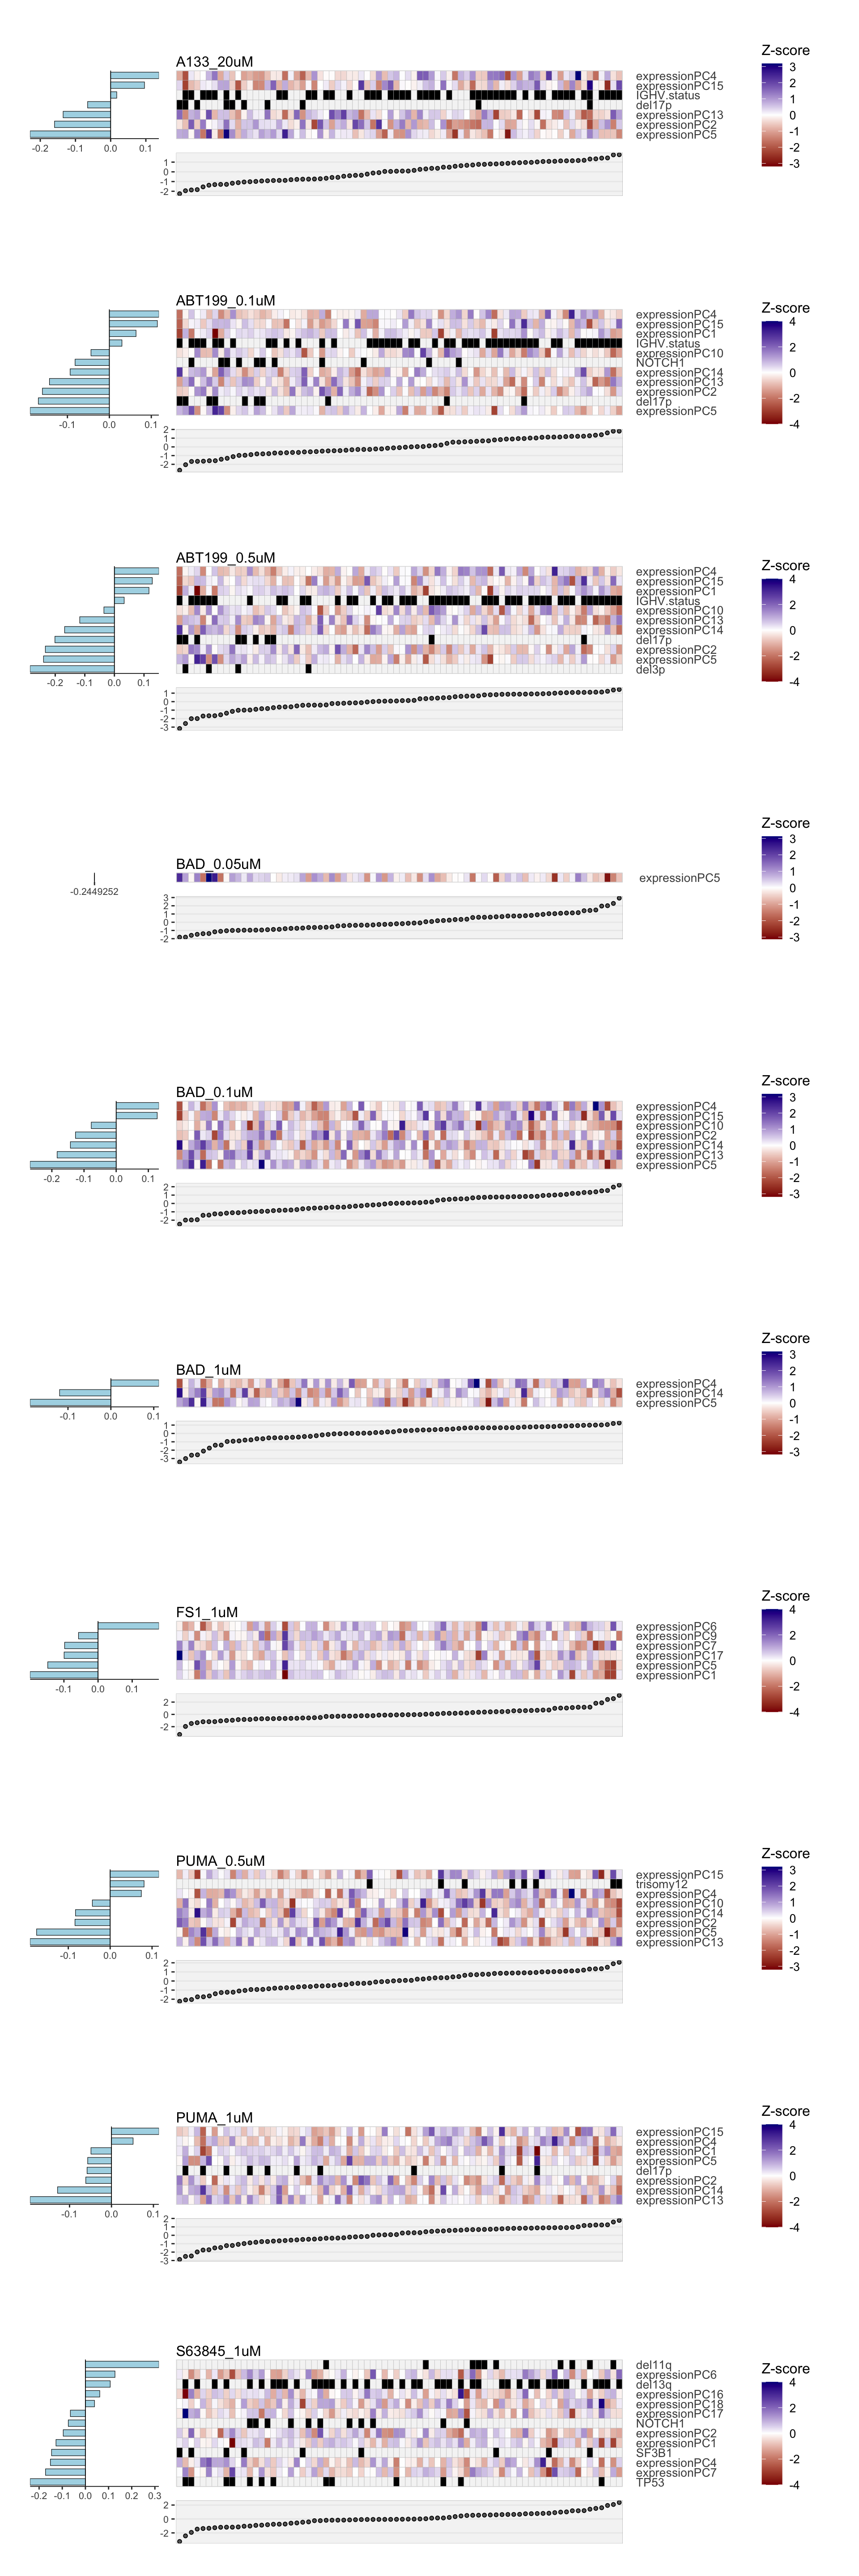
Using LASSO model to select important features
Training models
Prepare clean data for feature selection
Perform lasso regression
Ploting results
Function for the heatmap plot
Plot all heatmaps
R version 3.6.0 (2019-04-26)
Platform: x86_64-apple-darwin15.6.0 (64-bit)
Running under: macOS  10.15.6

Matrix products: default
BLAS:   /Library/Frameworks/R.framework/Versions/3.6/Resources/lib/libRblas.0.dylib
LAPACK: /Library/Frameworks/R.framework/Versions/3.6/Resources/lib/libRlapack.dylib

locale:
[1] en_US.UTF-8/en_US.UTF-8/en_US.UTF-8/C/en_US.UTF-8/en_US.UTF-8

attached base packages:
[1] parallel  stats4    stats     graphics  grDevices utils     datasets
[8] methods   base

other attached packages:
 [1] gtable_0.3.0                glmnet_4.0-2
 [3] Matrix_1.2-18               DESeq2_1.26.0
 [5] latex2exp_0.4.0             forcats_0.5.0
 [7] stringr_1.4.0               dplyr_1.0.0
 [9] purrr_0.3.4                 readr_1.3.1
[11] tidyr_1.1.0                 tibble_3.0.3
[13] ggplot2_3.3.2               tidyverse_1.3.0
[15] SummarizedExperiment_1.16.1 DelayedArray_0.12.3
[17] BiocParallel_1.20.1         matrixStats_0.56.0
[19] Biobase_2.46.0              GenomicRanges_1.38.0
[21] GenomeInfoDb_1.22.1         IRanges_2.20.2
[23] S4Vectors_0.24.4            BiocGenerics_0.32.0
[25] IHW_1.14.0                  limma_3.42.2
[27] pheatmap_1.0.12             cowplot_1.0.0
[29] corrplot_0.84               qgraph_1.6.5
[31] jyluMisc_0.1.5

loaded via a namespace (and not attached):
  [1] utf8_1.1.4             shinydashboard_0.7.1   tidyselect_1.1.0
  [4] RSQLite_2.2.0          AnnotationDbi_1.48.0   htmlwidgets_1.5.1
  [7] grid_3.6.0             maxstat_0.7-25         munsell_0.5.0
 [10] codetools_0.2-16       DT_0.14                withr_2.2.0
 [13] colorspace_1.4-1       knitr_1.29             rstudioapi_0.11
 [16] ggsignif_0.6.0         labeling_0.3           huge_1.3.4.1
 [19] git2r_0.27.1           slam_0.1-47            GenomeInfoDbData_1.2.2
 [22] lpsymphony_1.14.0      mnormt_1.5-5           KMsurv_0.1-5
 [25] bit64_0.9-7            farver_2.0.3           rprojroot_1.3-2
 [28] vctrs_0.3.1            generics_0.0.2         TH.data_1.0-10
 [31] xfun_0.15              sets_1.0-18            R6_2.4.1
 [34] locfit_1.5-9.4         bitops_1.0-6           fgsea_1.12.0
 [37] assertthat_0.2.1       promises_1.1.1         scales_1.1.1
 [40] multcomp_1.4-13        nnet_7.3-14            sandwich_2.5-1
 [43] workflowr_1.6.2        rlang_0.4.7            genefilter_1.68.0
 [46] splines_3.6.0          rstatix_0.6.0          acepack_1.4.1
 [49] broom_0.7.0            checkmate_2.0.0        yaml_2.2.1
 [52] reshape2_1.4.4         abind_1.4-5            modelr_0.1.8
 [55] crosstalk_1.1.0.1      d3Network_0.5.2.1      backports_1.1.8
 [58] httpuv_1.5.4           Hmisc_4.4-0            tools_3.6.0
 [61] relations_0.6-9        psych_1.9.12.31        lavaan_0.6-6
 [64] ellipsis_0.3.1         gplots_3.0.4           RColorBrewer_1.1-2
 [67] Rcpp_1.0.5             plyr_1.8.6             base64enc_0.1-3
 [70] visNetwork_2.0.9       zlibbioc_1.32.0        RCurl_1.98-1.2
 [73] ggpubr_0.4.0           rpart_4.1-15           pbapply_1.4-2
 [76] zoo_1.8-8              haven_2.3.1            cluster_2.1.0
 [79] exactRankTests_0.8-31  fs_1.4.2               magrittr_1.5
 [82] data.table_1.12.8      openxlsx_4.1.5         reprex_0.3.0
 [85] survminer_0.4.7        mvtnorm_1.1-1          whisker_0.4
 [88] hms_0.5.3              shinyjs_1.1            mime_0.9
 [91] evaluate_0.14          xtable_1.8-4           XML_3.98-1.20
 [94] rio_0.5.16             jpeg_0.1-8.1           readxl_1.3.1
 [97] shape_1.4.4            gridExtra_2.3          compiler_3.6.0
[100] KernSmooth_2.23-17     crayon_1.3.4           htmltools_0.5.0
[103] mgcv_1.8-31            corpcor_1.6.9          later_1.1.0.1
[106] Formula_1.2-3          geneplotter_1.64.0     lubridate_1.7.9
[109] DBI_1.1.0              dbplyr_1.4.4           MASS_7.3-51.6
[112] car_3.0-8              cli_2.0.2              marray_1.64.0
[115] gdata_2.18.0           igraph_1.2.5           BDgraph_2.62
[118] pkgconfig_2.0.3        km.ci_0.5-2            foreign_0.8-71
[121] piano_2.2.0            foreach_1.5.0          xml2_1.3.2
[124] annotate_1.64.0        pbivnorm_0.6.0         XVector_0.26.0
[127] drc_3.0-1              rvest_0.3.5            digest_0.6.25
[130] rmarkdown_2.3          cellranger_1.1.0       fastmatch_1.1-0
[133] survMisc_0.5.5         htmlTable_2.0.1        curl_4.3
[136] shiny_1.5.0            gtools_3.8.2           rjson_0.2.20
[139] lifecycle_0.2.0        nlme_3.1-148           glasso_1.11
[142] jsonlite_1.7.0         carData_3.0-4          fansi_0.4.1
[145] pillar_1.4.6           lattice_0.20-41        fastmap_1.0.1
[148] httr_1.4.1             plotrix_3.7-8          survival_3.2-3
[151] glue_1.4.1             zip_2.0.4              fdrtool_1.2.15
[154] iterators_1.0.12       png_0.1-7              bit_1.1-15.2
[157] stringi_1.4.6          blob_1.2.1             memoise_1.1.0
[160] latticeExtra_0.6-29    caTools_1.18.0