Overview of BH3 profile
Junyan Lu
2020 Sept. 3
Last updated: 2022-07-06
Checks: 6 1
Knit directory: BH3profiling/analysis/
This reproducible R Markdown analysis was created with workflowr (version 1.7.0). The Checks tab describes the reproducibility checks that were applied when the results were created. The Past versions tab lists the development history.
The R Markdown is untracked by Git. To know which version of the R
Markdown file created these results, you’ll want to first commit it to
the Git repo. If you’re still working on the analysis, you can ignore
this warning. When you’re finished, you can run
wflow_publish to commit the R Markdown file and build the
HTML.
Great job! The global environment was empty. Objects defined in the global environment can affect the analysis in your R Markdown file in unknown ways. For reproduciblity it’s best to always run the code in an empty environment.
The command set.seed(20200826) was run prior to running
the code in the R Markdown file. Setting a seed ensures that any results
that rely on randomness, e.g. subsampling or permutations, are
reproducible.
Great job! Recording the operating system, R version, and package versions is critical for reproducibility.
Nice! There were no cached chunks for this analysis, so you can be confident that you successfully produced the results during this run.
Great job! Using relative paths to the files within your workflowr project makes it easier to run your code on other machines.
Great! You are using Git for version control. Tracking code development and connecting the code version to the results is critical for reproducibility.
The results in this page were generated with repository version 90ada8f. See the Past versions tab to see a history of the changes made to the R Markdown and HTML files.
Note that you need to be careful to ensure that all relevant files for
the analysis have been committed to Git prior to generating the results
(you can use wflow_publish or
wflow_git_commit). workflowr only checks the R Markdown
file, but you know if there are other scripts or data files that it
depends on. Below is the status of the Git repository when the results
were generated:
Ignored files:
    Ignored:    .DS_Store
    Ignored:    .Rhistory
    Ignored:    .Rproj.user/
    Ignored:    analysis/.DS_Store
    Ignored:    analysis/.Rhistory
    Ignored:    analysis/manuscript_drugResponses_cache/
    Ignored:    data/.DS_Store
    Ignored:    data/.Rapp.history
    Ignored:    output/.DS_Store

Untracked files:
    Untracked:  analysis/Annexin_rawInput.Rmd
    Untracked:  analysis/BH3_PCA.csv
    Untracked:  analysis/BH3baseline_analysis_fromBase.Rmd
    Untracked:  analysis/BH3baseline_analysis_fromDBP.Rmd
    Untracked:  analysis/BH3baseline_rawInput.Rmd
    Untracked:  analysis/BH3dynamic_rawInput.Rmd
    Untracked:  analysis/analysisVenetoclax.Rmd
    Untracked:  analysis/based_pep_var.pdf
    Untracked:  analysis/clinialTrial_analysis.Rmd
    Untracked:  analysis/compareBaseline.Rmd
    Untracked:  analysis/compareBaseline.pdf
    Untracked:  analysis/deprecated/
    Untracked:  analysis/drugResponse_baseBH3_analysis.Rmd
    Untracked:  analysis/drugResponse_baseBH3_analysis_AUC copy.Rmd
    Untracked:  analysis/drugResponse_baseBH3_analysis_AUC.Rmd
    Untracked:  analysis/dynamicBH3_analysis.Rmd
    Untracked:  analysis/dynamicBH3_analysis_AUC.Rmd
    Untracked:  analysis/landscape_baseBH3_analysis.Rmd
    Untracked:  analysis/landscape_baseBH3_analysis_AUC.Rmd
    Untracked:  analysis/landscape_baseBH3_fromBase_analysis_AUC.Rmd
    Untracked:  analysis/manuscript_clinicalAnalysis.Rmd
    Untracked:  analysis/manuscript_drugResponses.Rmd
    Untracked:  analysis/manuscript_dynamicBH3.Rmd
    Untracked:  analysis/manuscript_dynamicBH3_old.Rmd
    Untracked:  analysis/manuscript_overview.Rmd
    Untracked:  analysis/manuscript_overview_fromBaseBH3.Rmd
    Untracked:  analysis/manuscript_overview_singleConc.Rmd
    Untracked:  analysis/outcome_baseBH3_analysis.Rmd
    Untracked:  analysis/outcome_baseBH3_analysis_AUC.Rmd
    Untracked:  analysis/patBack.csv
    Untracked:  analysis/platePlot.pdf
    Untracked:  analysis/platePlot_dynamic.pdf
    Untracked:  analysis/predictOutcomes.Rmd
    Untracked:  analysis/pretreatment_effect_estiamtion.csv
    Untracked:  analysis/tableS1_sampleSummary.csv
    Untracked:  analysis/venePair_auc.pdf
    Untracked:  analysis/venePair_auc_norm.pdf
    Untracked:  analysis/venePair_auc_raw.pdf
    Untracked:  analysis/venePair_con.pdf
    Untracked:  analysis/venePair_conc_unorm.pdf
    Untracked:  code/utils.R
    Untracked:  data/13092020 Patient Outcome Analysis - IBR plus FCR - for Junyan.xlsx
    Untracked:  data/Data for Thorsten .xlsx
    Untracked:  data/Raw data Baseline for Junyan.xlsx
    Untracked:  data/Raw data DBP for Junyan.xlsx
    Untracked:  data/T. Zenz data for Junyan.xlsx
    Untracked:  data/Zenz Project overview cell counts etc.xlsx
    Untracked:  data/commonFiles/
    Untracked:  data/venetoclax_coculture.rds
    Untracked:  figures/
    Untracked:  manuscript/
    Untracked:  output/baseBH3.RData
    Untracked:  output/dataAnnexin.RData
    Untracked:  output/dynamicBH3.RData

Unstaged changes:
    Modified:   _workflowr.yml
    Modified:   analysis/_site.yml
    Deleted:    analysis/about.Rmd
    Modified:   analysis/index.Rmd
    Deleted:    analysis/license.Rmd
Note that any generated files, e.g. HTML, png, CSS, etc., are not included in this status report because it is ok for generated content to have uncommitted changes.
There are no past versions. Publish this analysis with
wflow_publish() to start tracking its development.
Load and preprocess BH3 profiling data
Load
Use baseline level from DBP profiling
Prepare sample background annotations
Save a table of patient information
Data structure
Data dimension
Number of samples
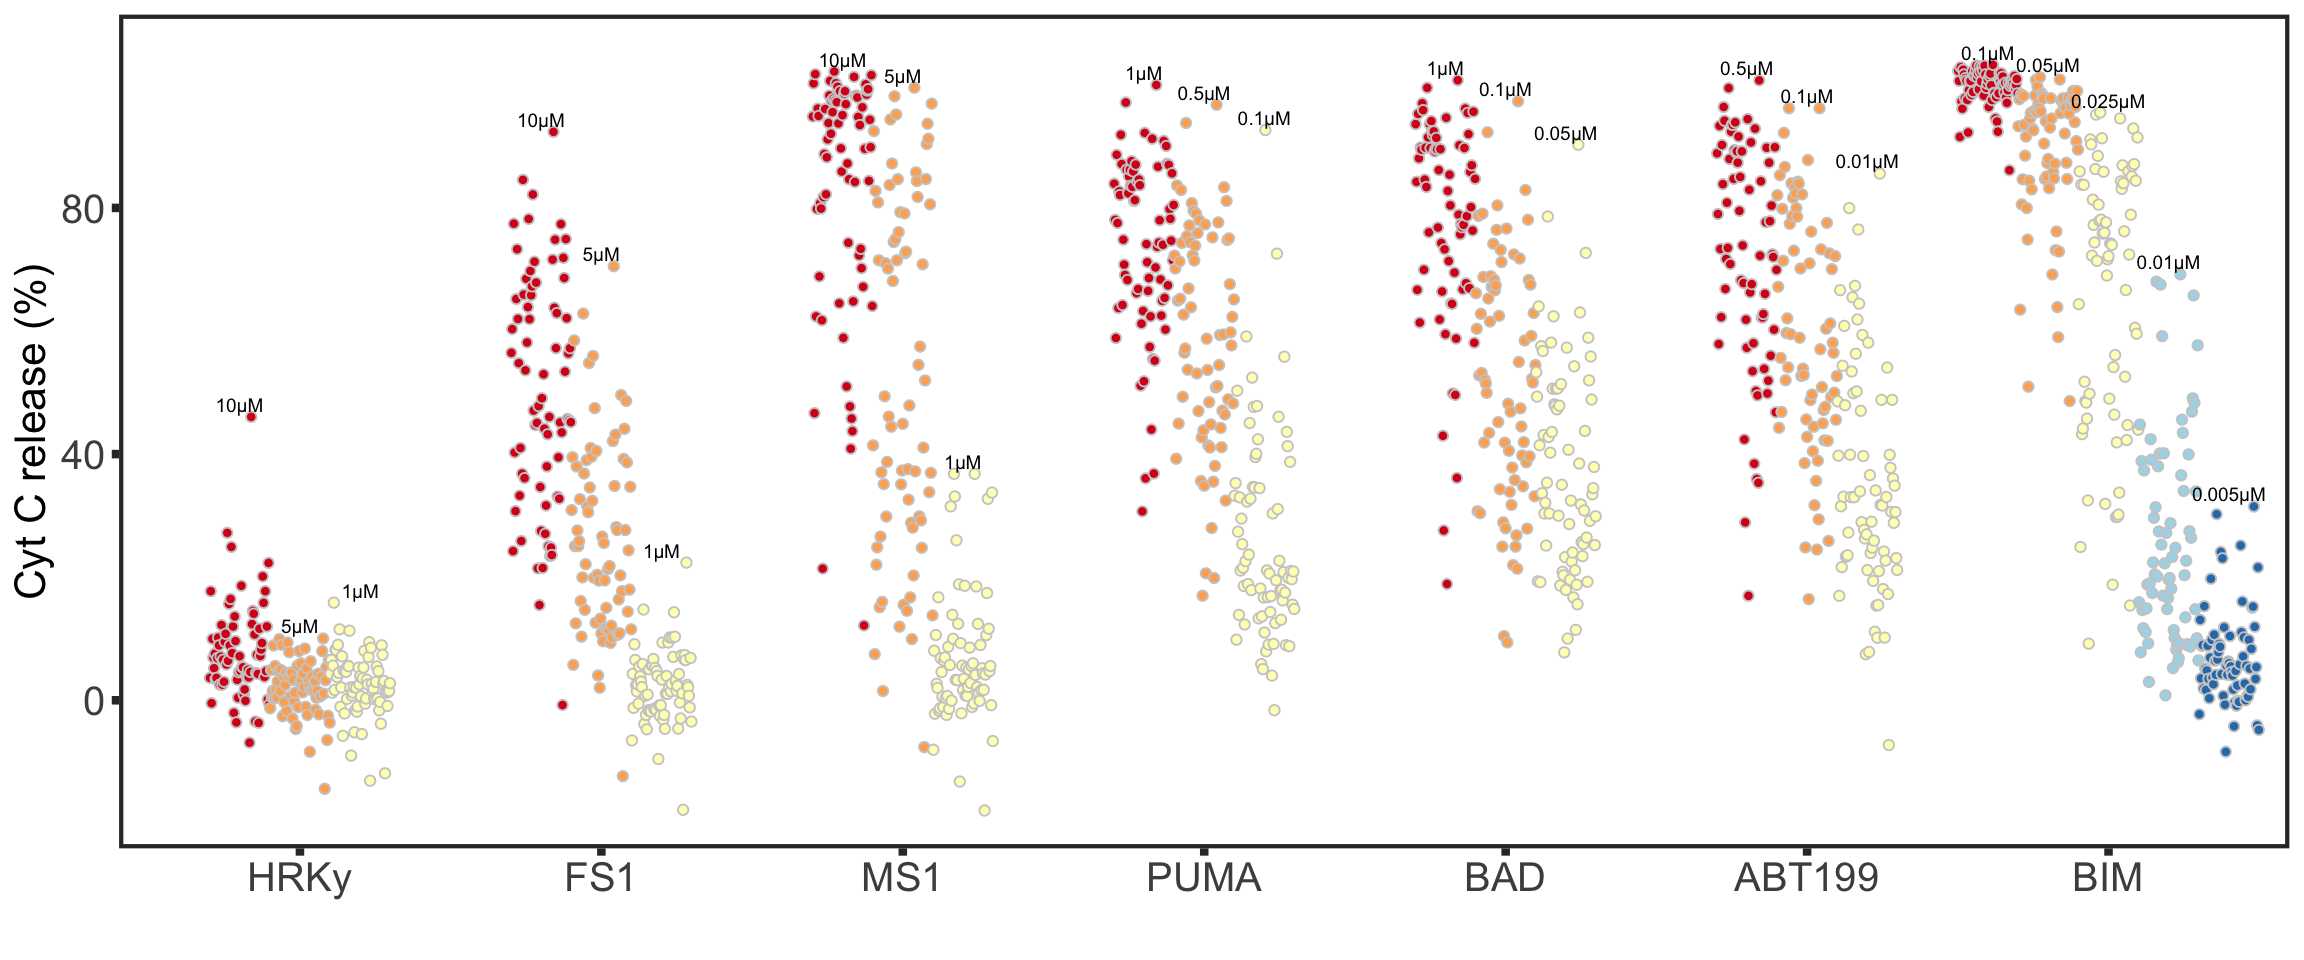
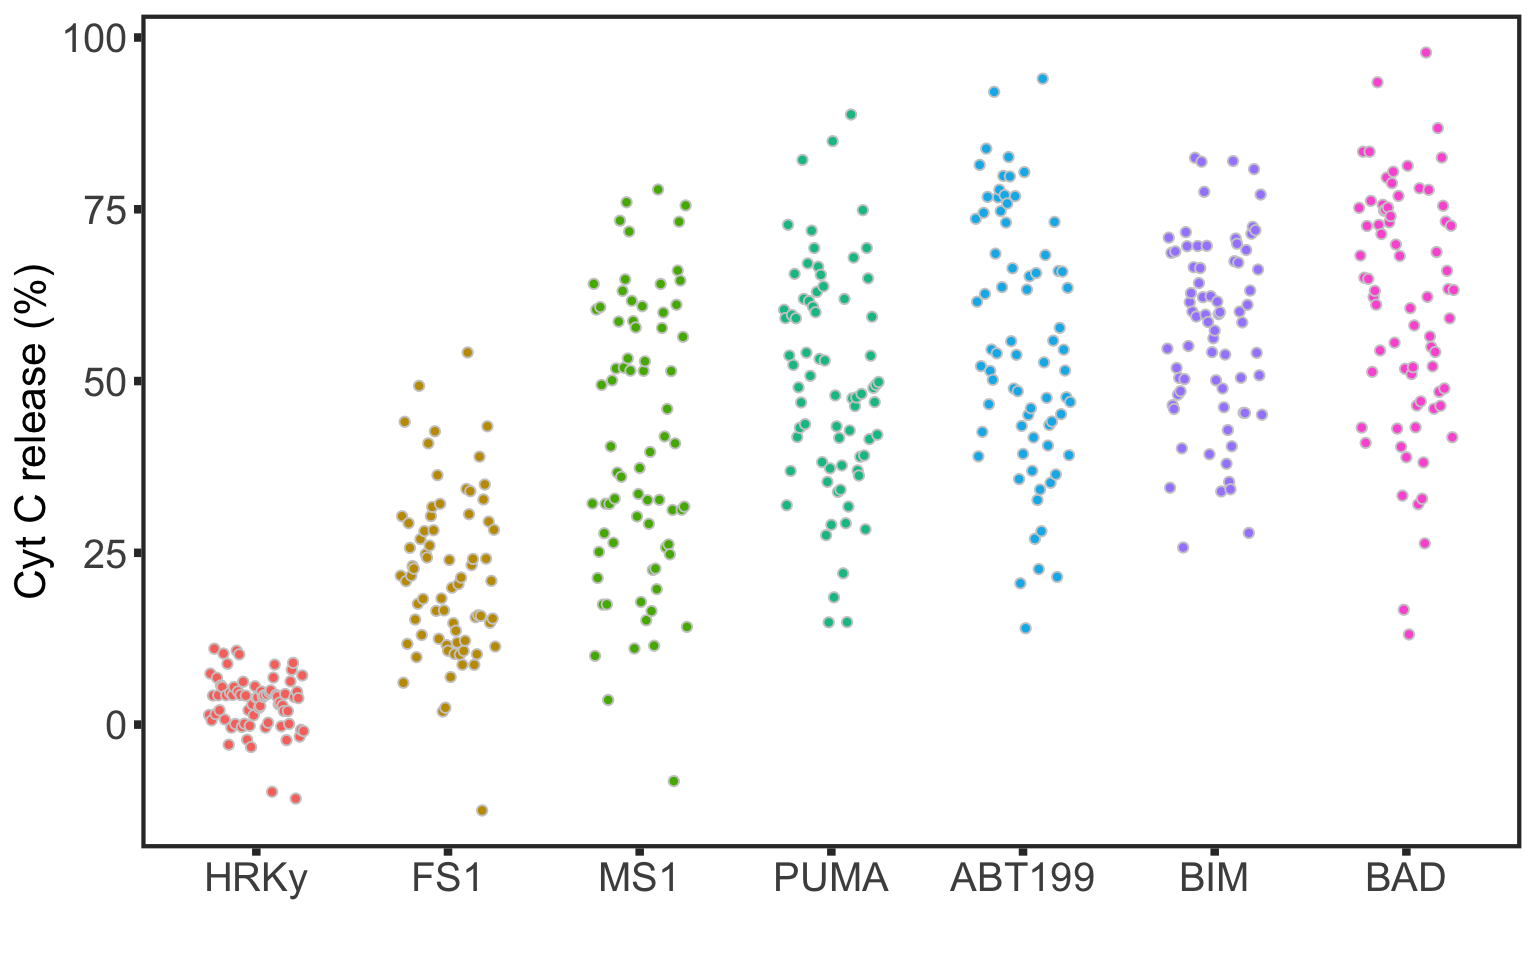
[1] 73Overview of CytC release data
For each concentration
For AUC
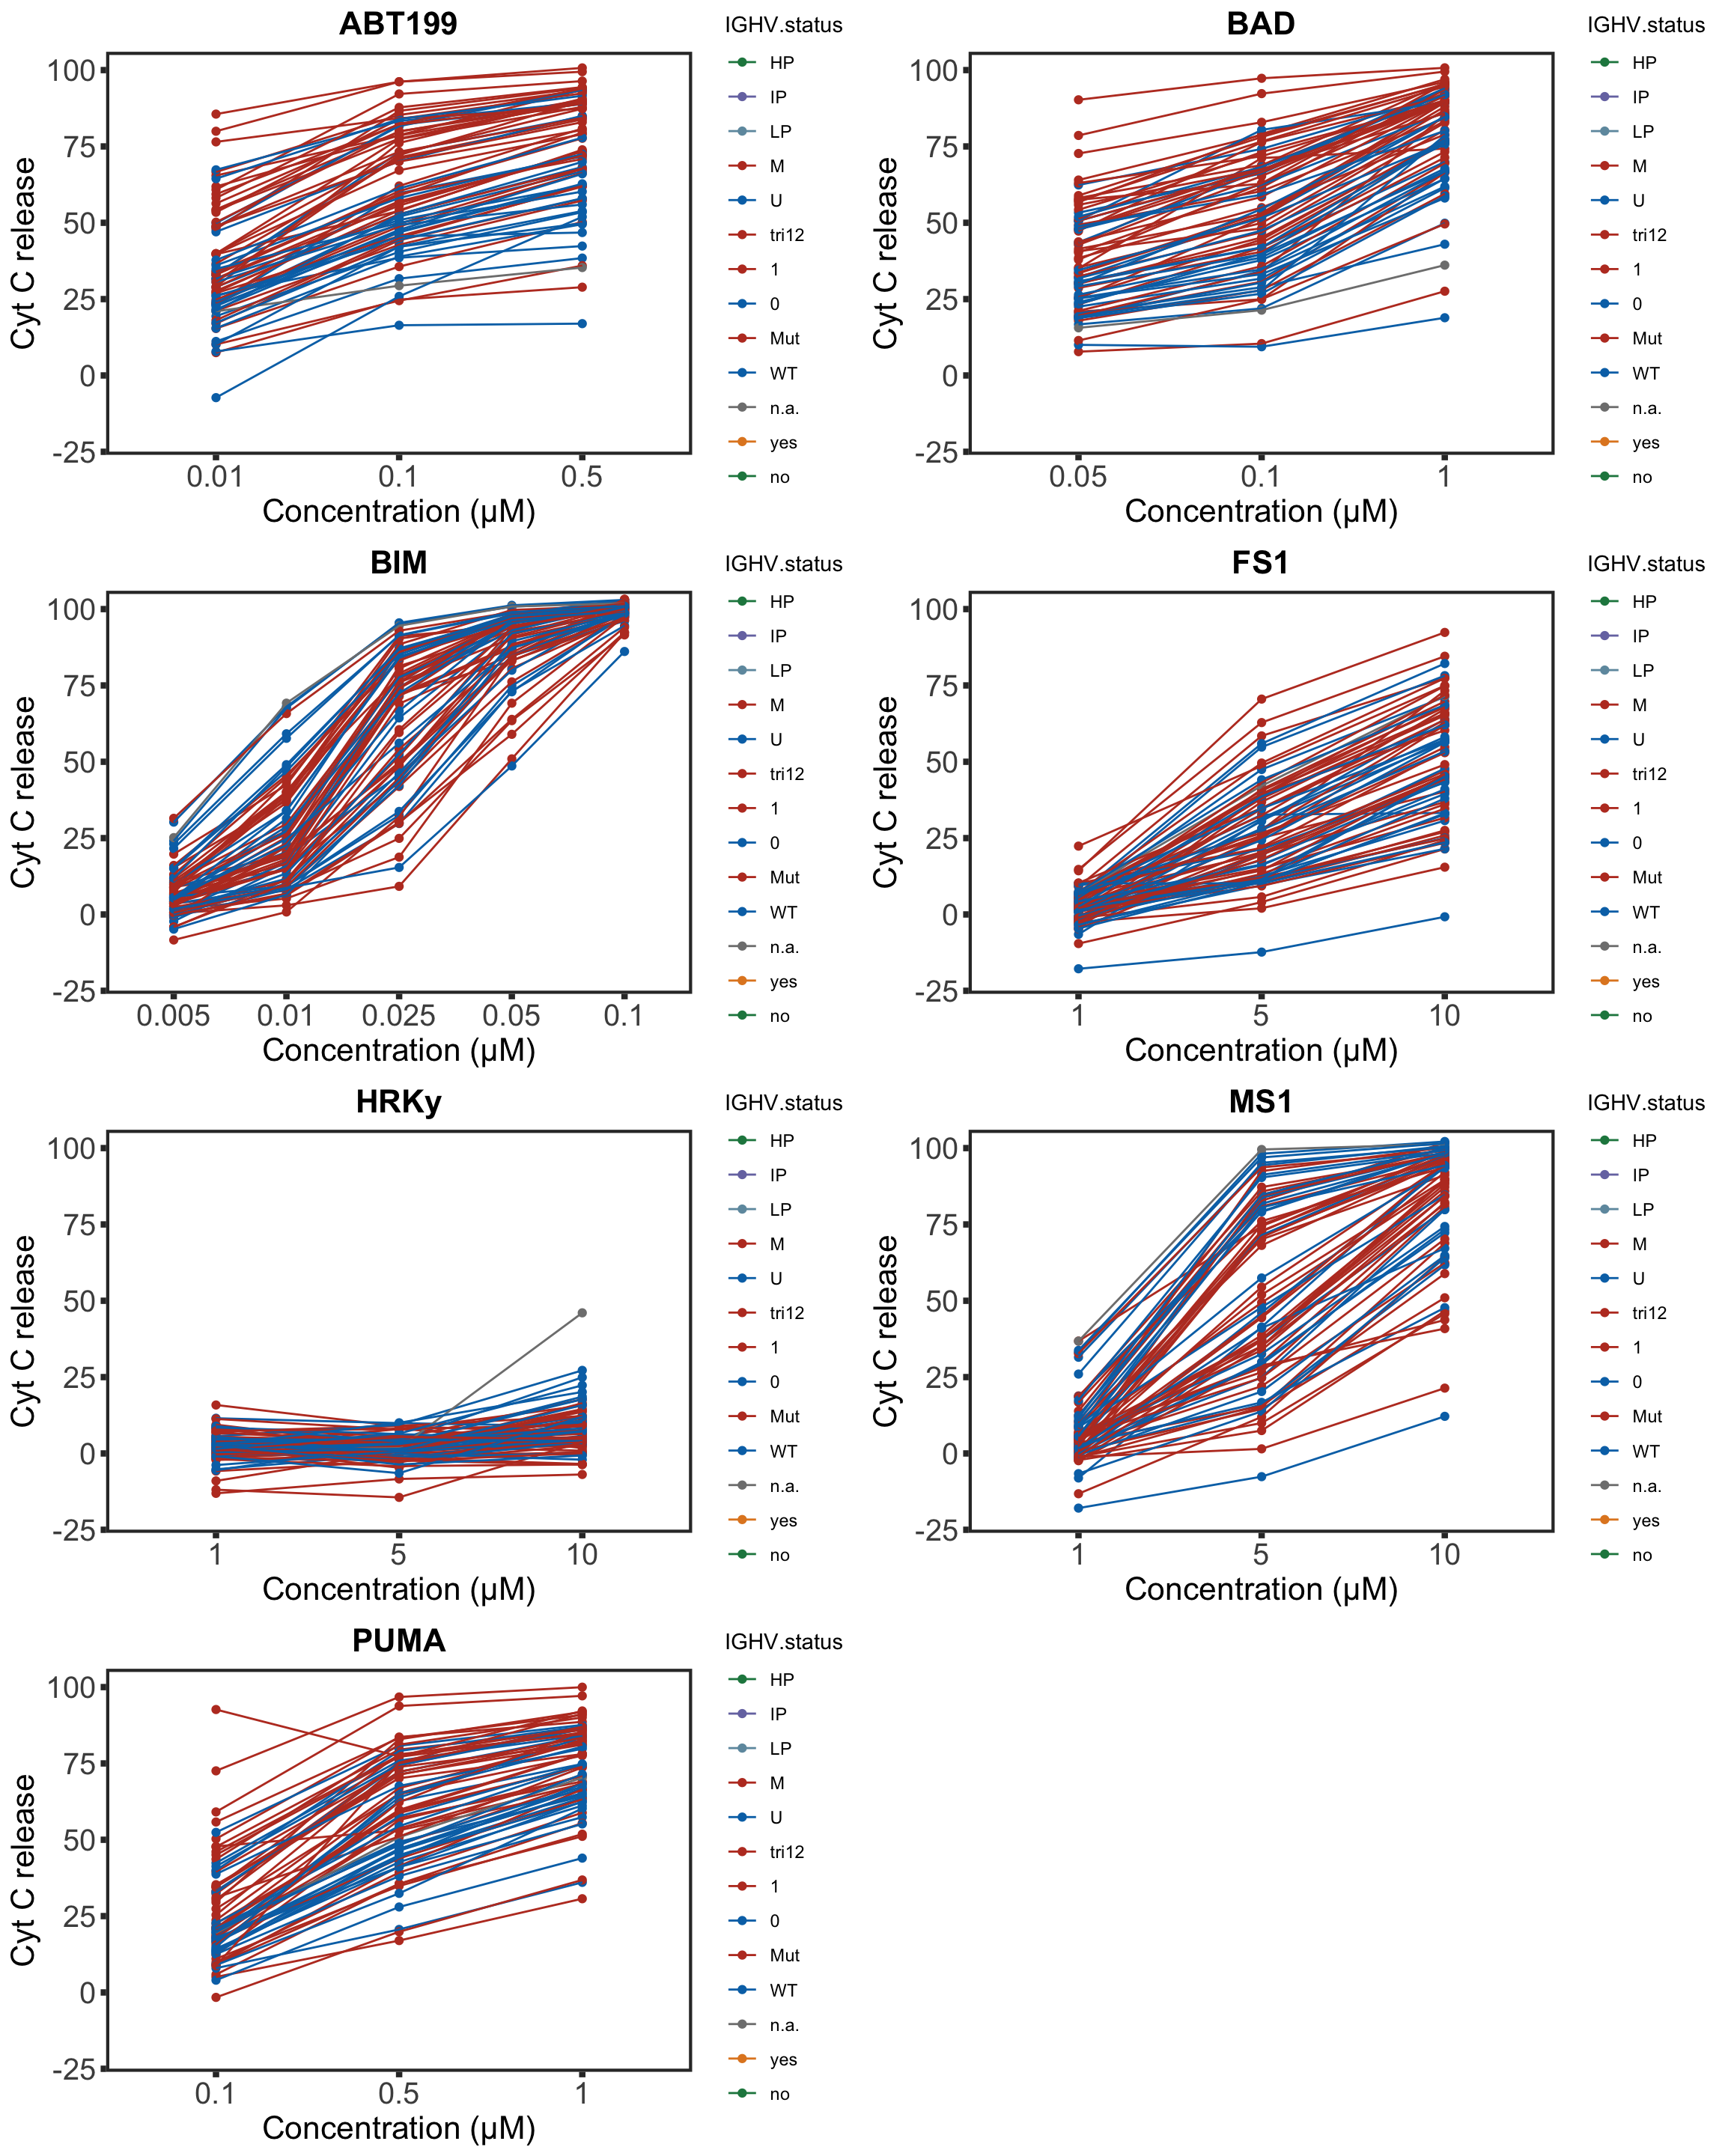
Dose response curves
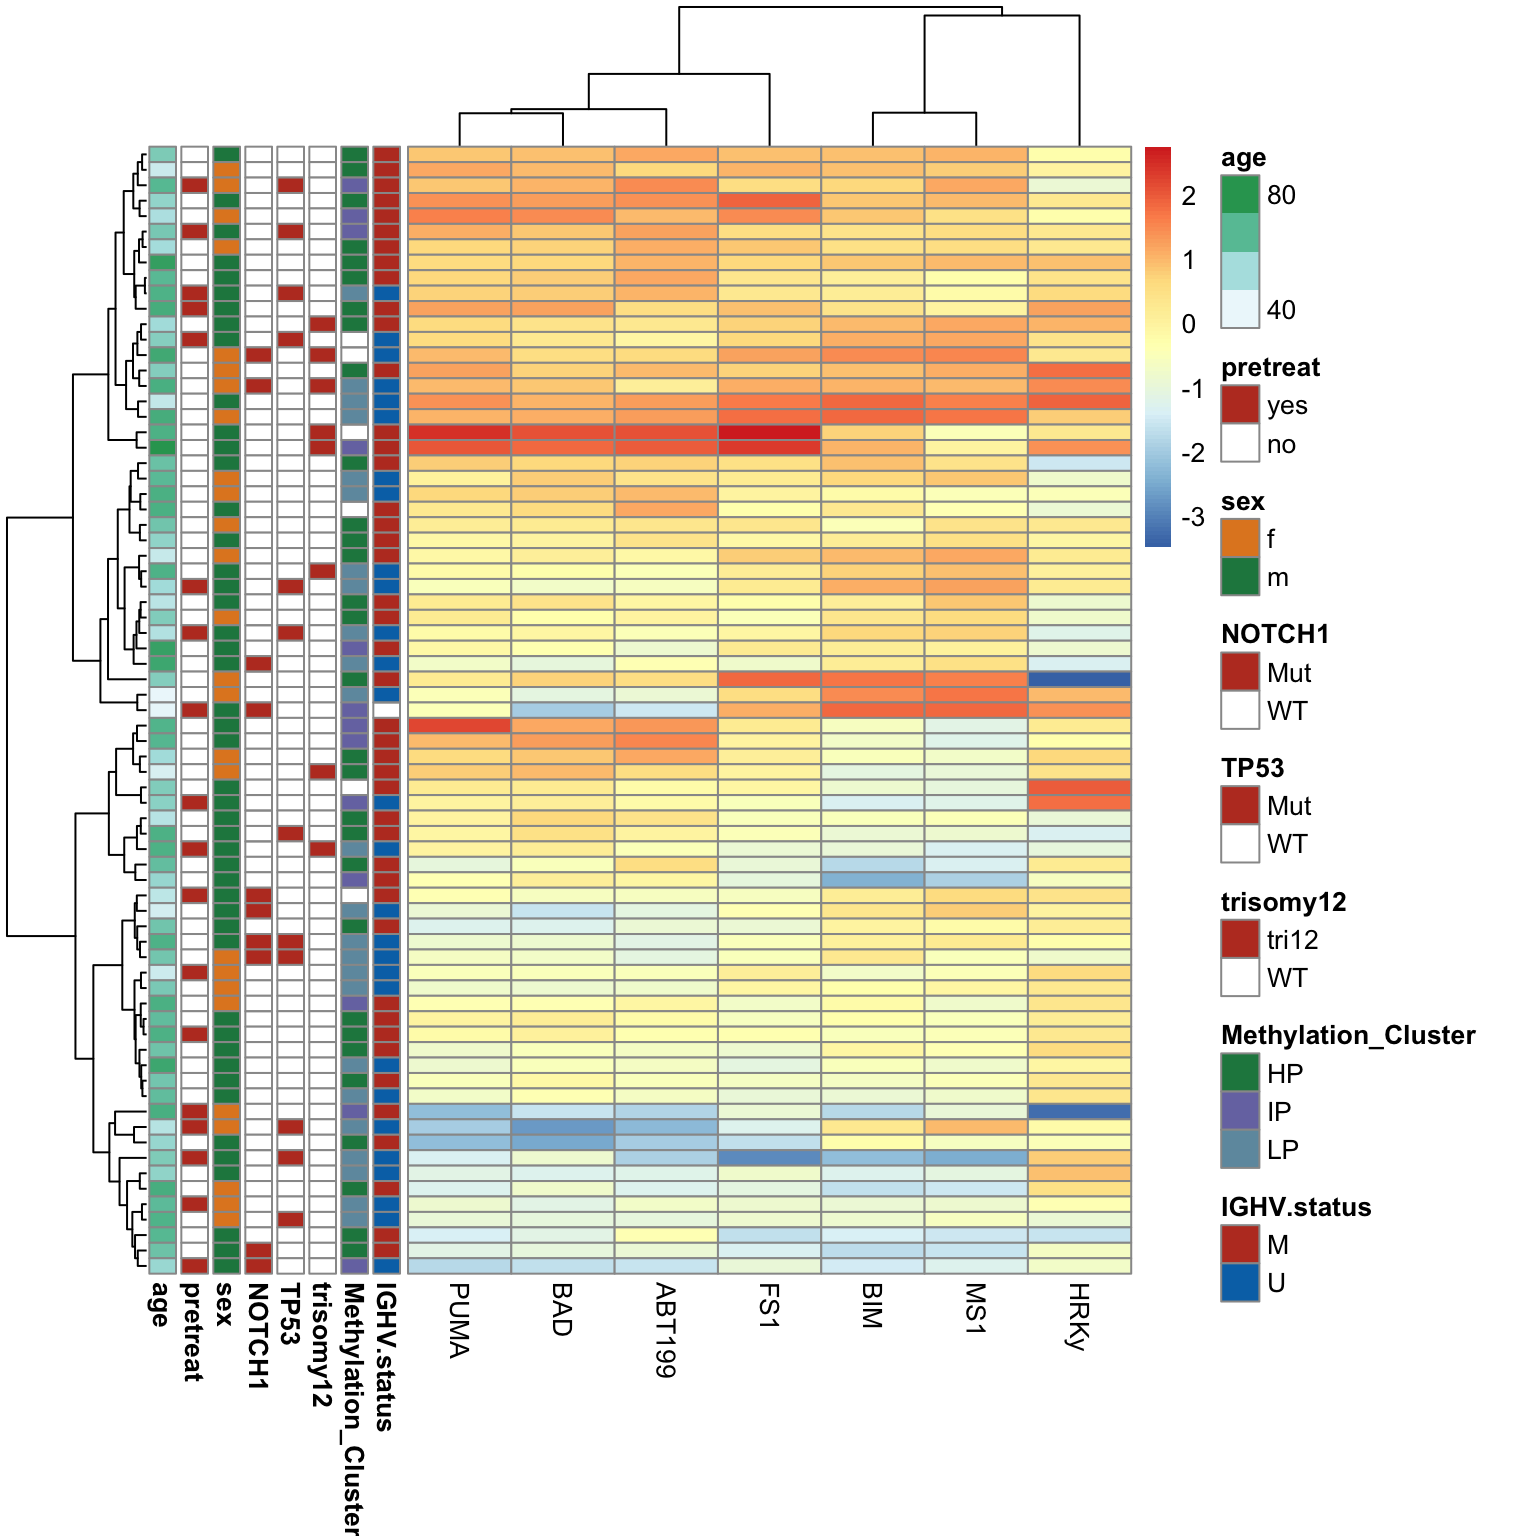
Hierarchical clustering and heatmaps
Pricipal component analysis
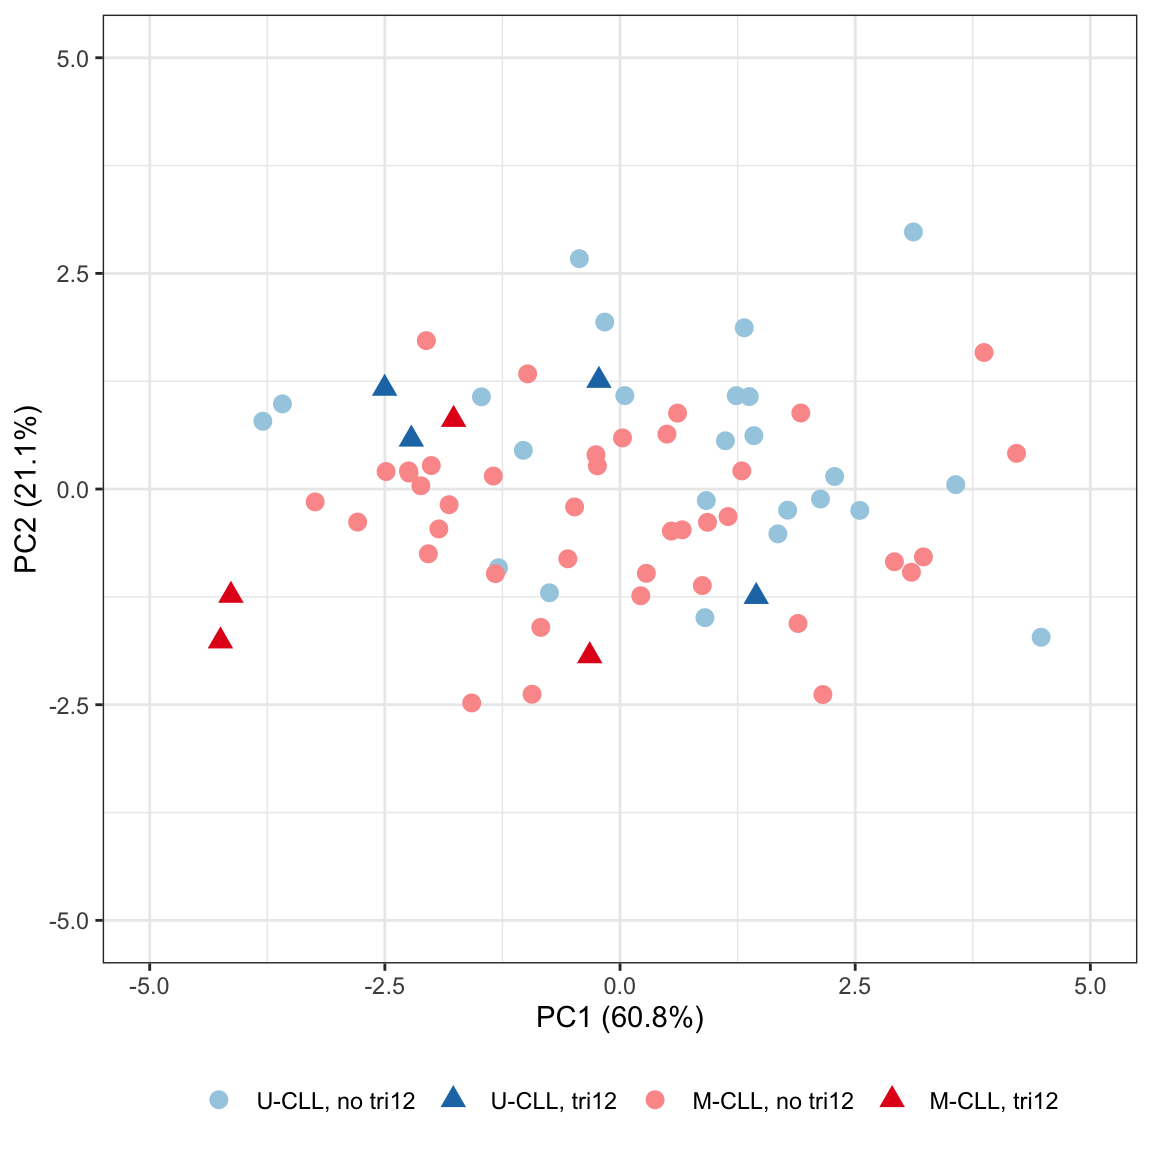
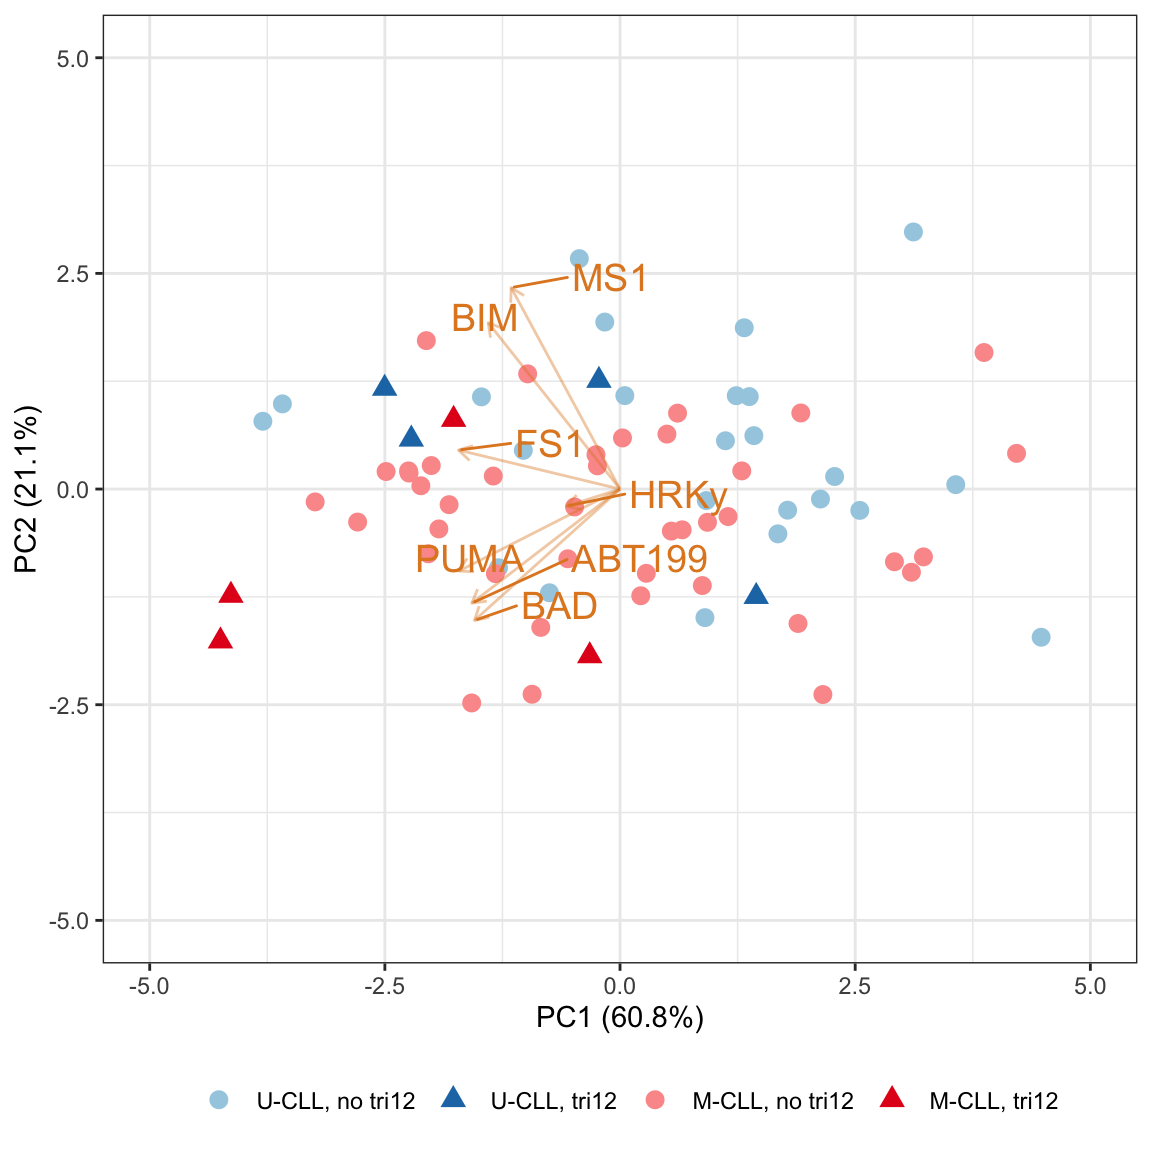
PCA biplot
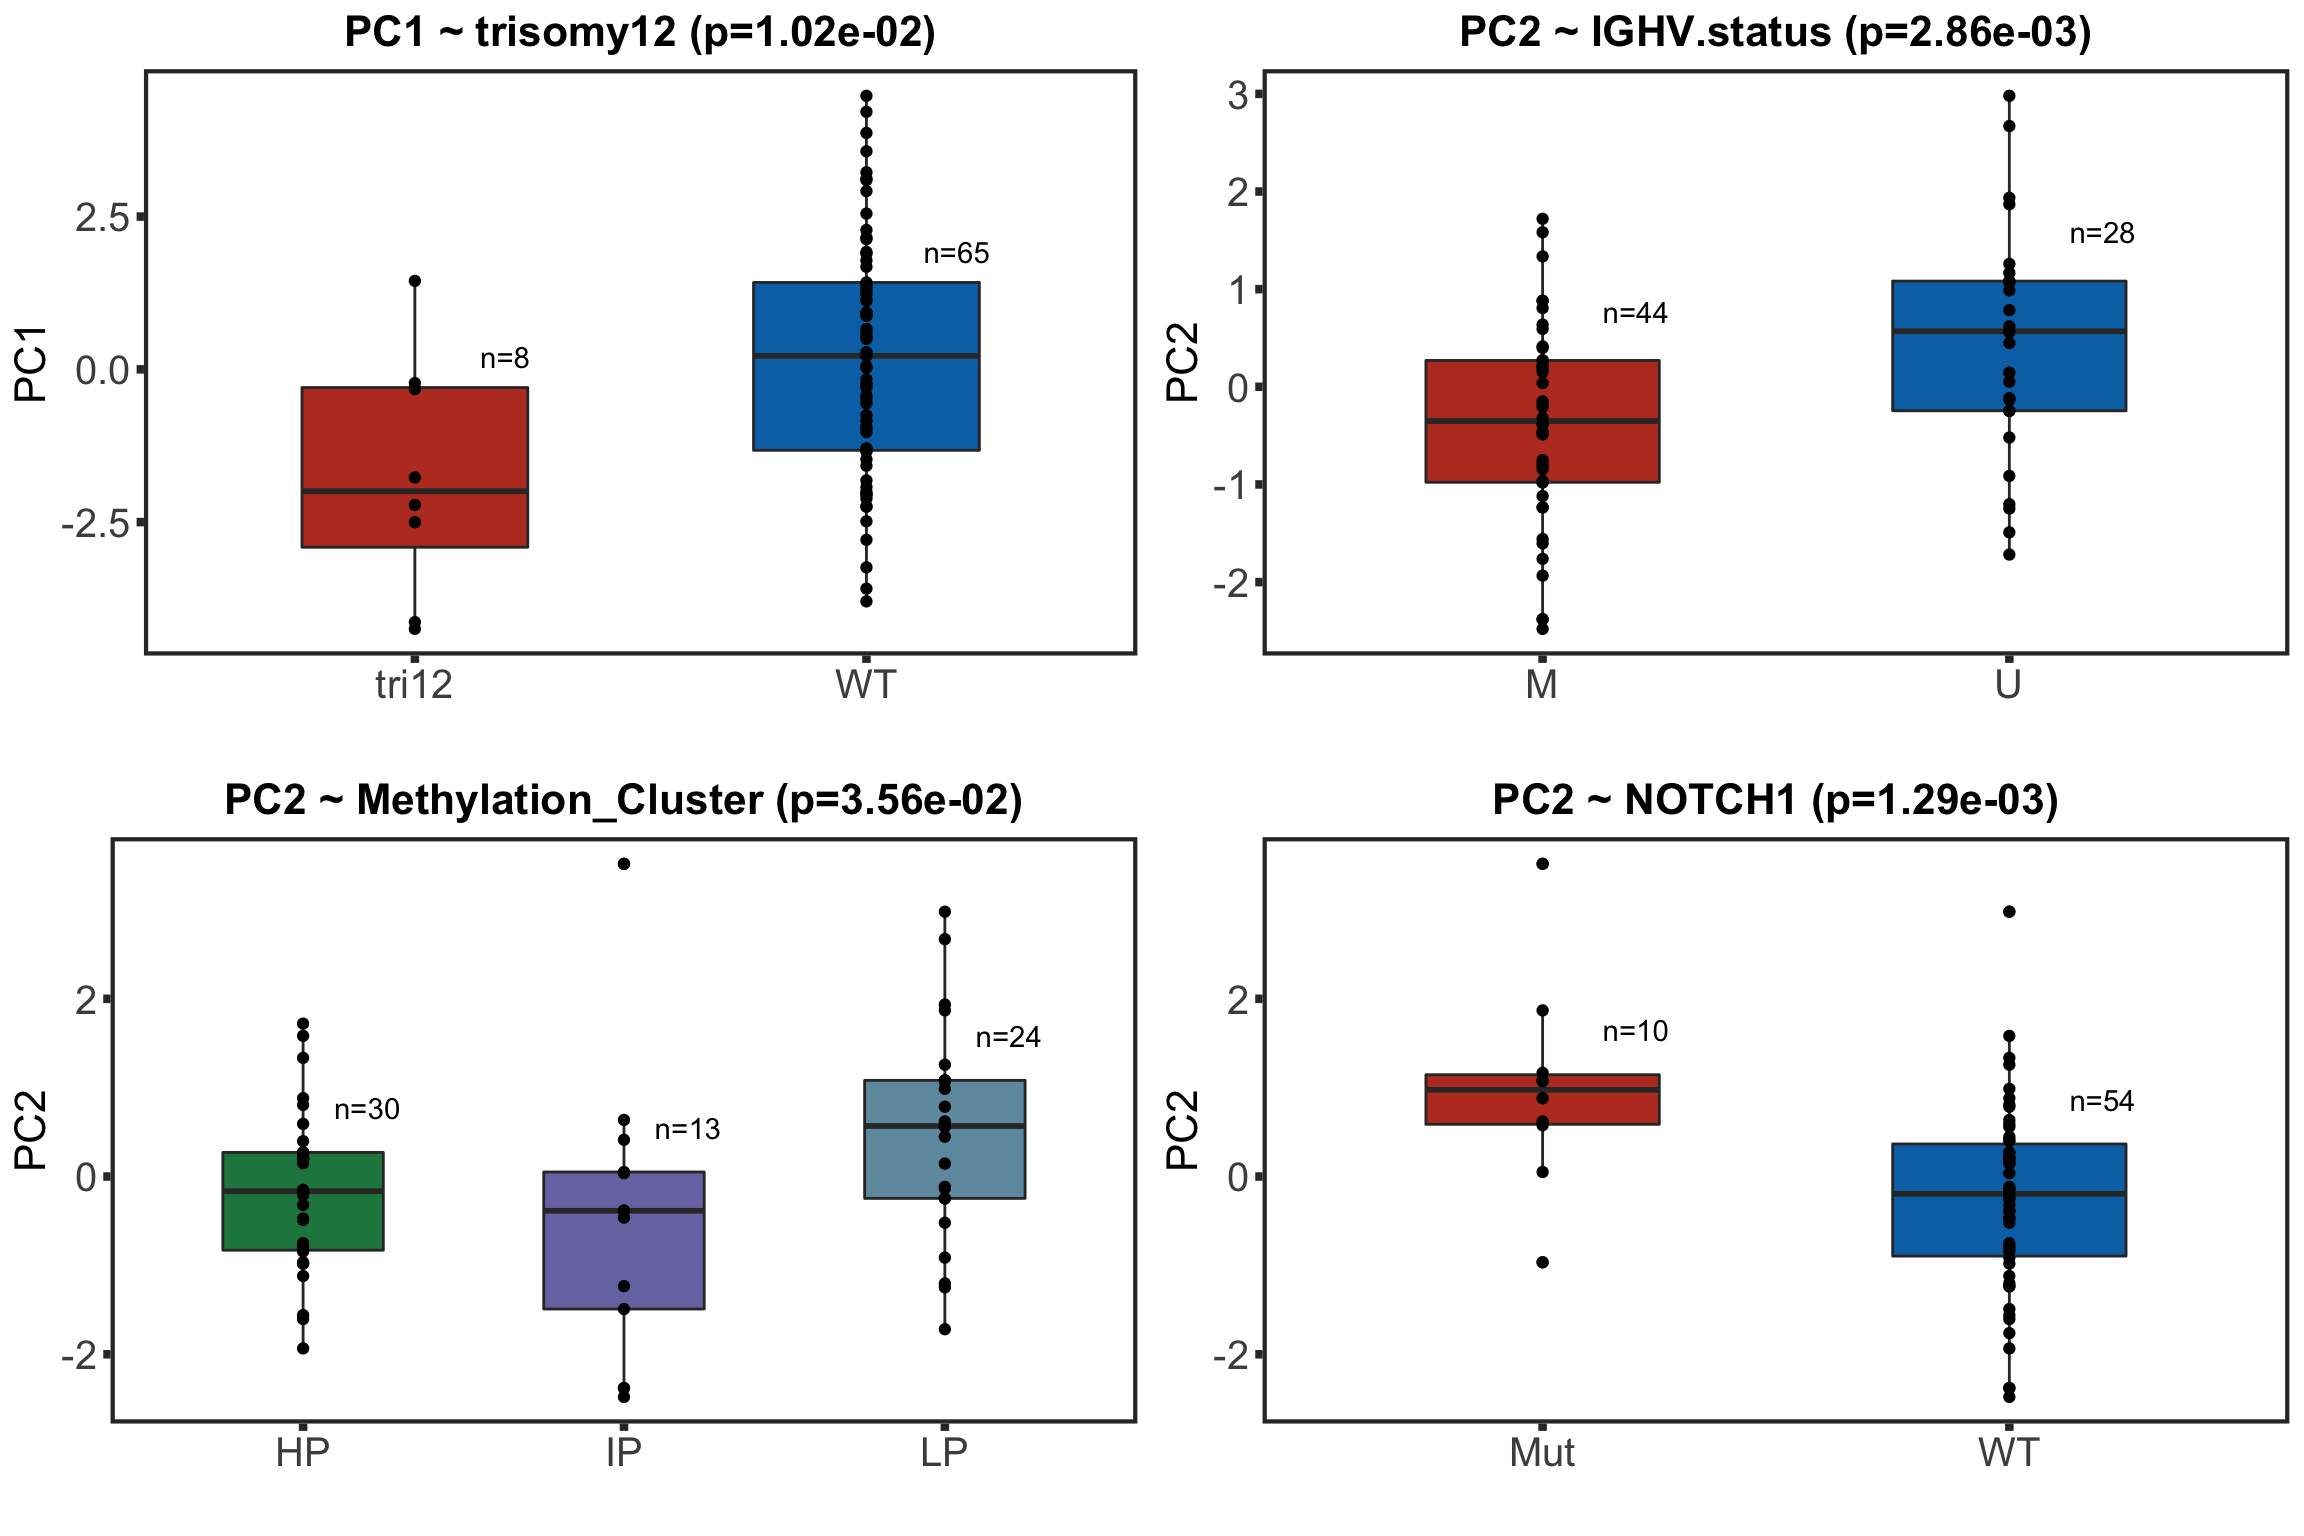
Associations between PCs and patient background
Associations with P-value < 0.05
# A tibble: 4 × 3
# Groups:   PC, feature [4]
  PC    feature             p.value
  <chr> <chr>                 <dbl>
1 PC2   NOTCH1              0.00129
2 PC2   IGHV.status         0.00286
3 PC1   trisomy12           0.0102
4 PC2   Methylation_Cluster 0.0356
Plot associations
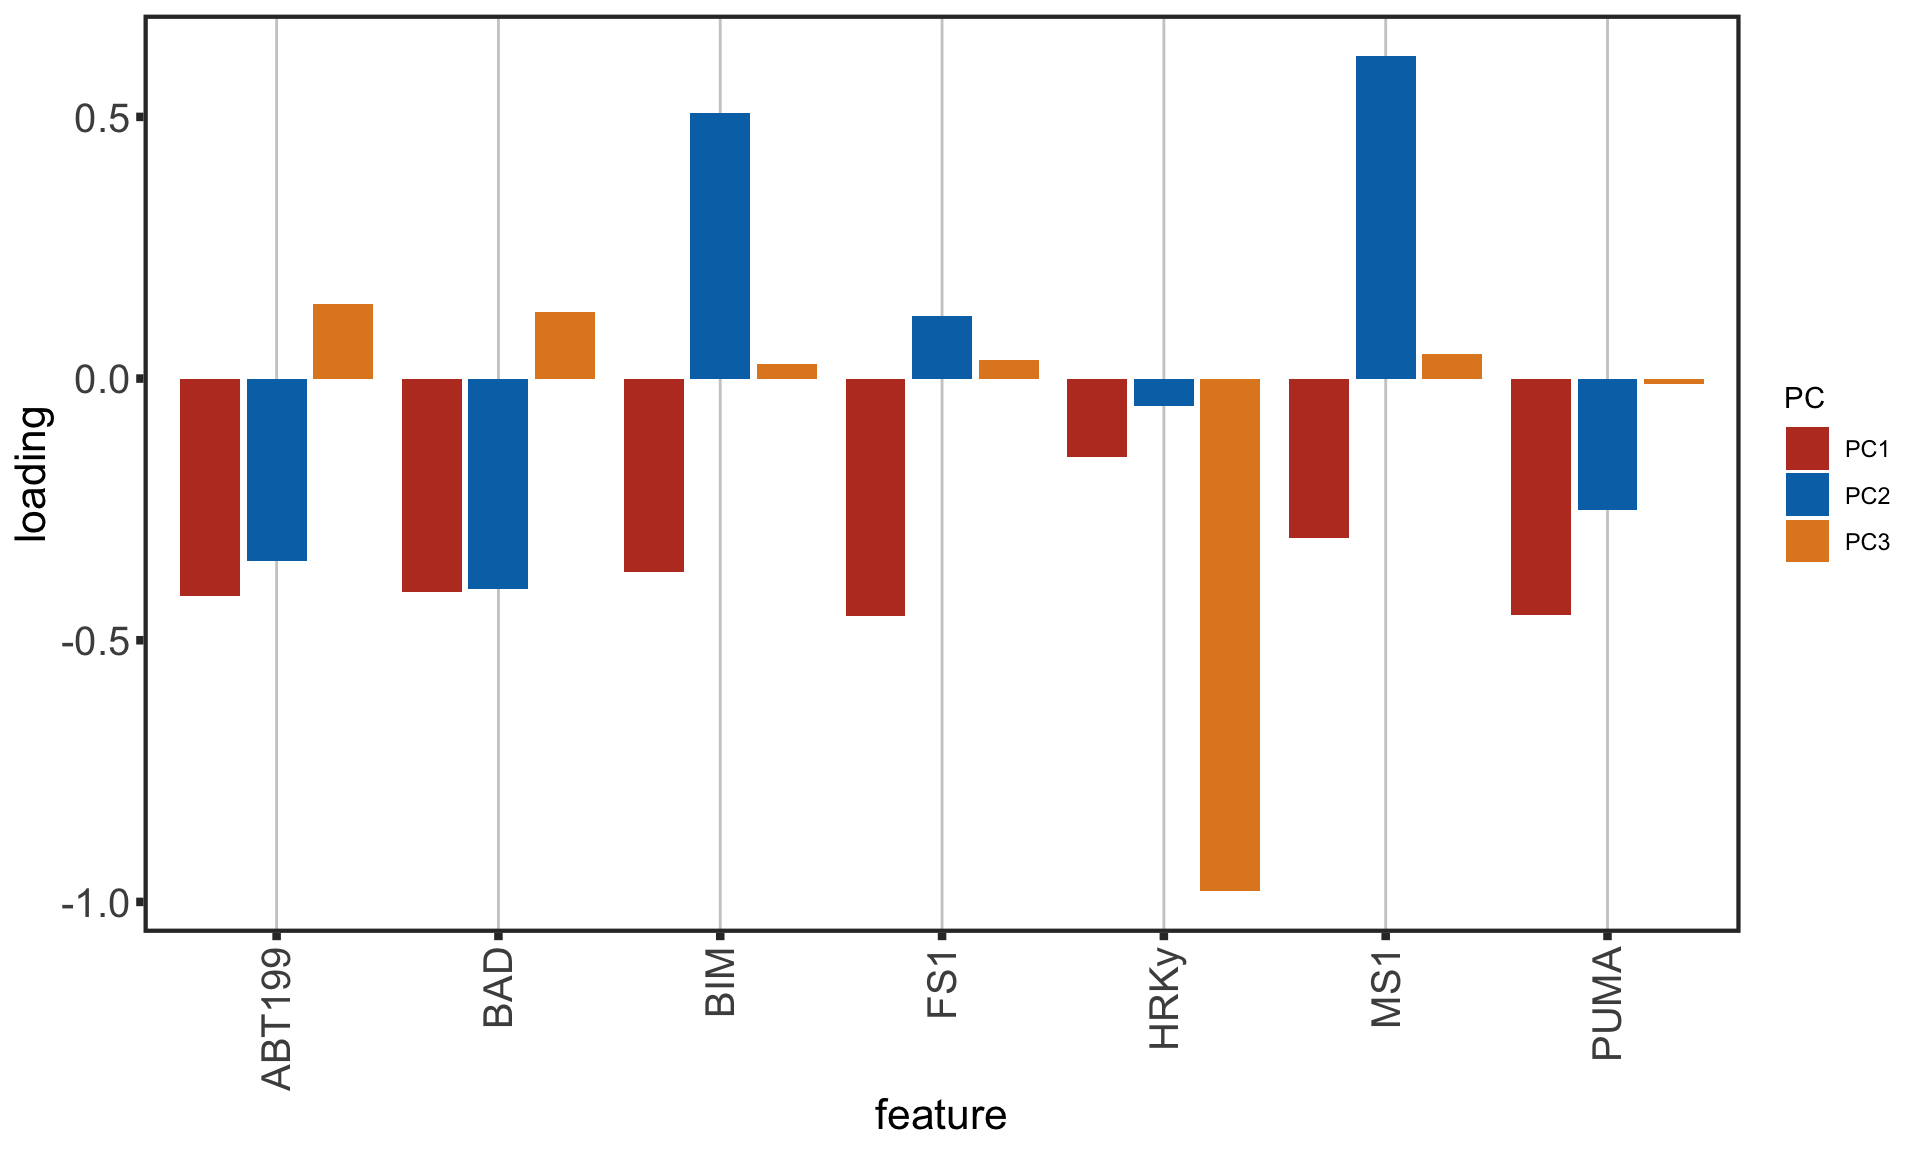
Plot feature loadings on the first three PCs
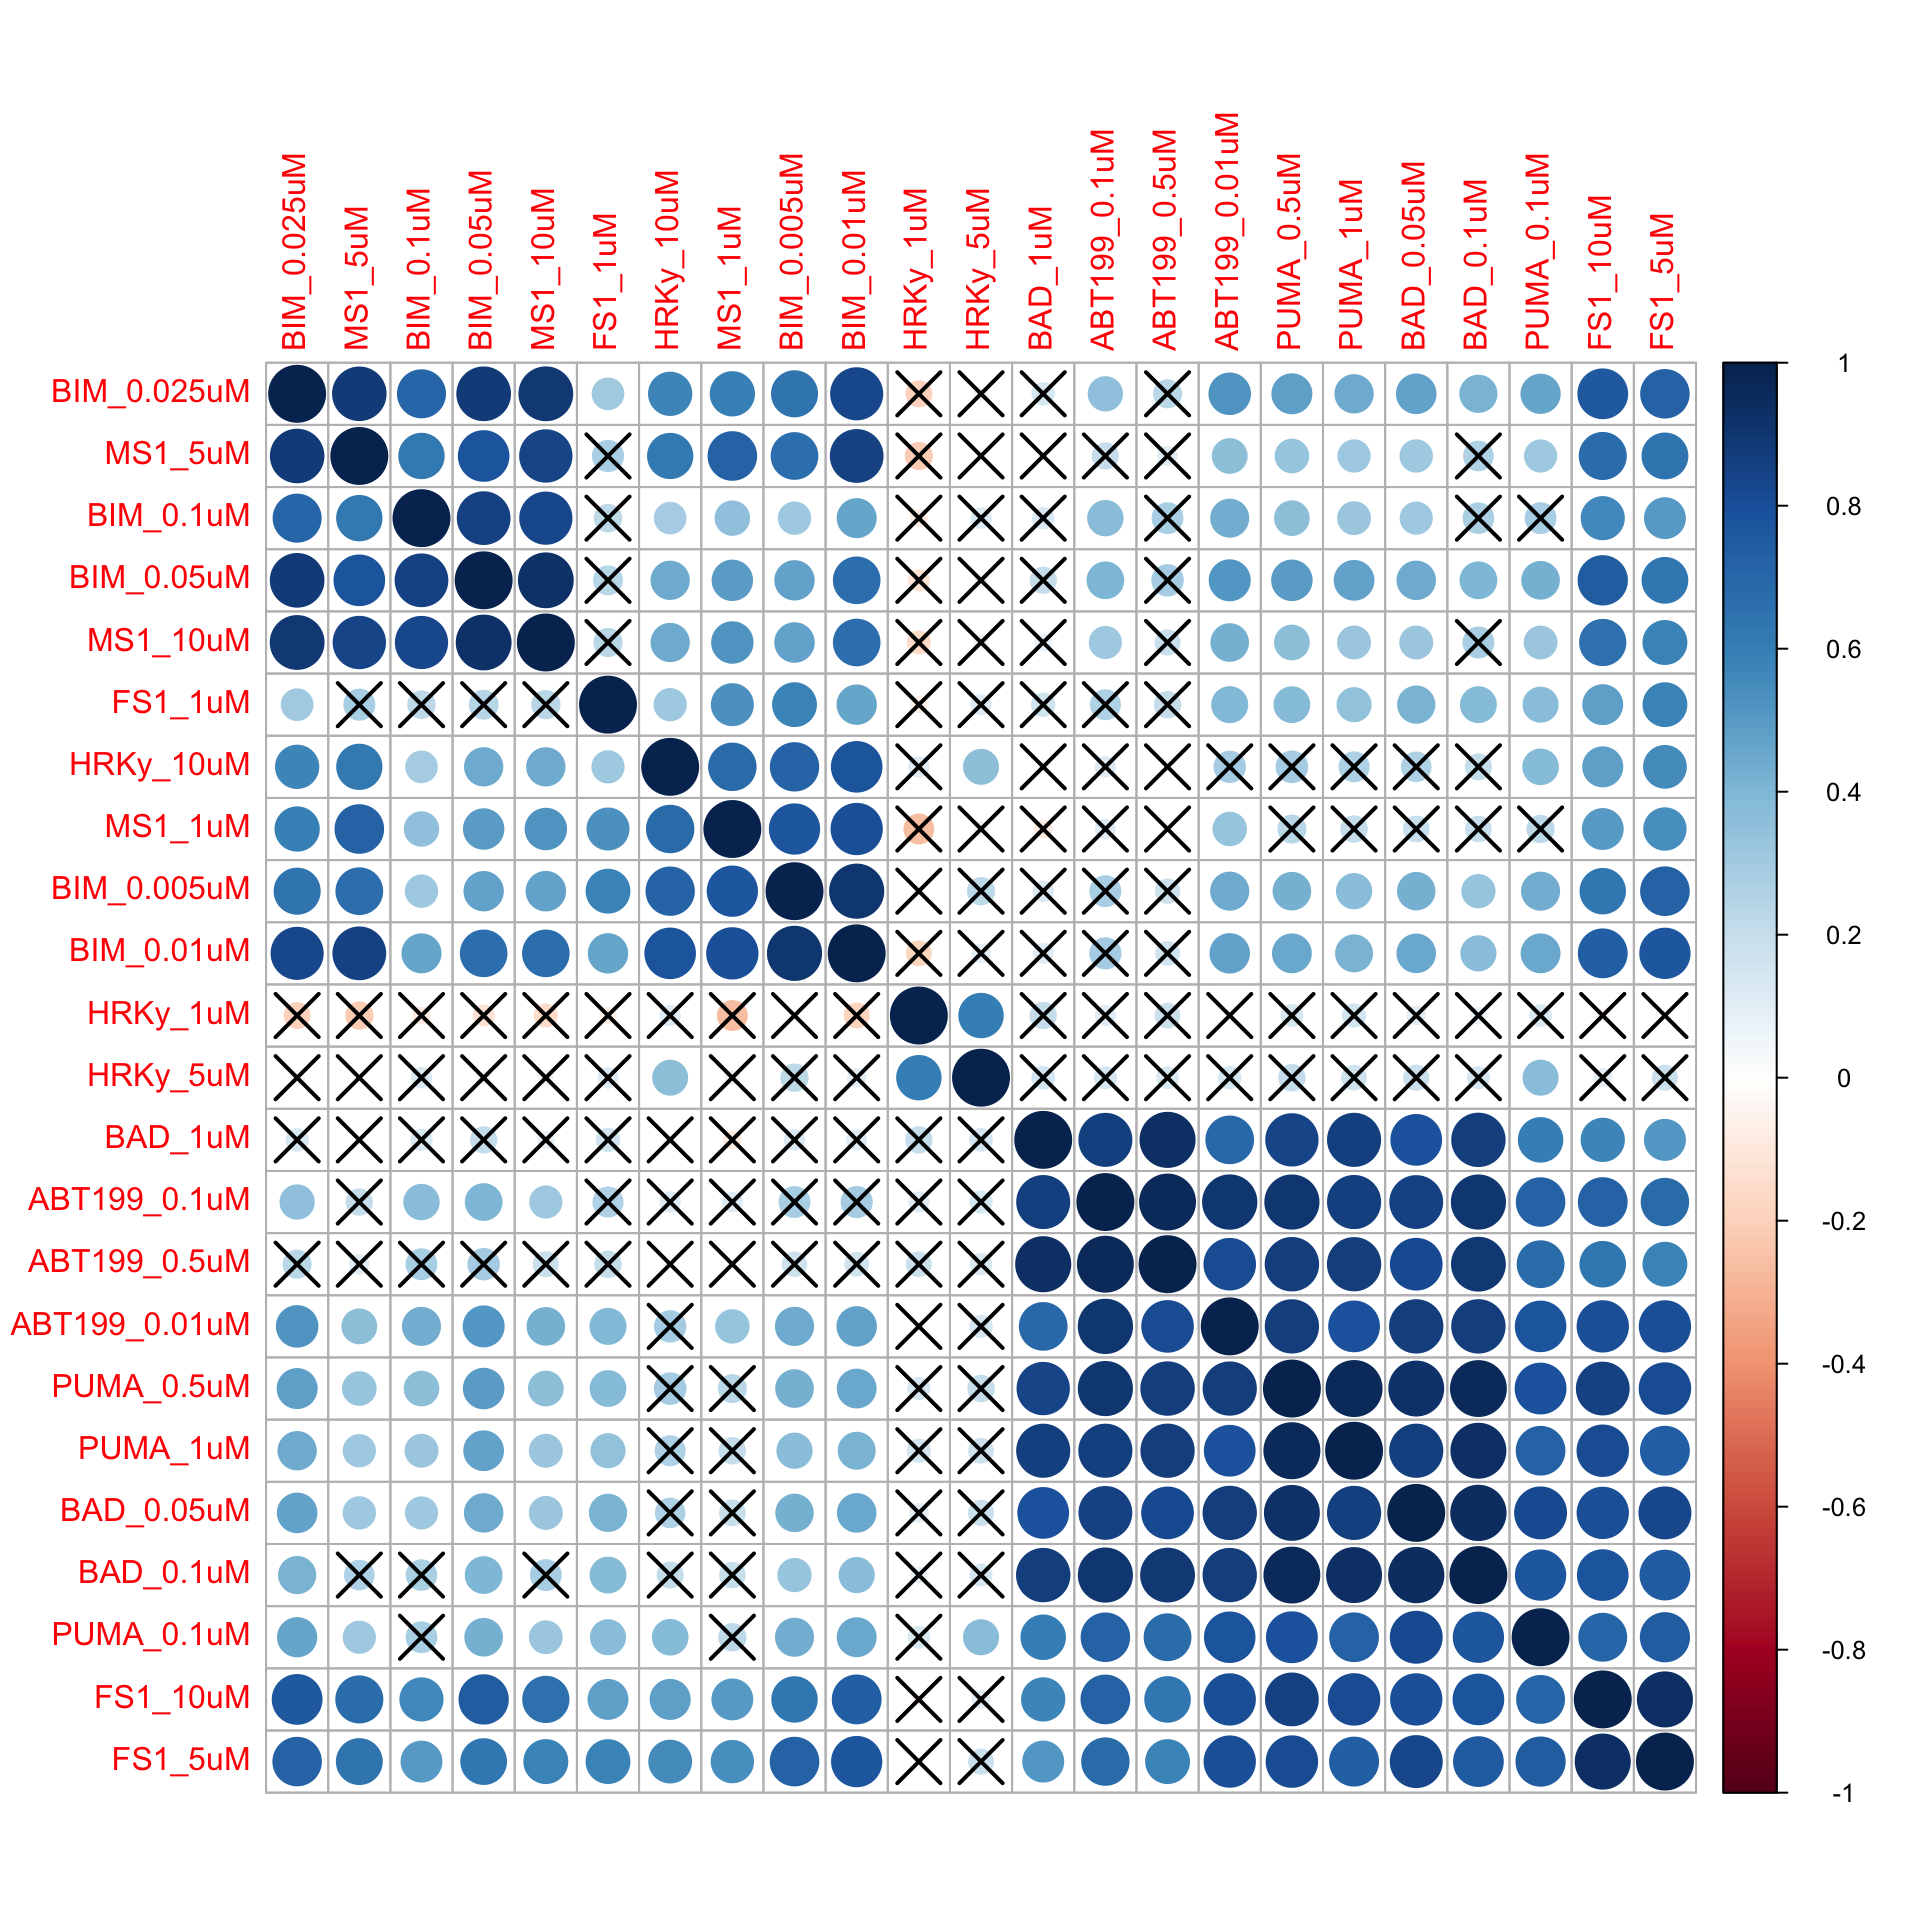
Feature correlations
AUC
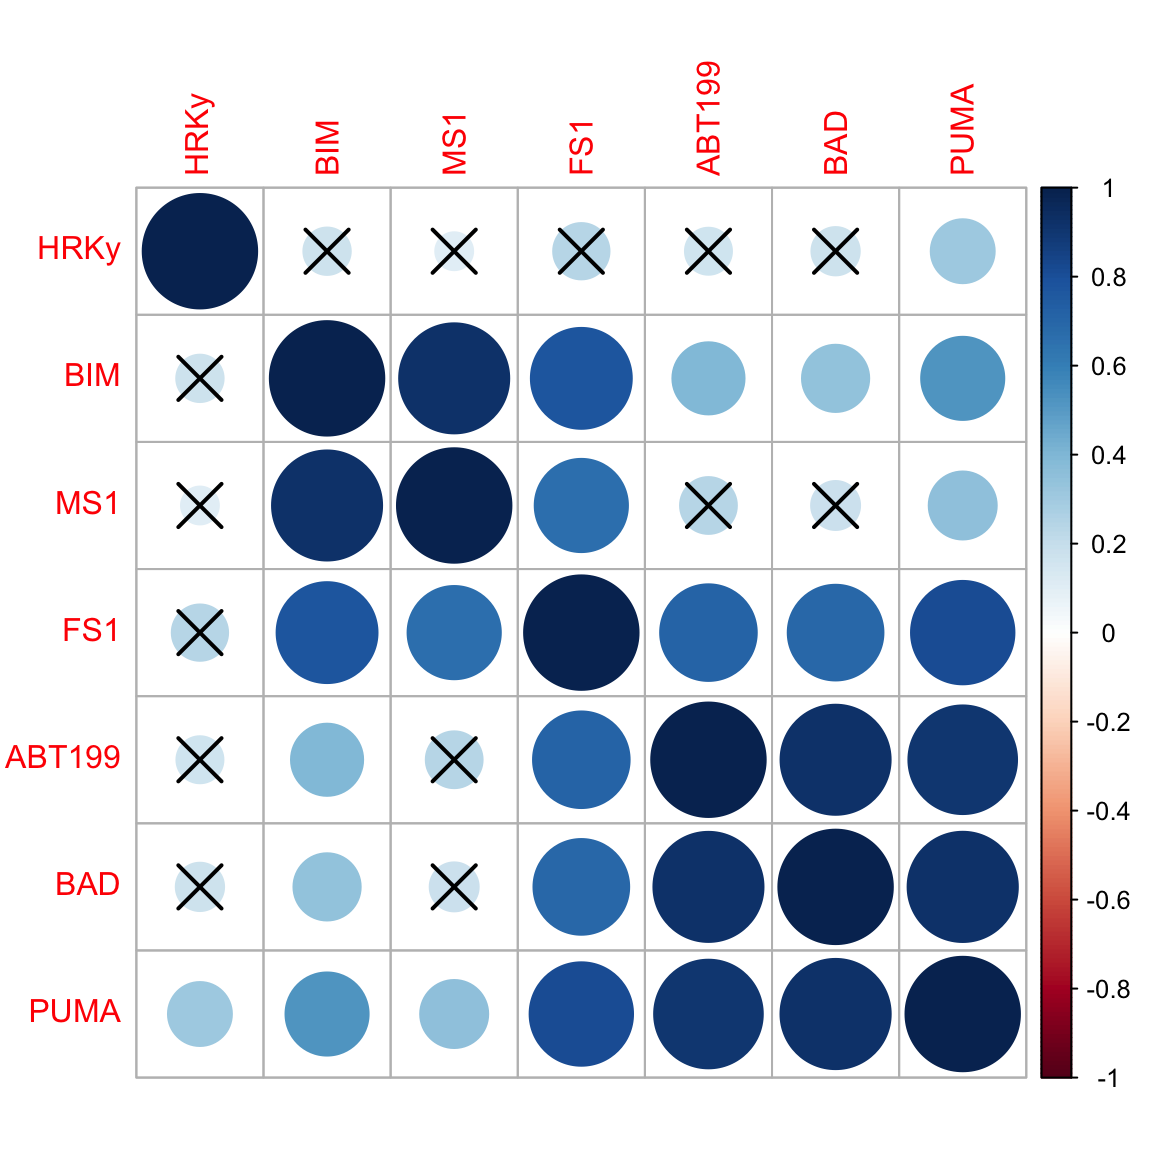
Individual concentrations
Association test with patient genomic background
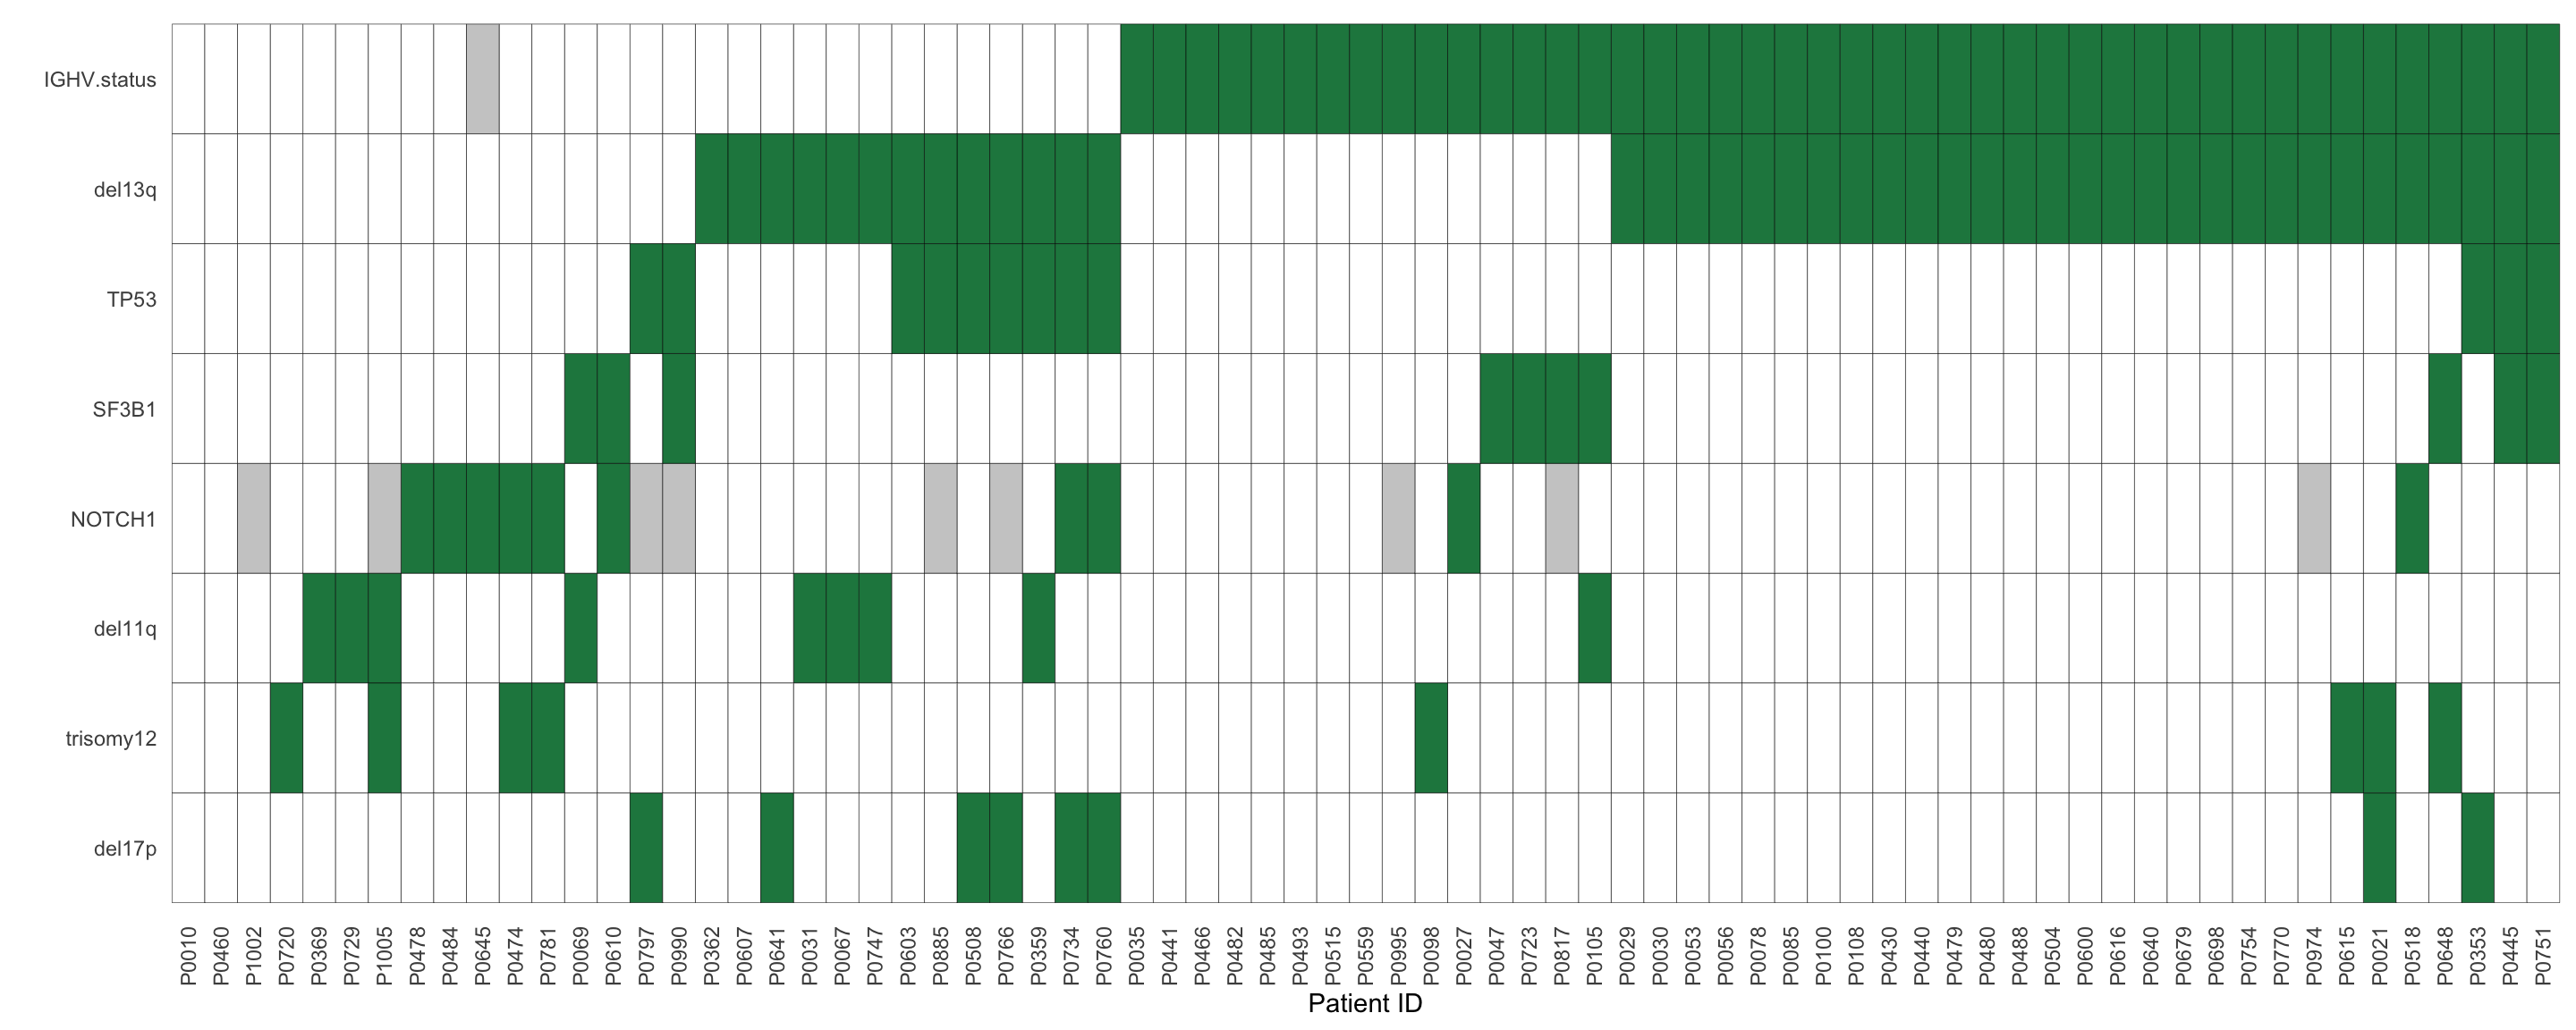
Prepare patient genomic background
[1] "IGHV.status" "del11q"      "del13q"      "del17p"      "trisomy12"
[6] "NOTCH1"      "SF3B1"       "TP53"
Plot to summarise genomic background
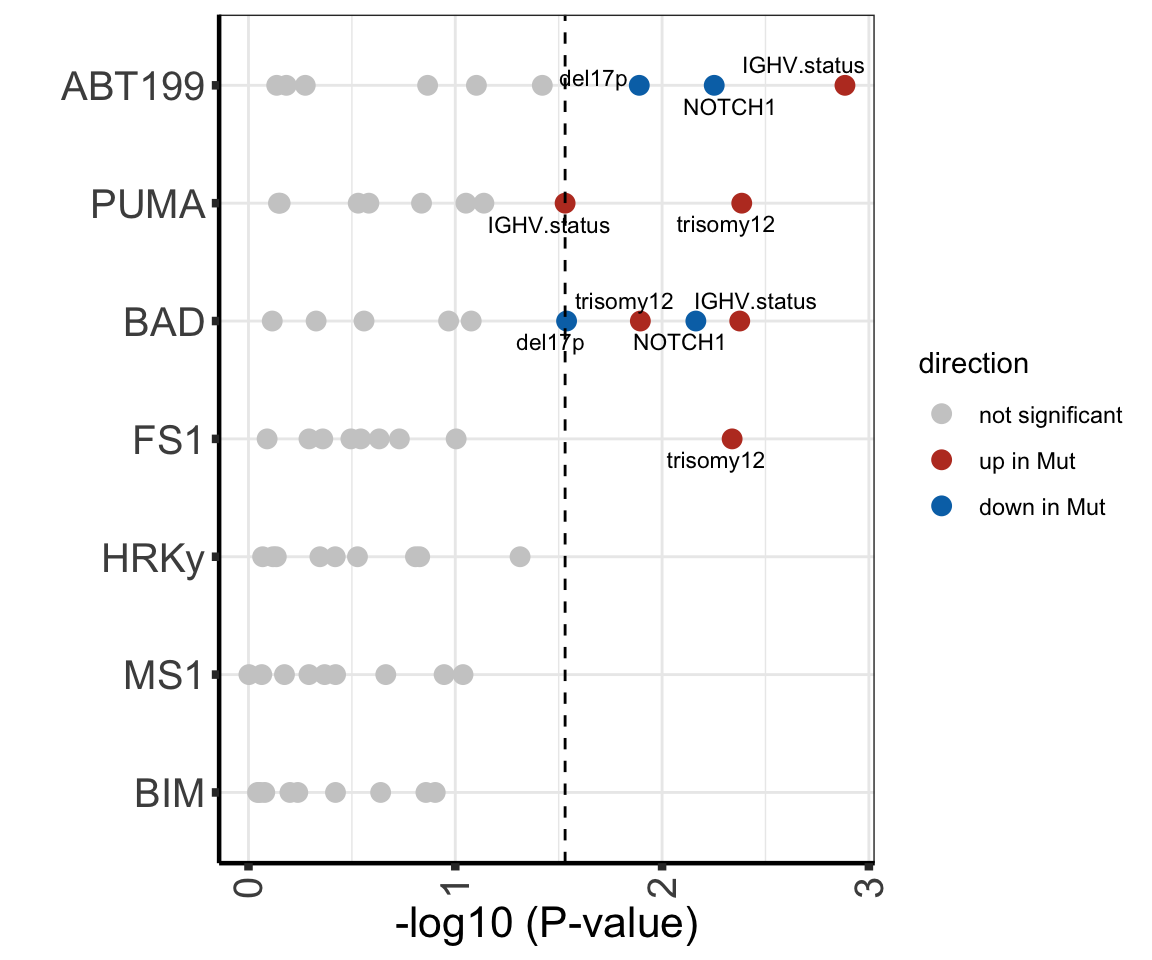
Association test
Test for Genomics
Methylation cluster
Table of associations
P value scatter plot
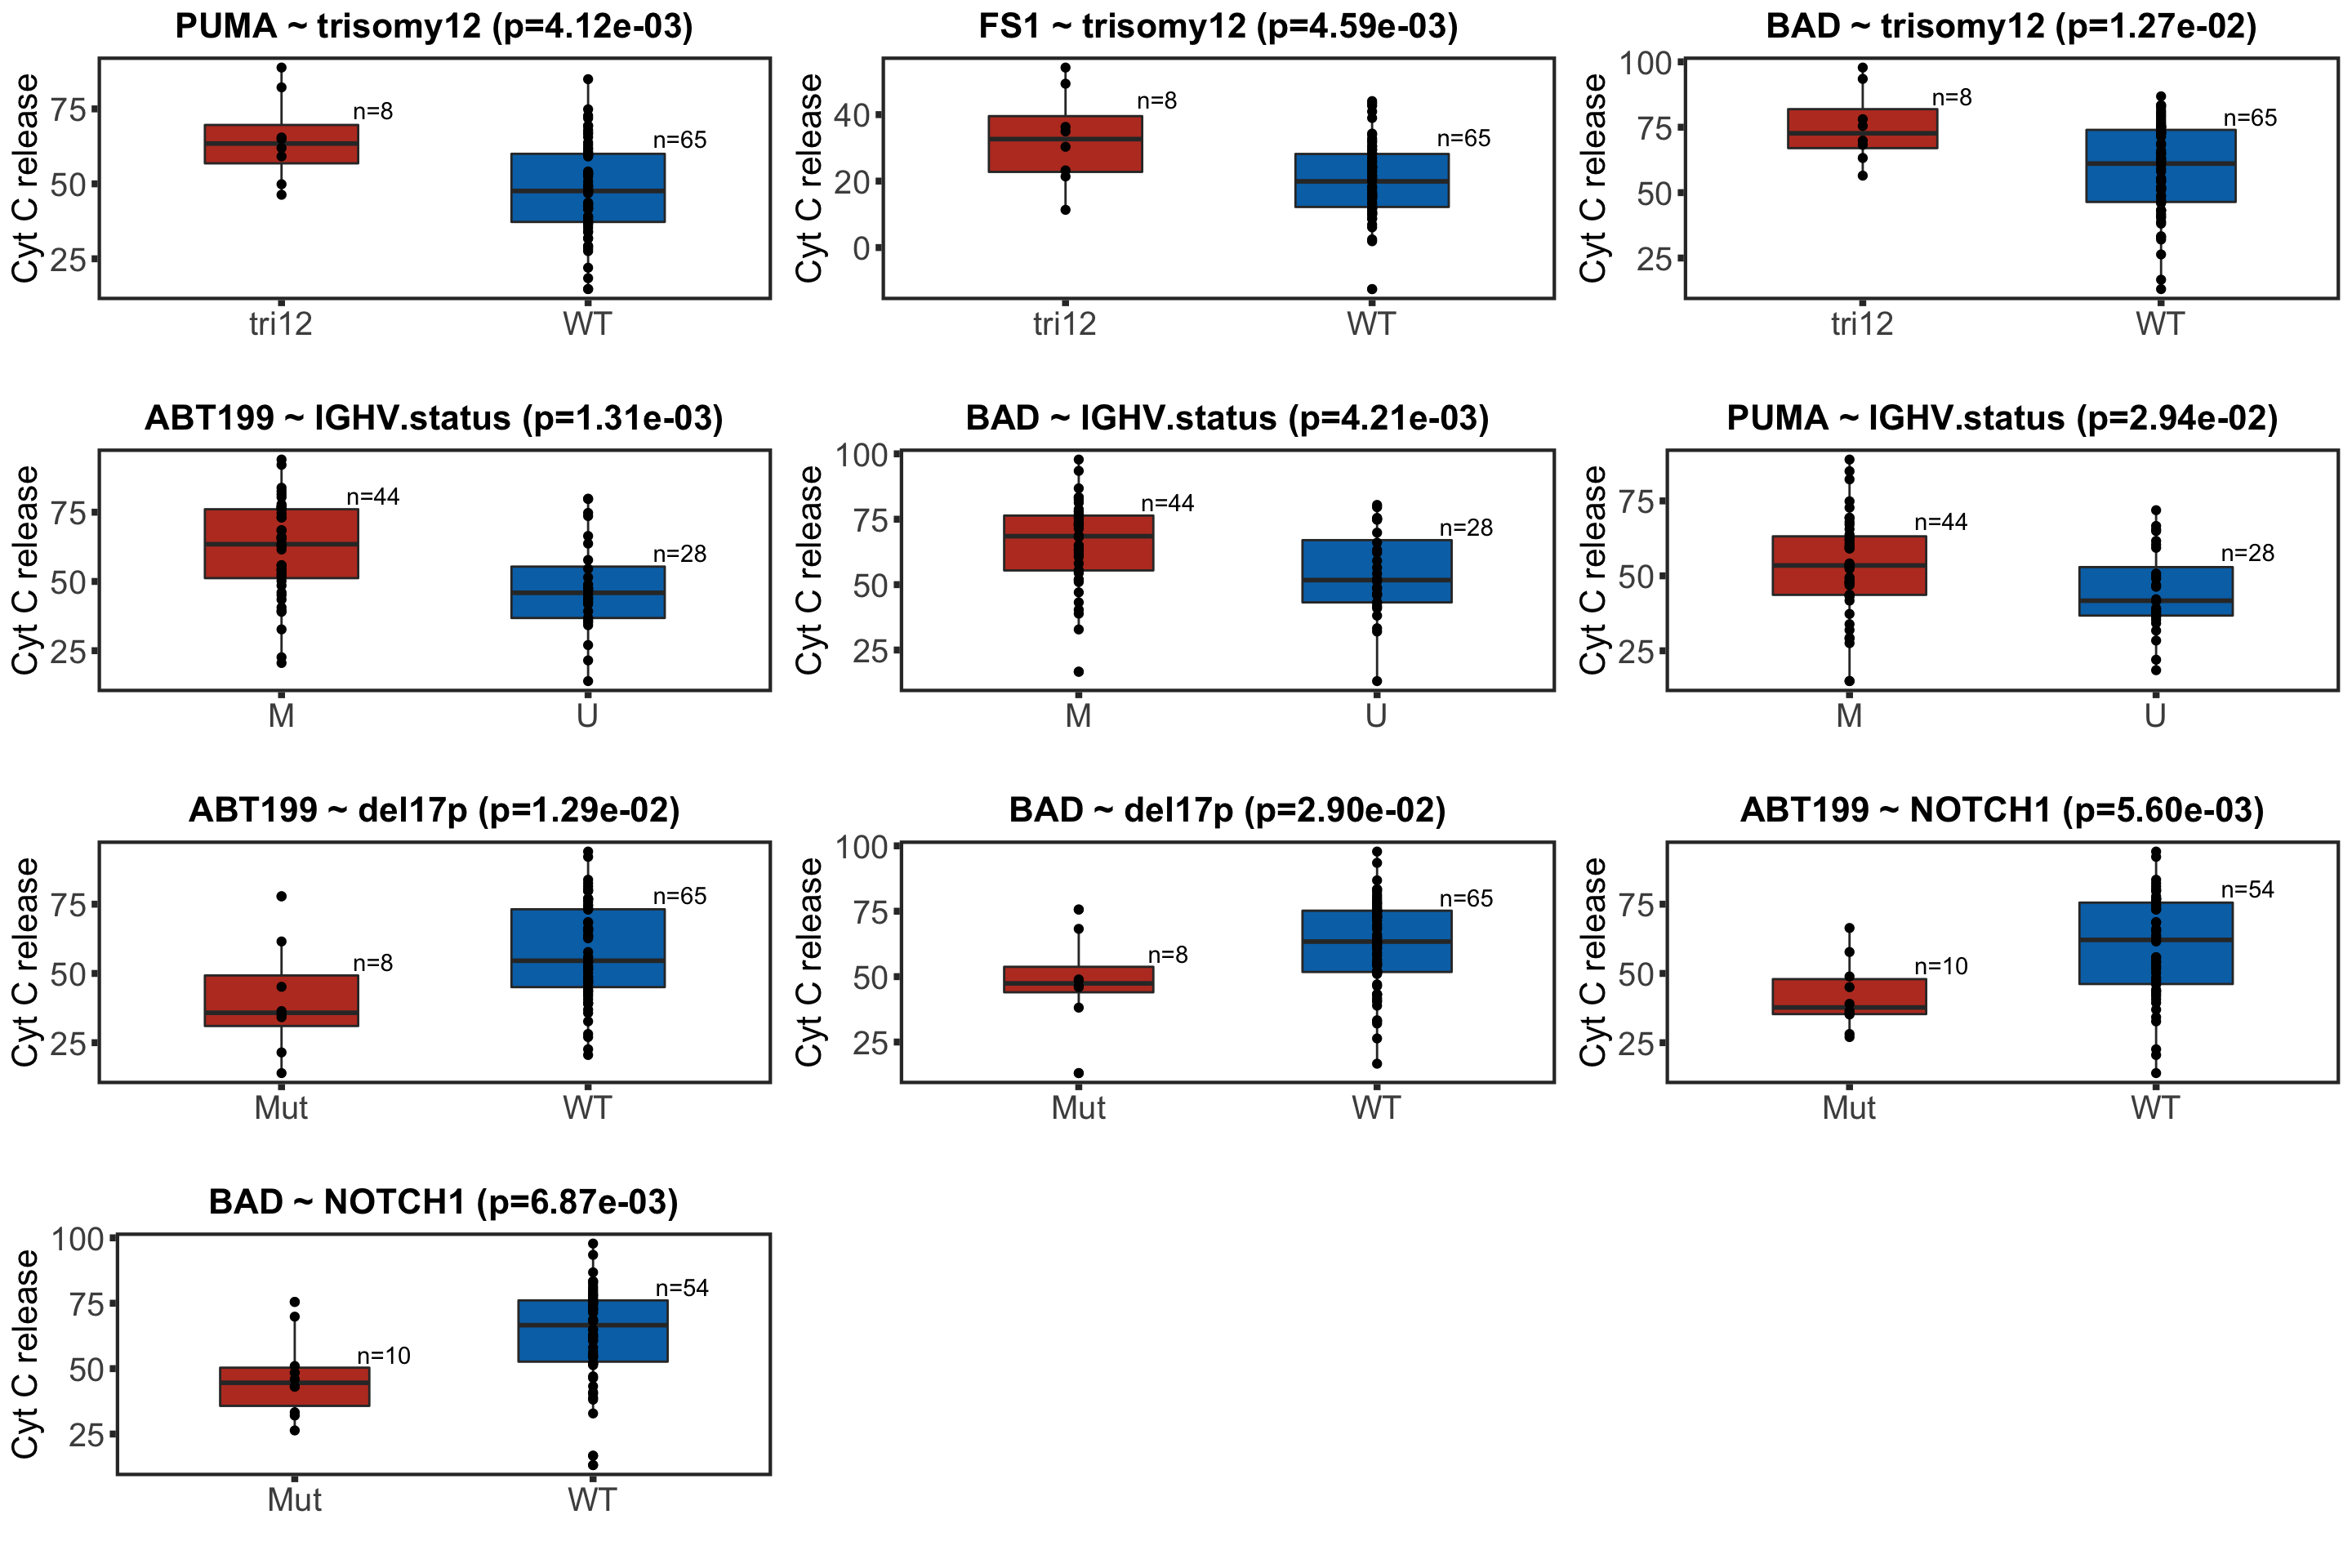
Box plots for the significant associations (10% FDR)
If multiple concentrations are identified as significant, only show
the most significant concentration.
Genomic correlation with individual concentrations
Association test
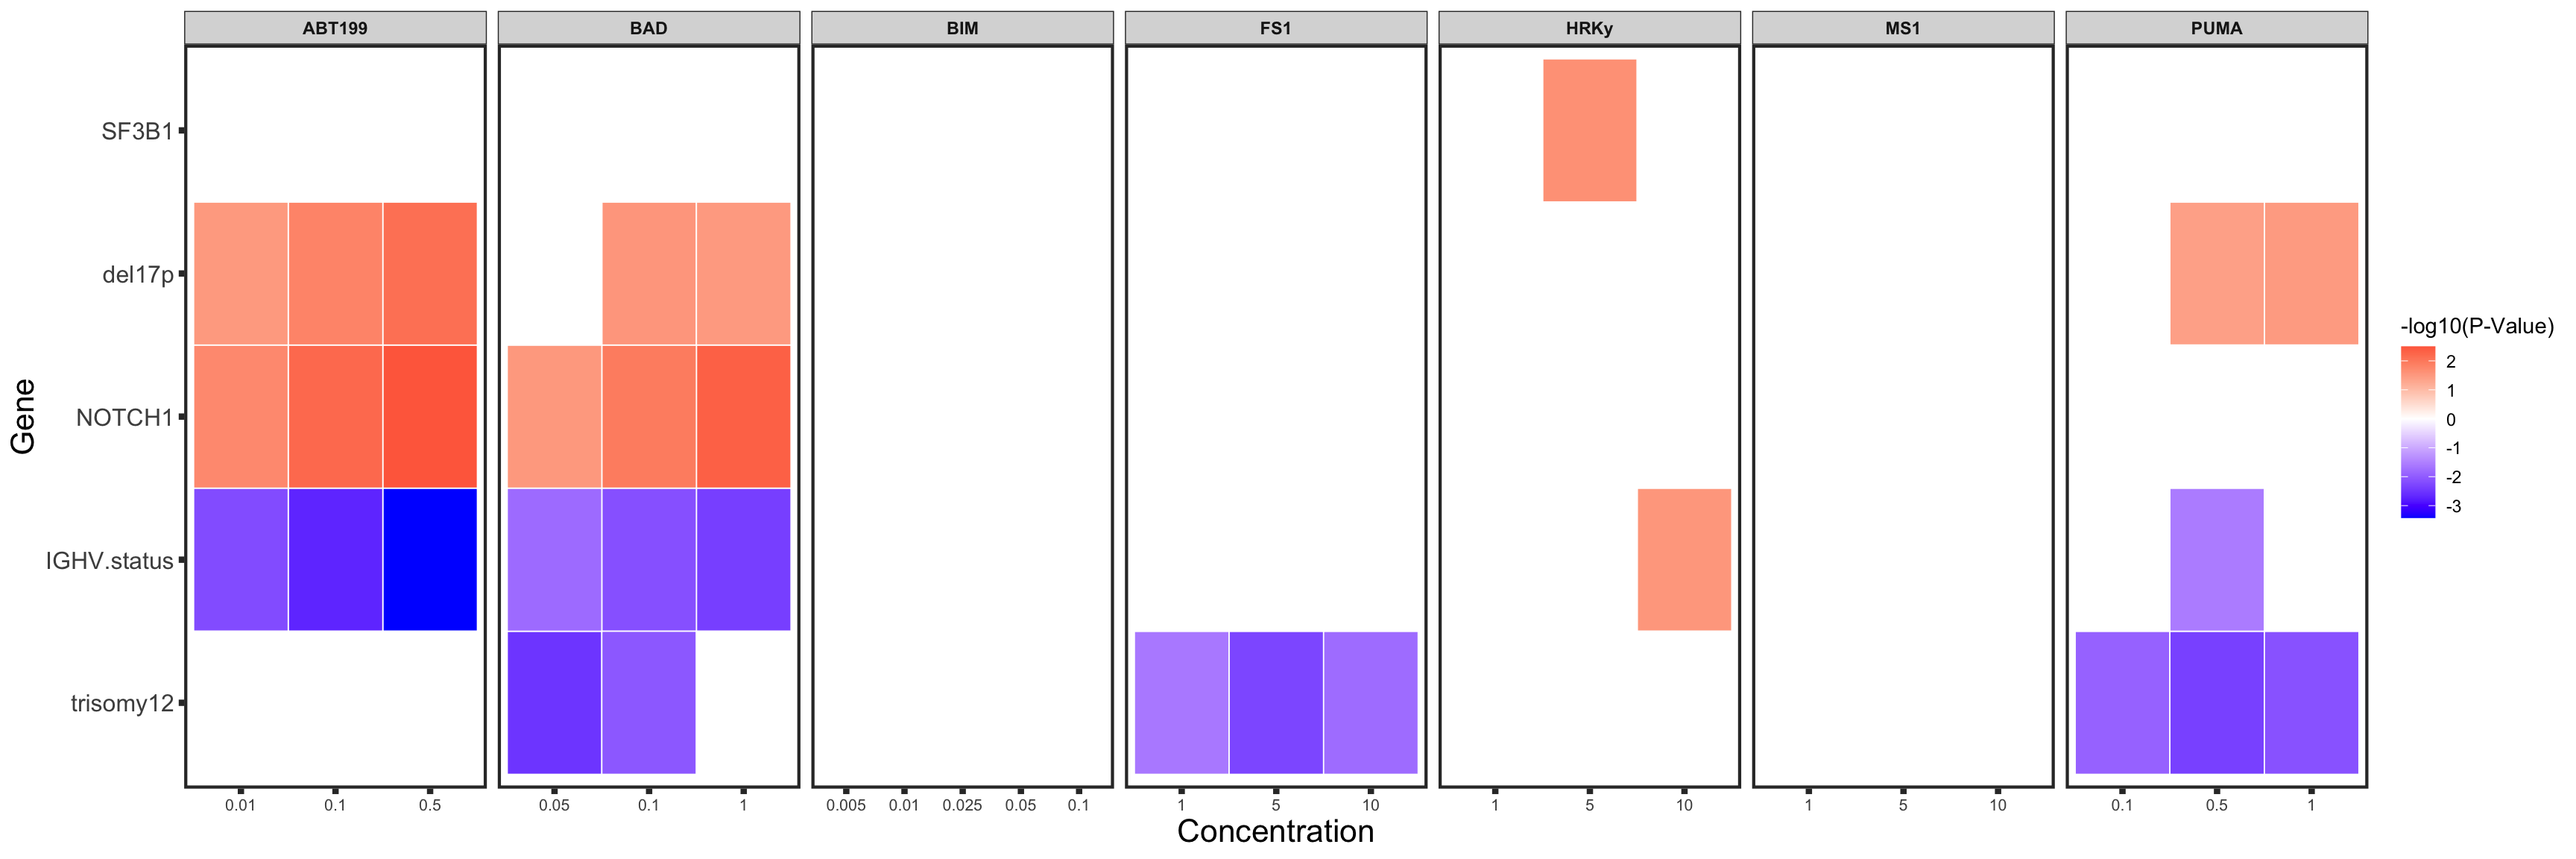
Summary heatmap plot for all concentrations
Associations with pretreatment status
Test for Genomics
# A tibble: 7 × 4
  feature p.value estimate p.adj
  <chr>     <dbl>    <dbl> <dbl>
1 ABT199   0.0174  11.7    0.122
2 BAD      0.0460   9.51   0.161
3 BIM      0.414    2.99   0.580
4 FS1      0.190    4.23   0.333
5 HRKy     0.946   -0.0745 0.946
6 MS1      0.787    1.49   0.918
7 PUMA     0.116    6.85   0.270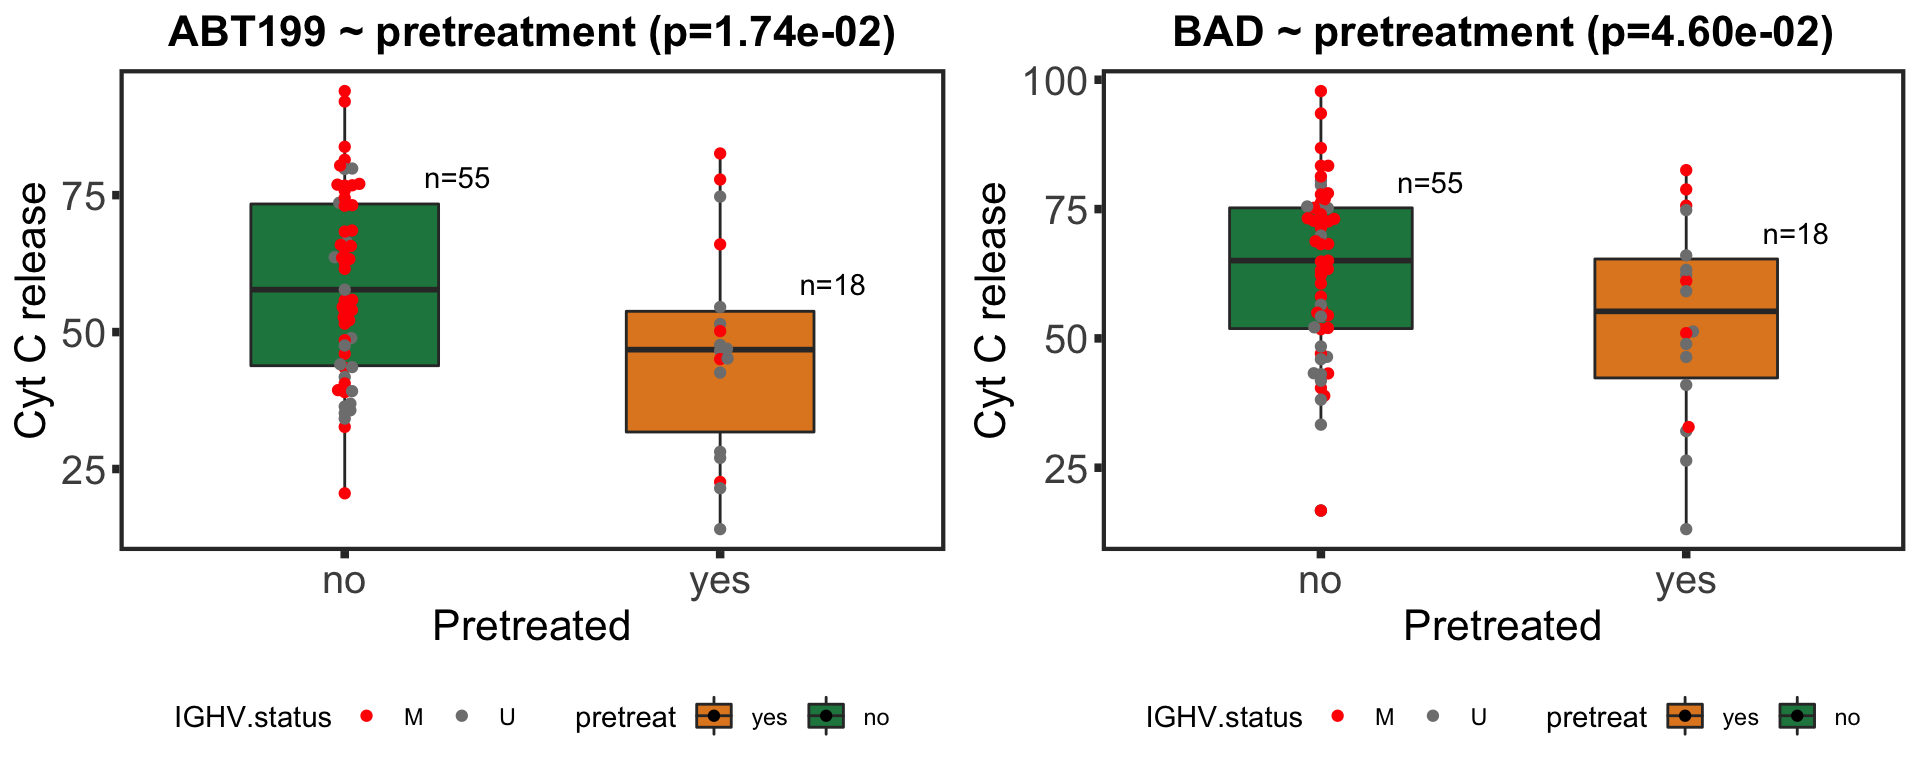
    Pearson's Chi-squared test with Yates' continuity correction

data:  patAnno$IGHV.status and patAnno$pretreat
X-squared = 4.9003, df = 1, p-value = 0.02685
Estimate the confounding effect of pretreatment status
How many treated and untreated samples?
no yes
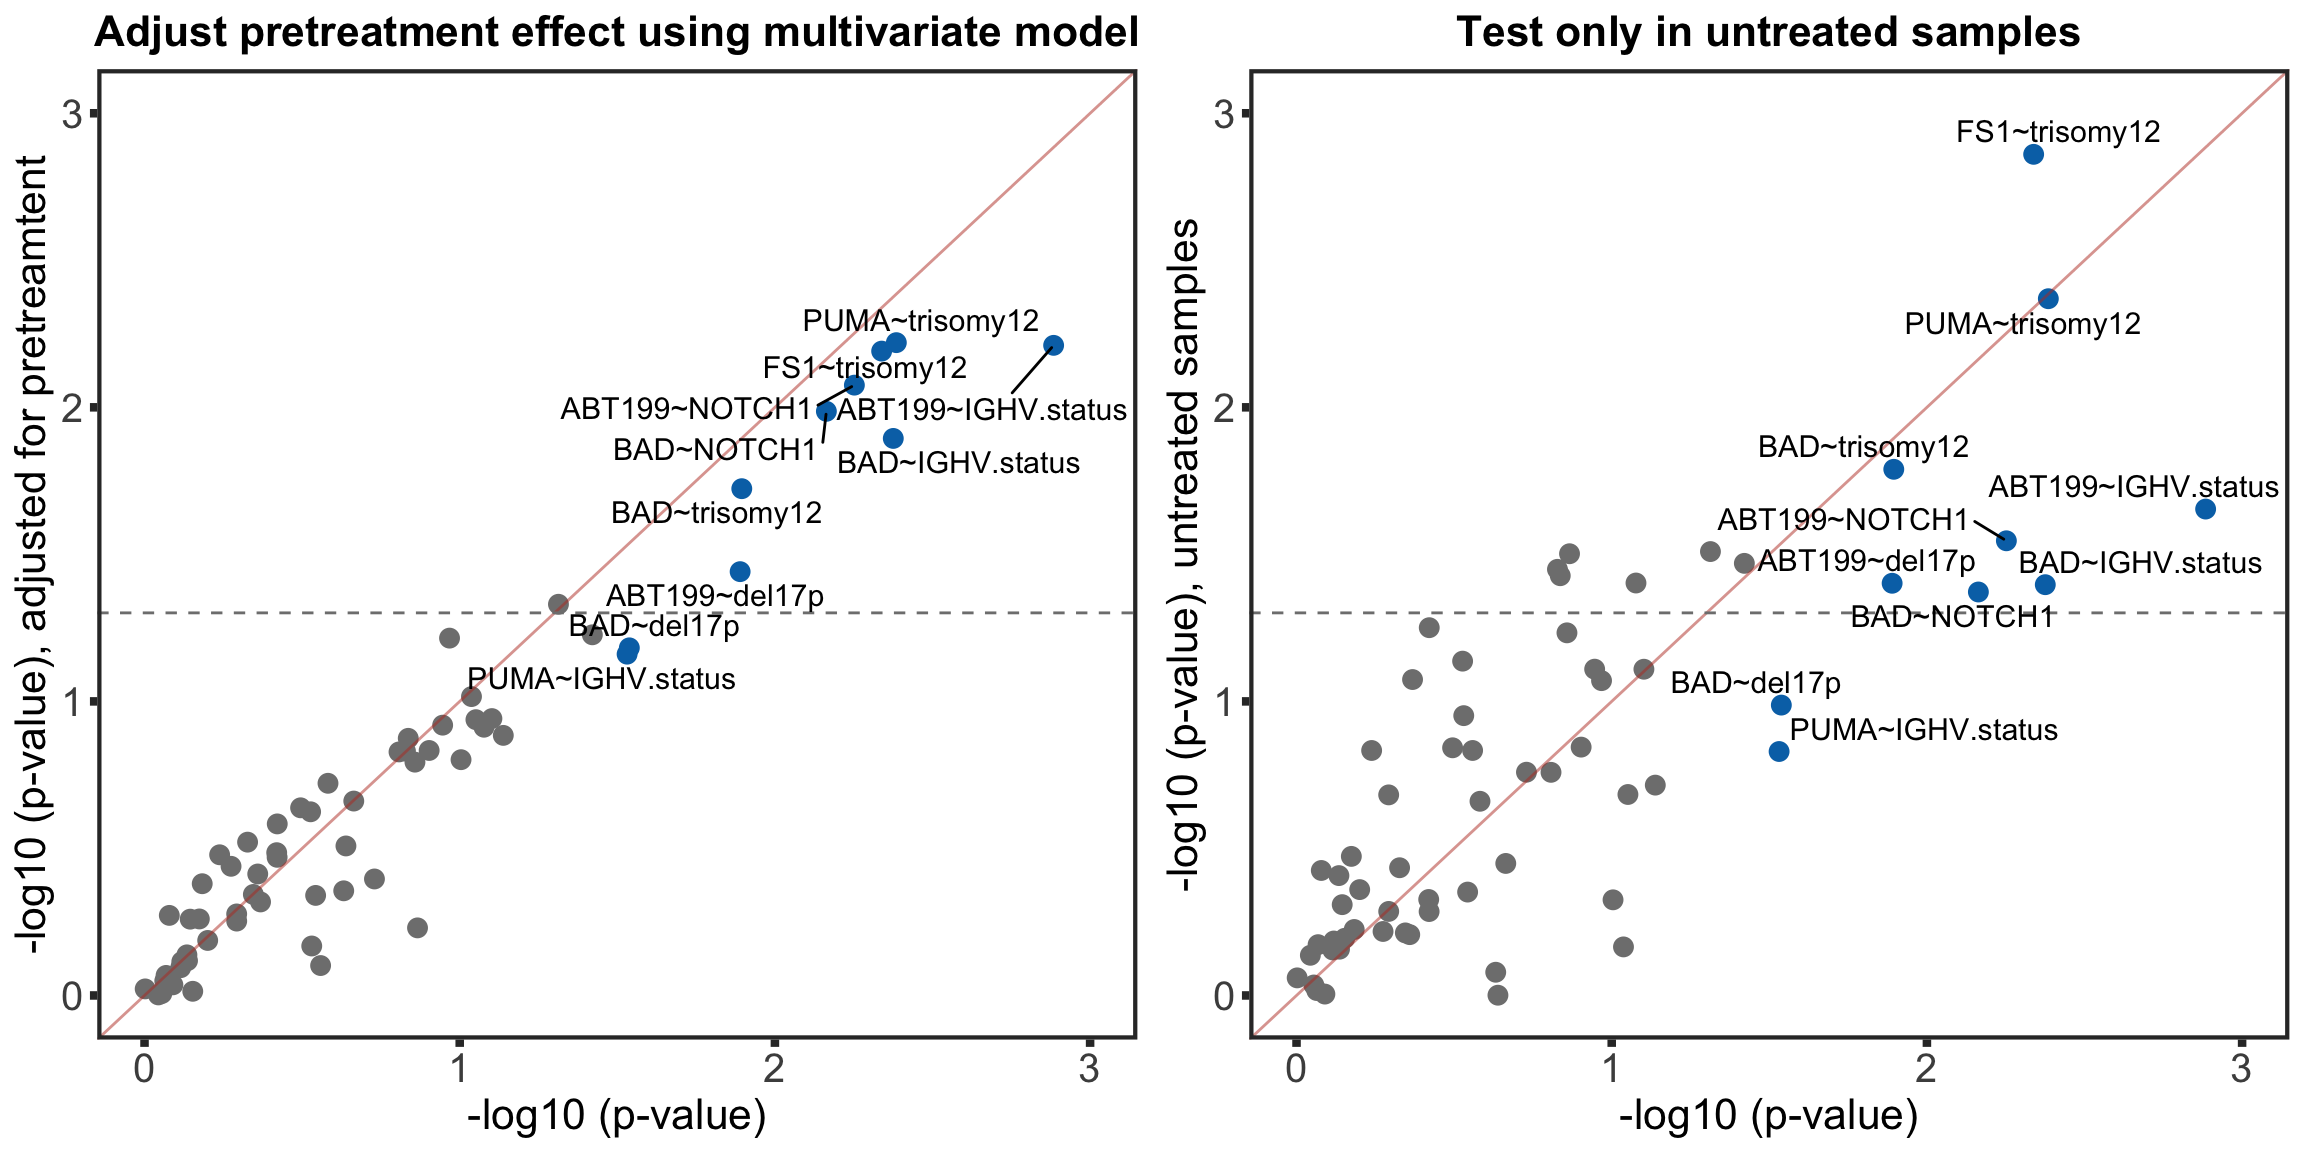
55 18 Adjust for pretreatment status
Test for Genomics
Methylation cluster
Combine
Test only in untreated
Test for Genomics
Methylation cluster
Table for comparing results
Association with transcriptomics
Preprocessing
RNAseq
BH3 profiling
Association test for each feature
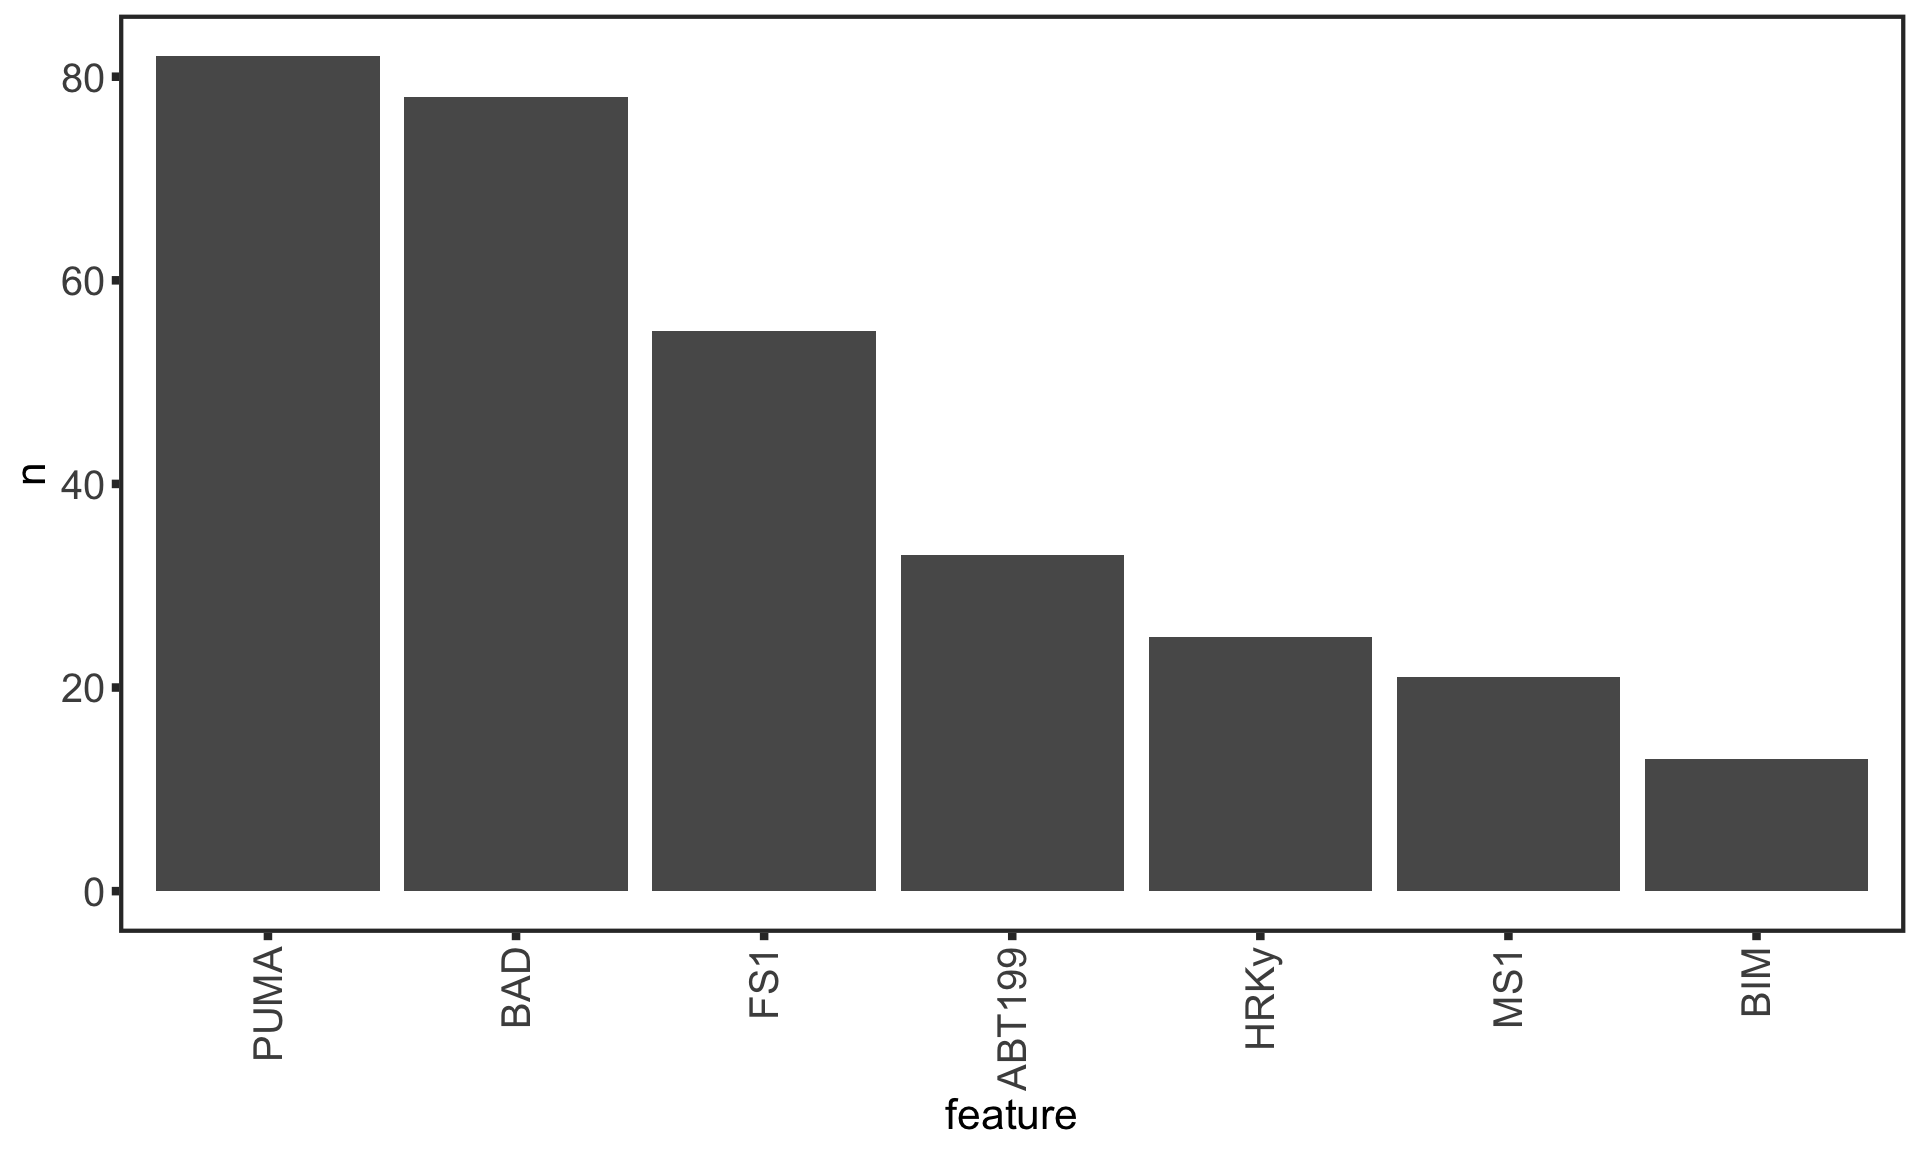
Number of significant associations per feature (10% FDR)
# A tibble: 7 × 2
  feature     n
  <chr>   <int>
1 ABT199    110
2 BAD        64
3 BIM         0
4 FS1         0
5 HRKy        0
6 MS1         0
7 PUMA        0
Table of significant associations
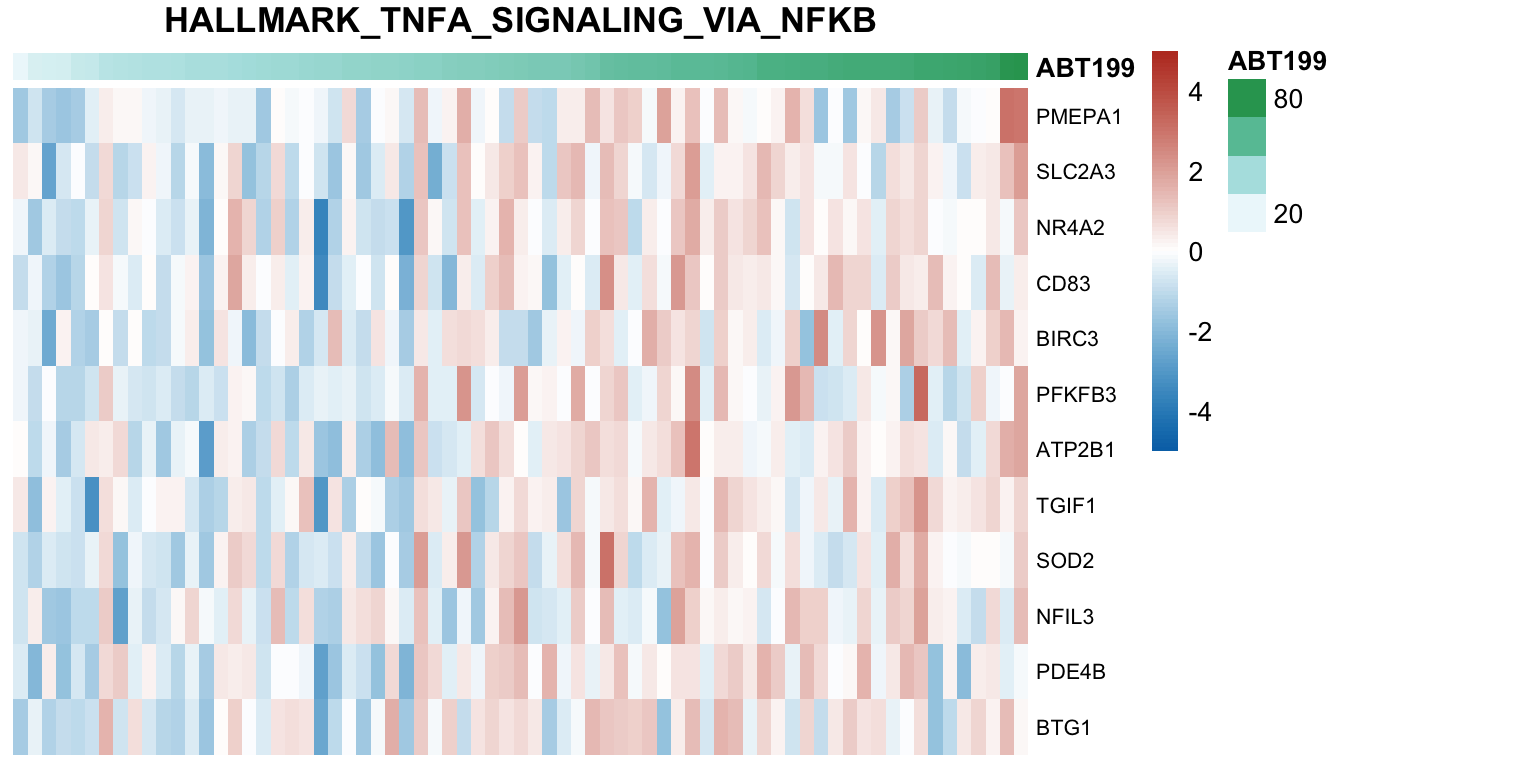
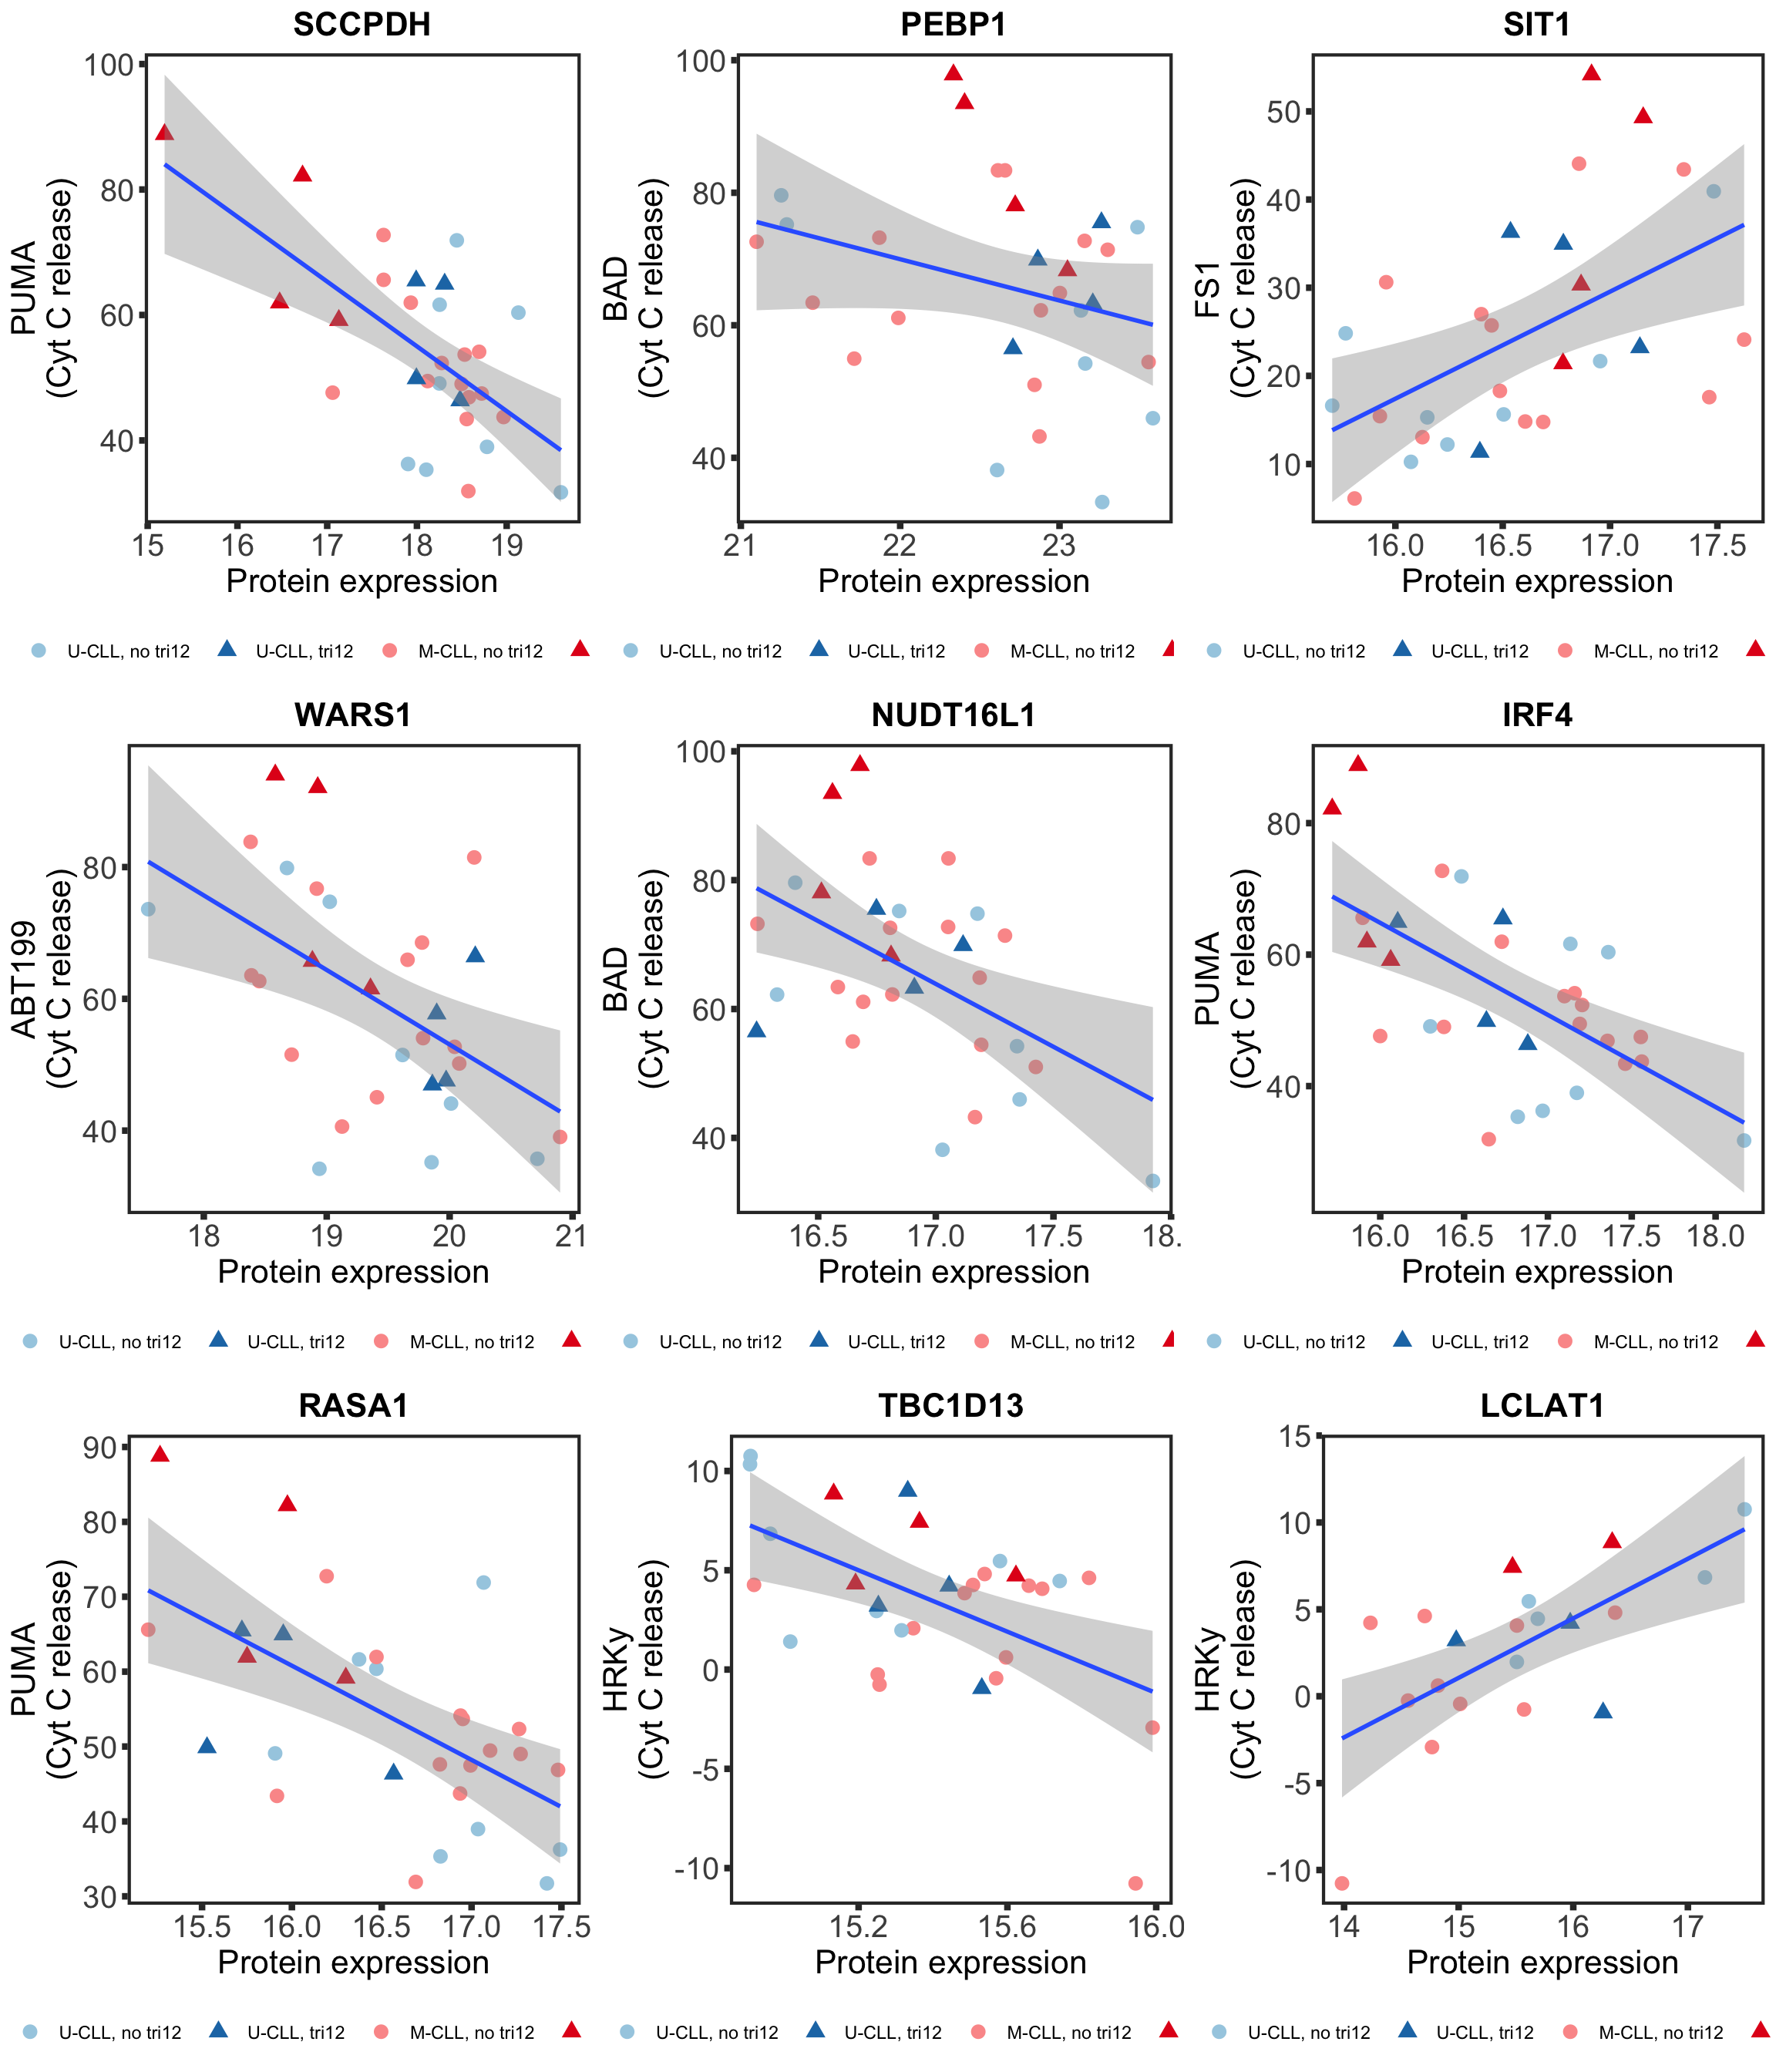
Heamap for significant correlations
Plot top 9 significant associations
Plot top 9 significant associations for ABT199
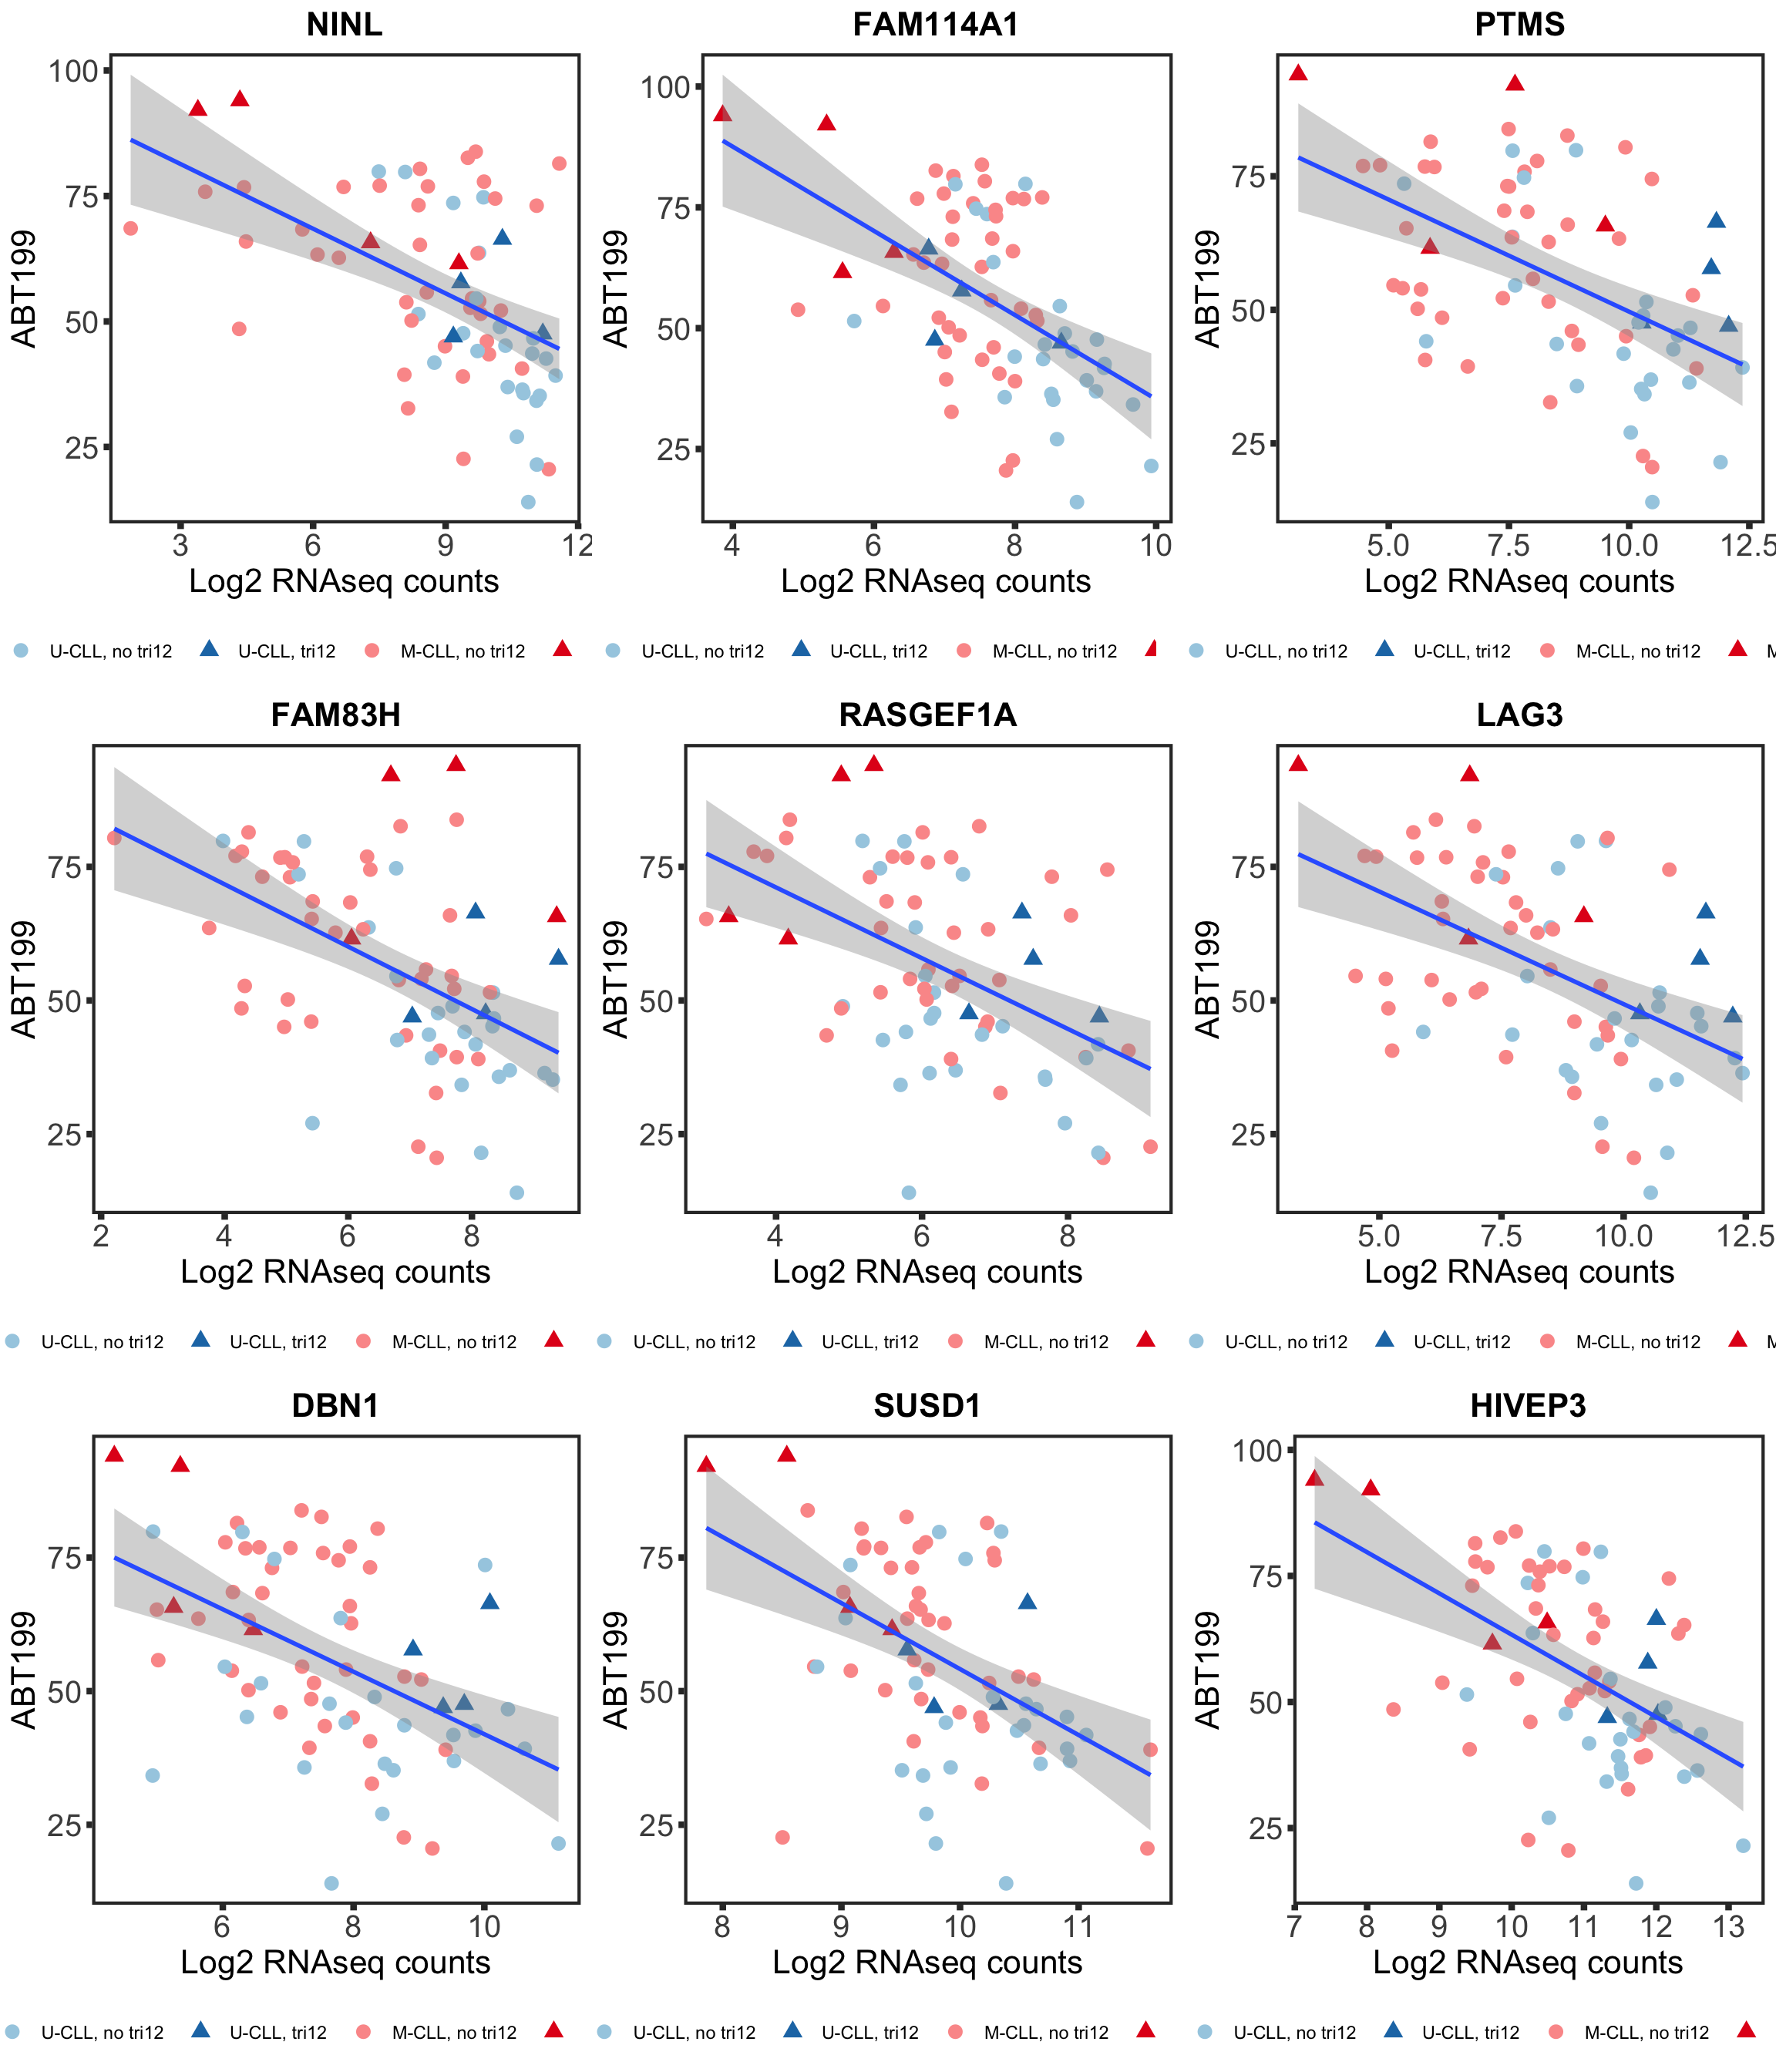
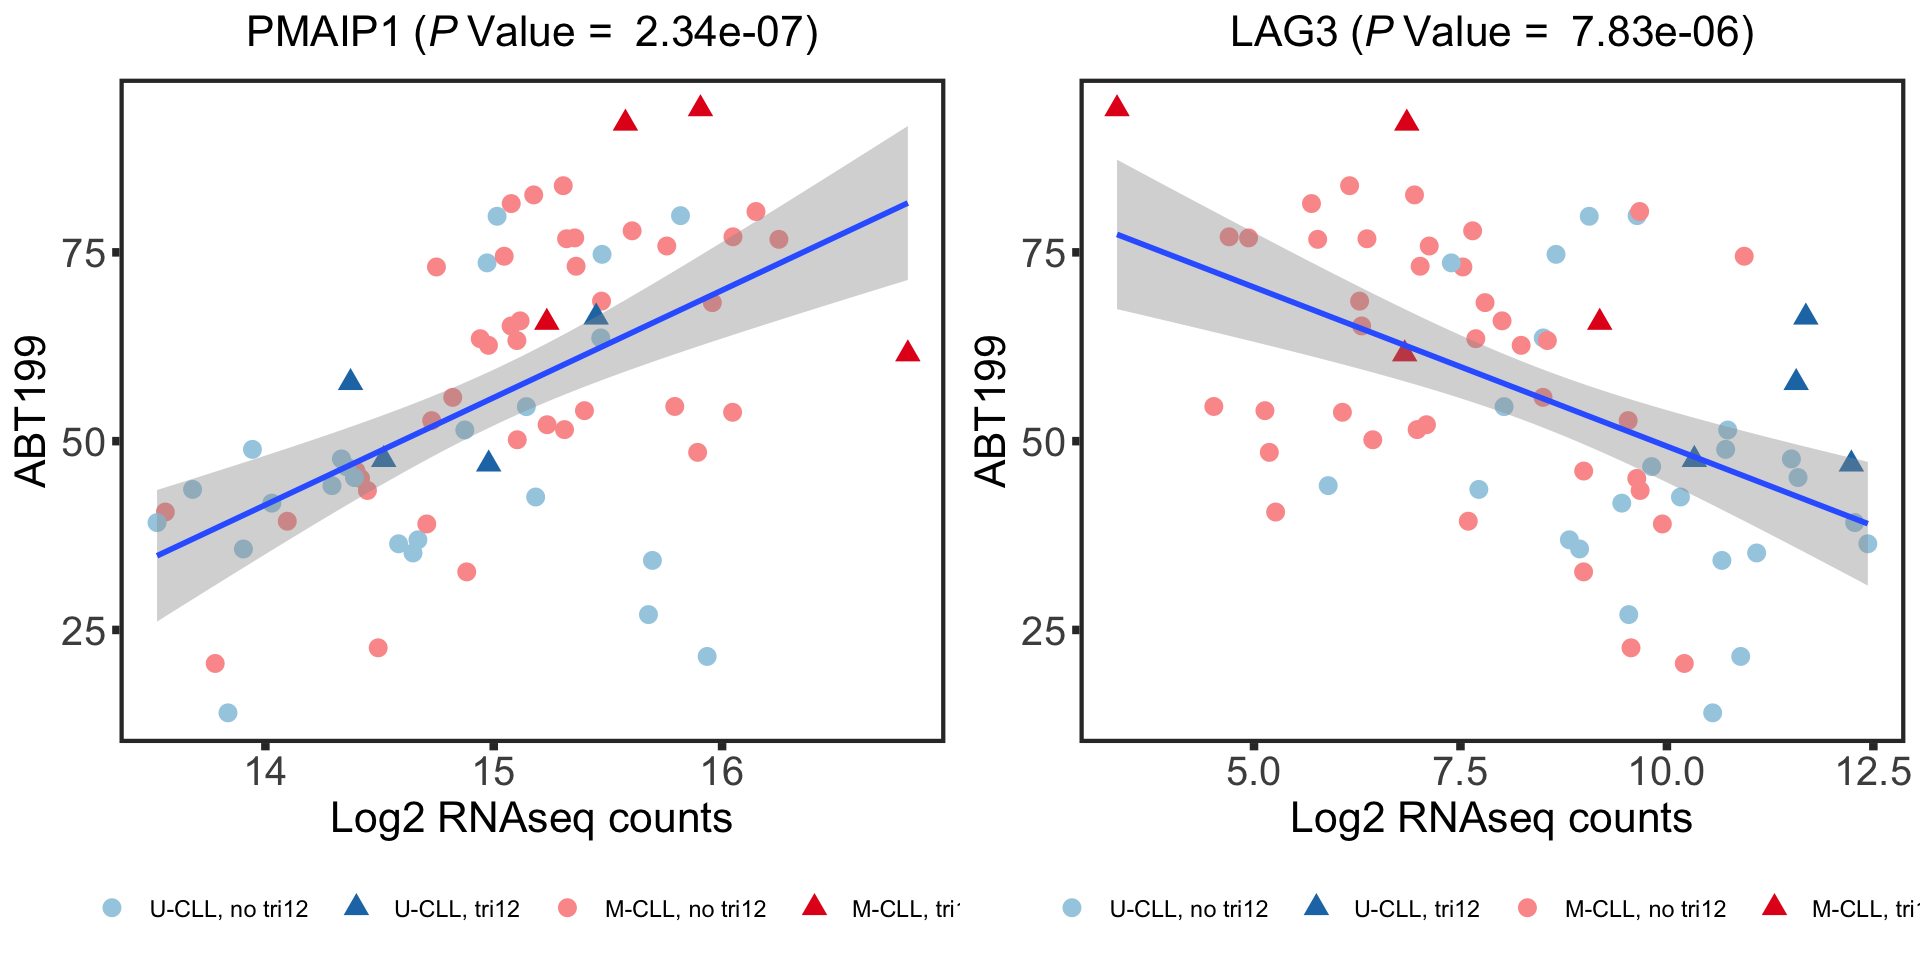
Plot selected associations
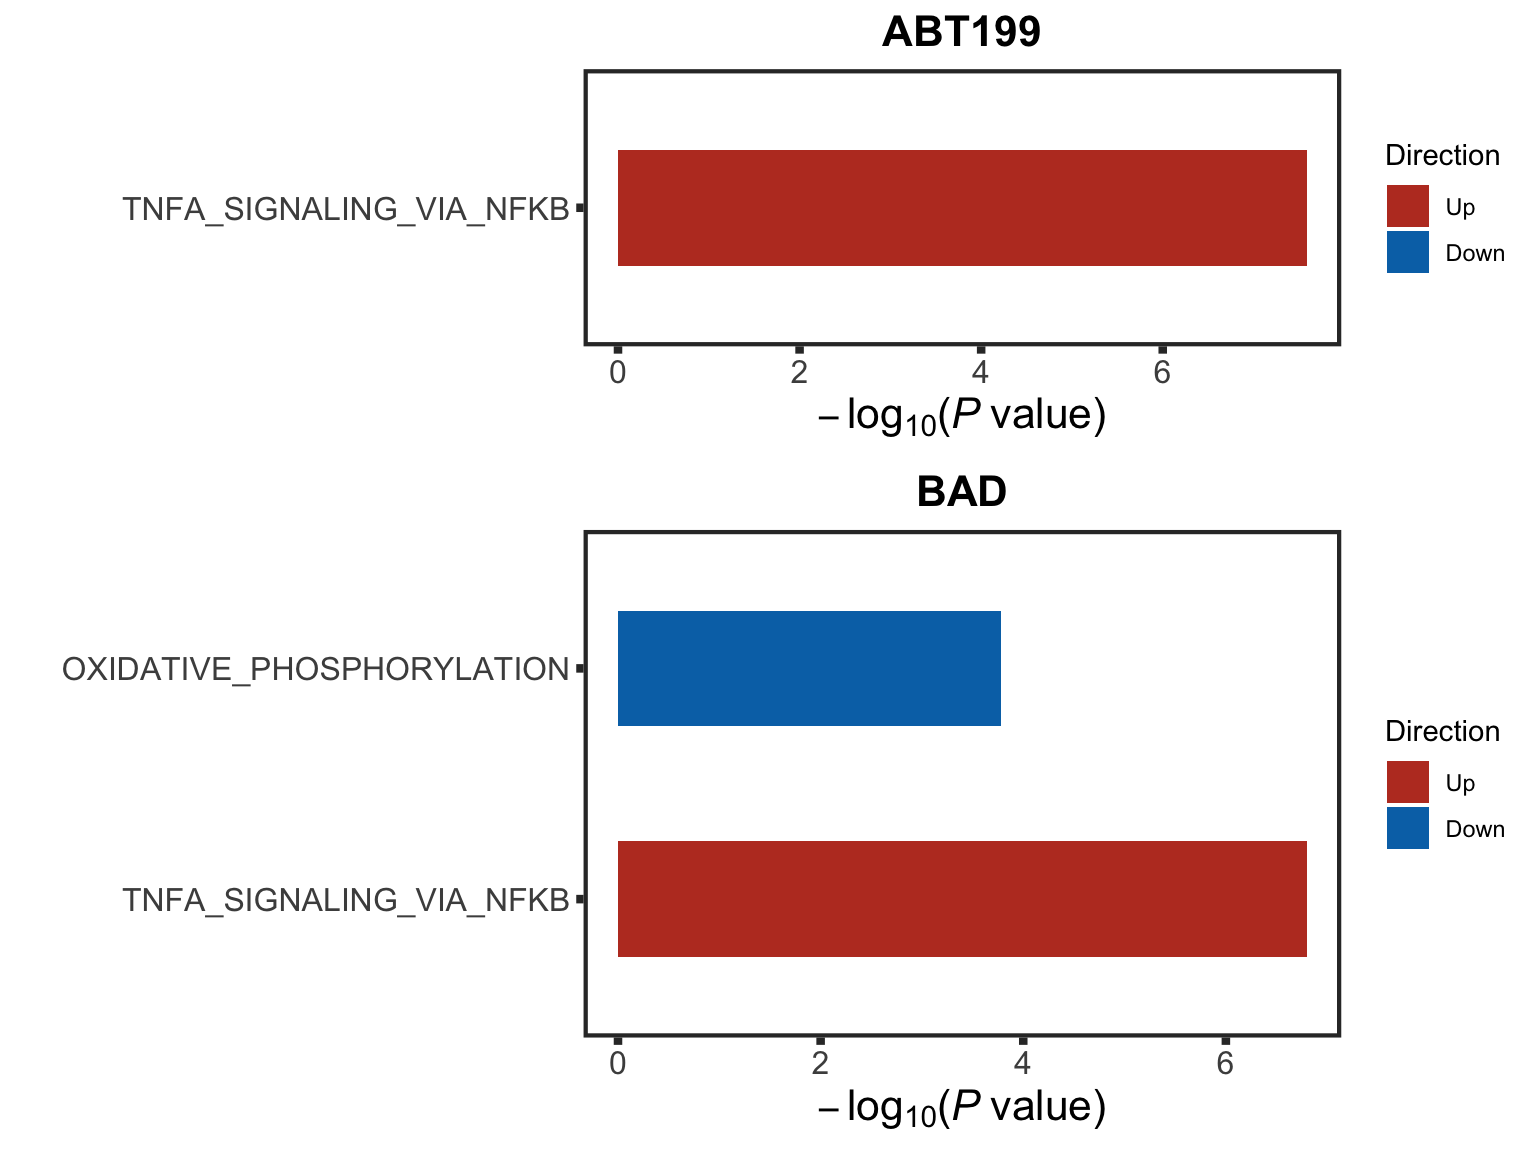
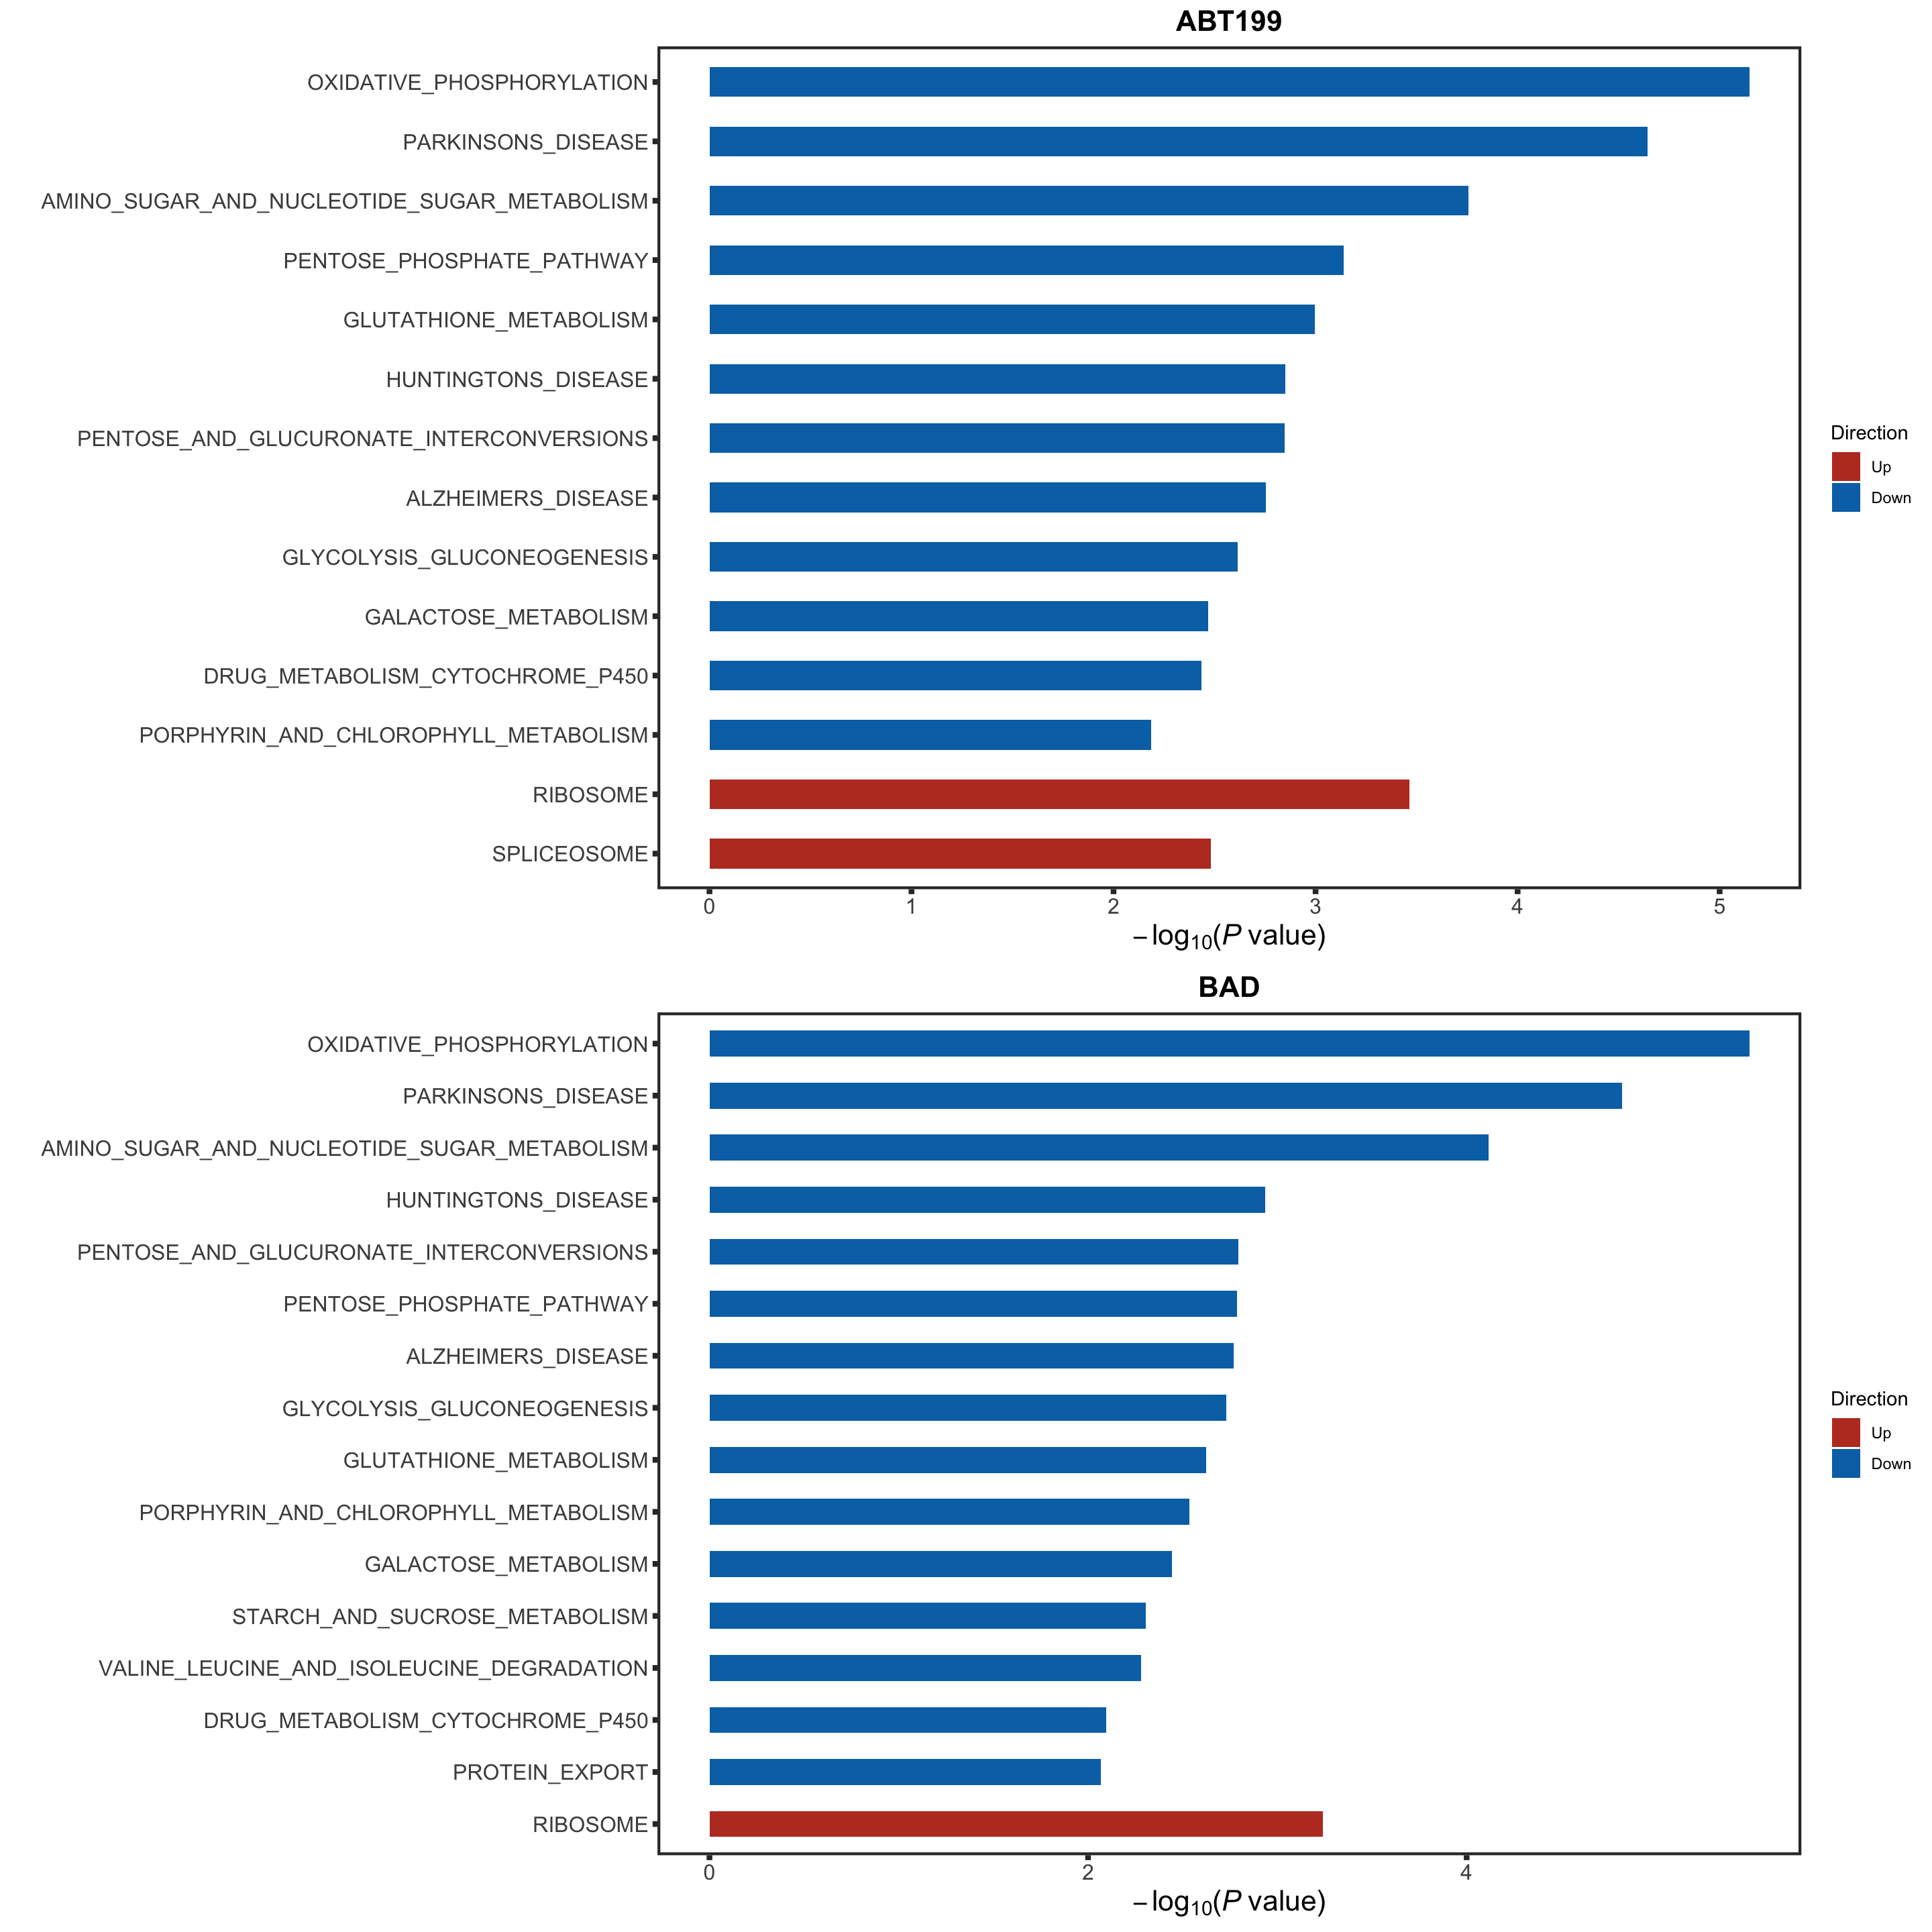
Pathway enrichment analysis for features that associate with gene expression
Cancer Hallmark
KEGG
Record siginificant RNAs for later feature selection
Gene set heatmap
Association with proteomics
Preprocessing
Proteomics
[1] 3314 30BH3 profiling
Association test for each feature
Number of significant associations per feature (10% FDR)
 None passed 10% FDR
Table of significant associations (P<0.01)
Plot top 9 associations
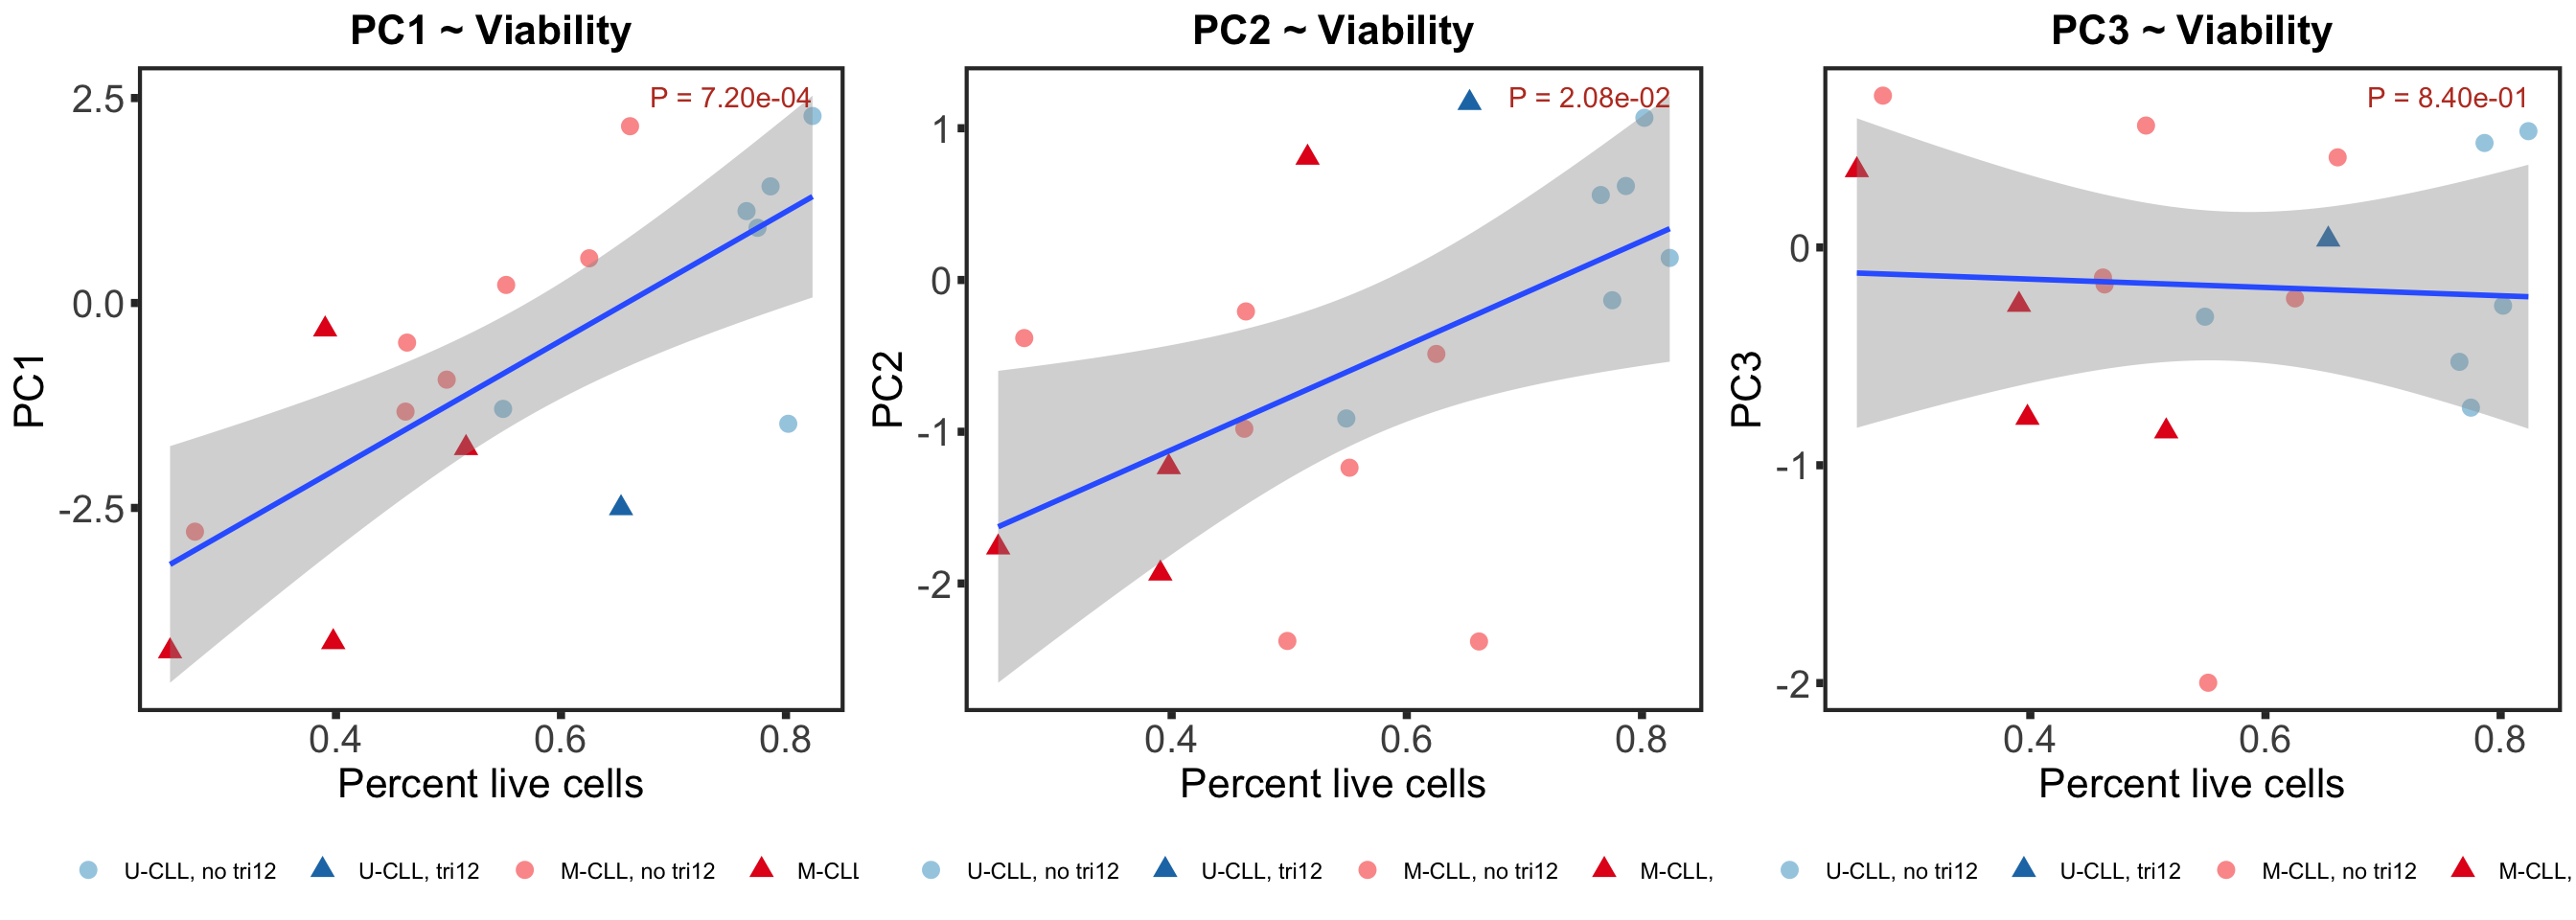
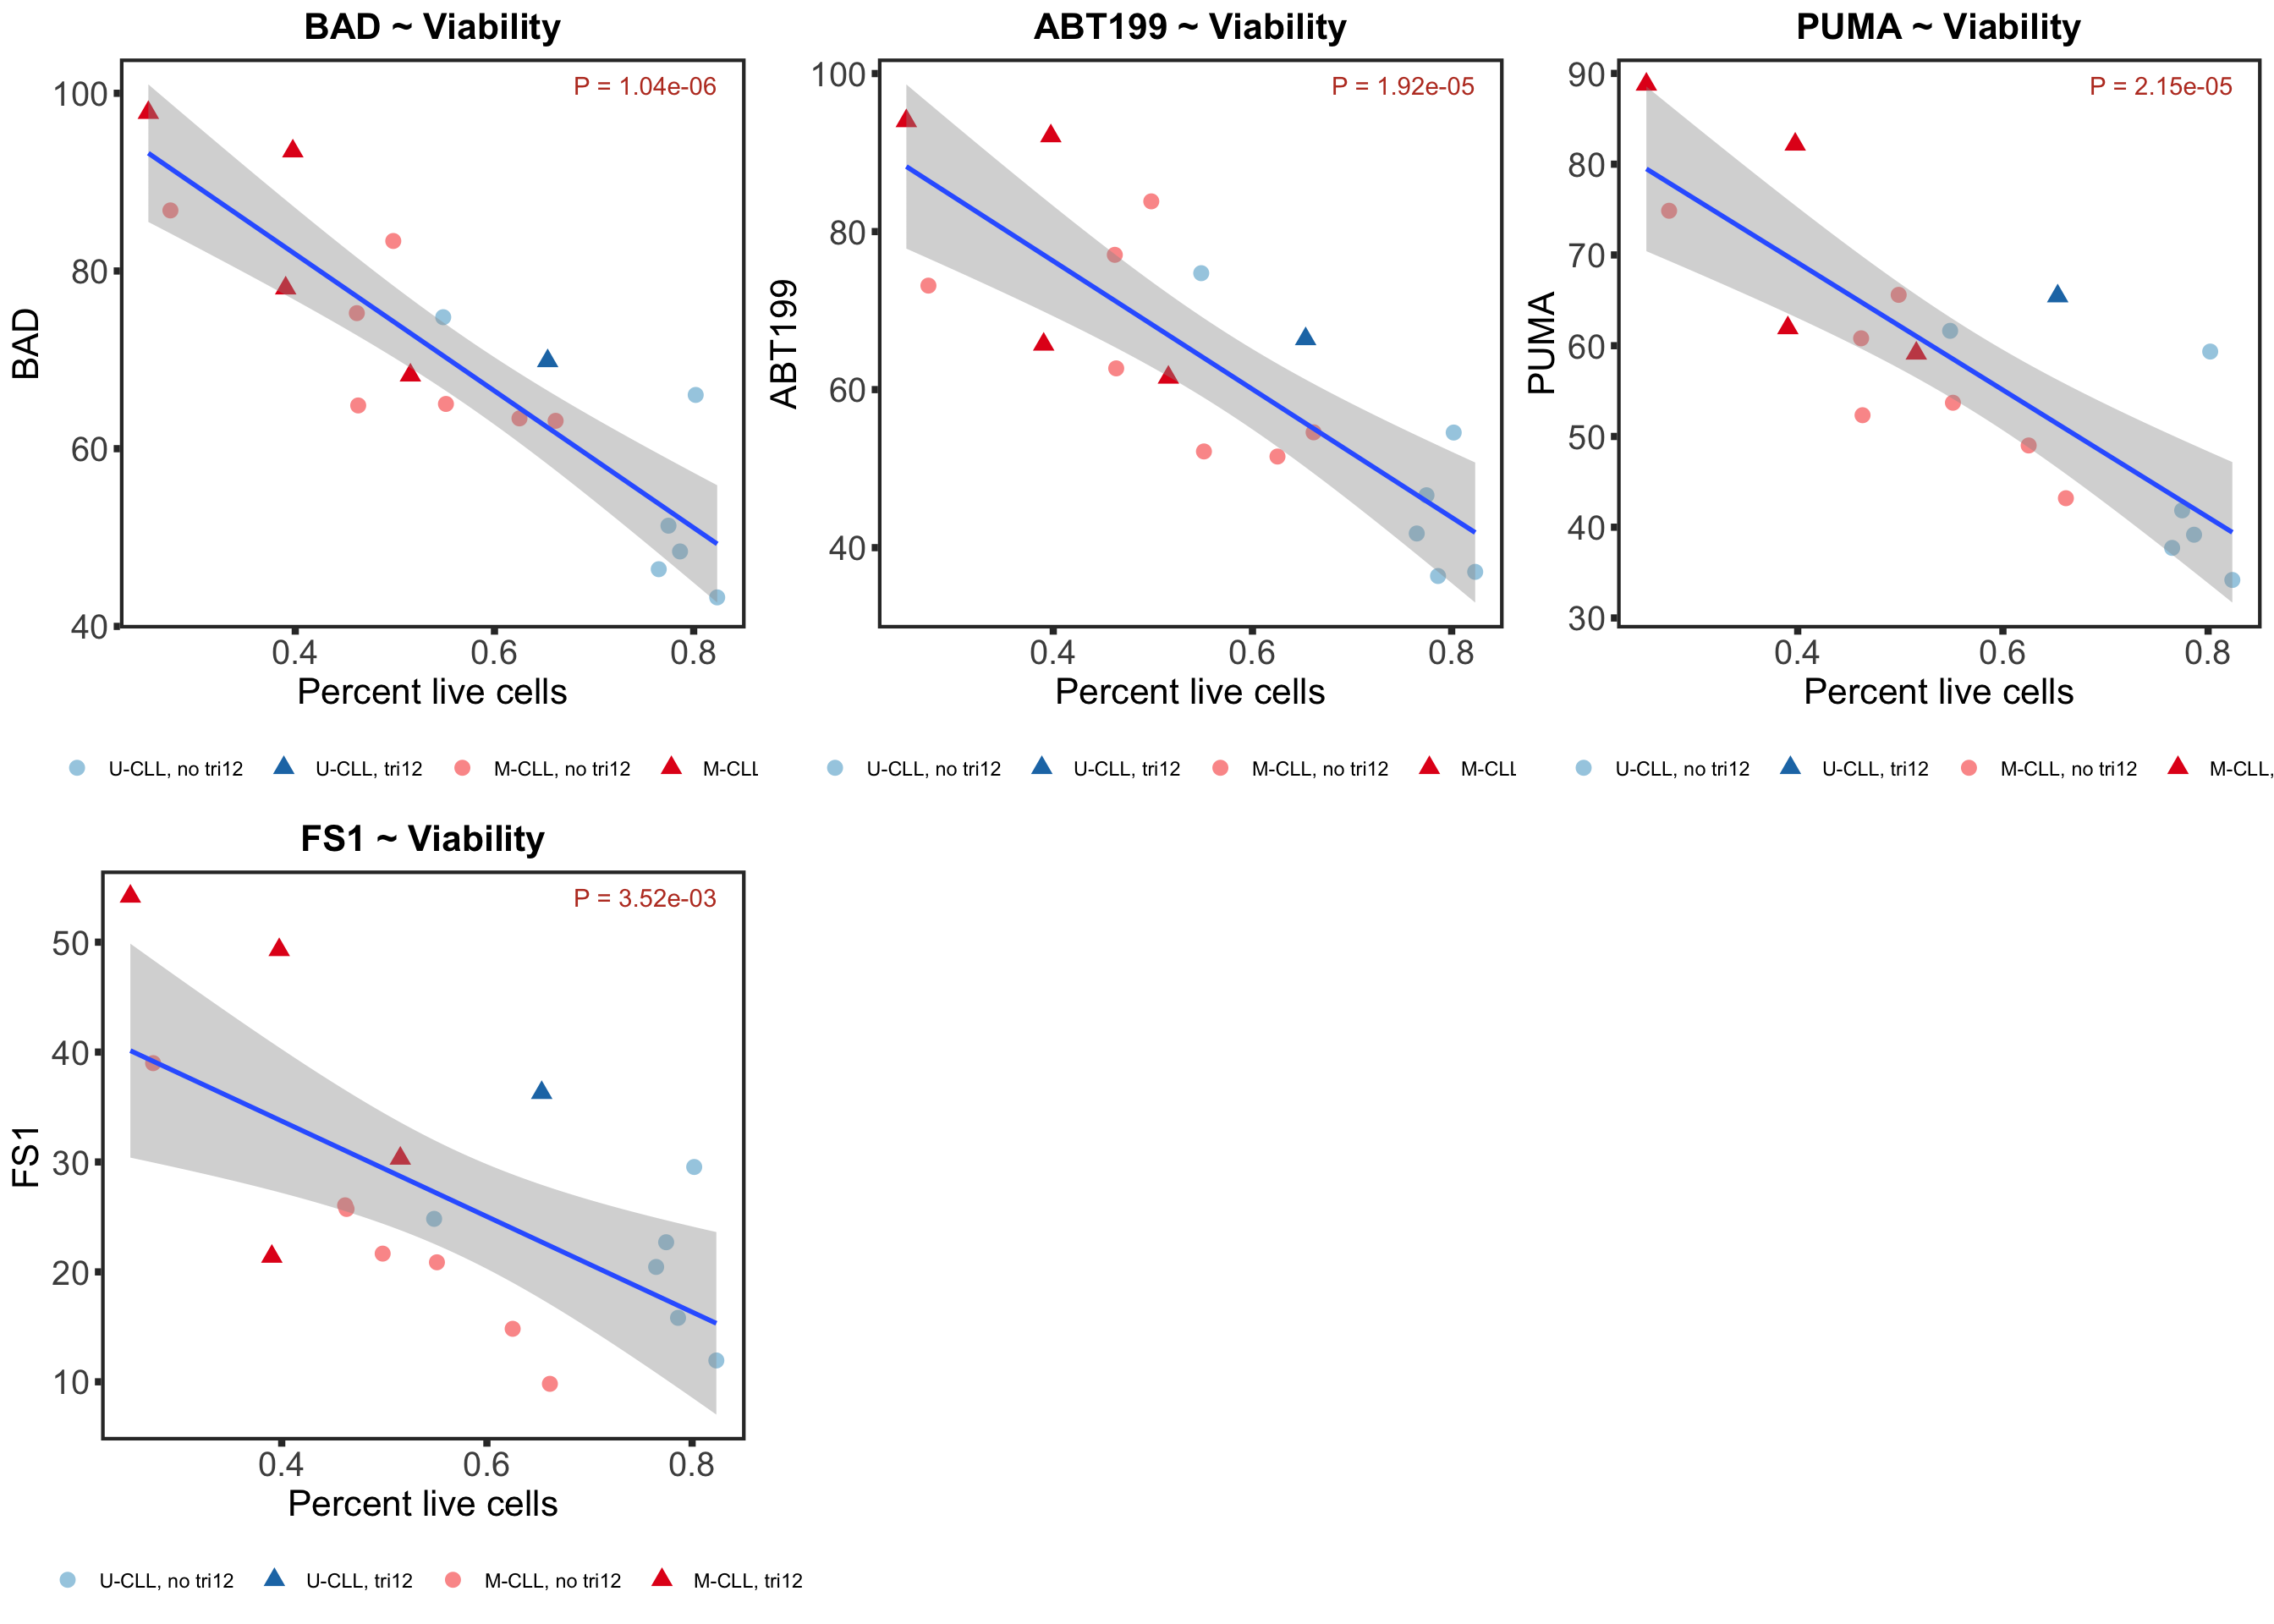
Association with the spontaneous apoptosis of CLL cells
Measured by image data
PCs
Individual peptide
If multiple concentrations are identified as significant, only show
the most significant concentration.
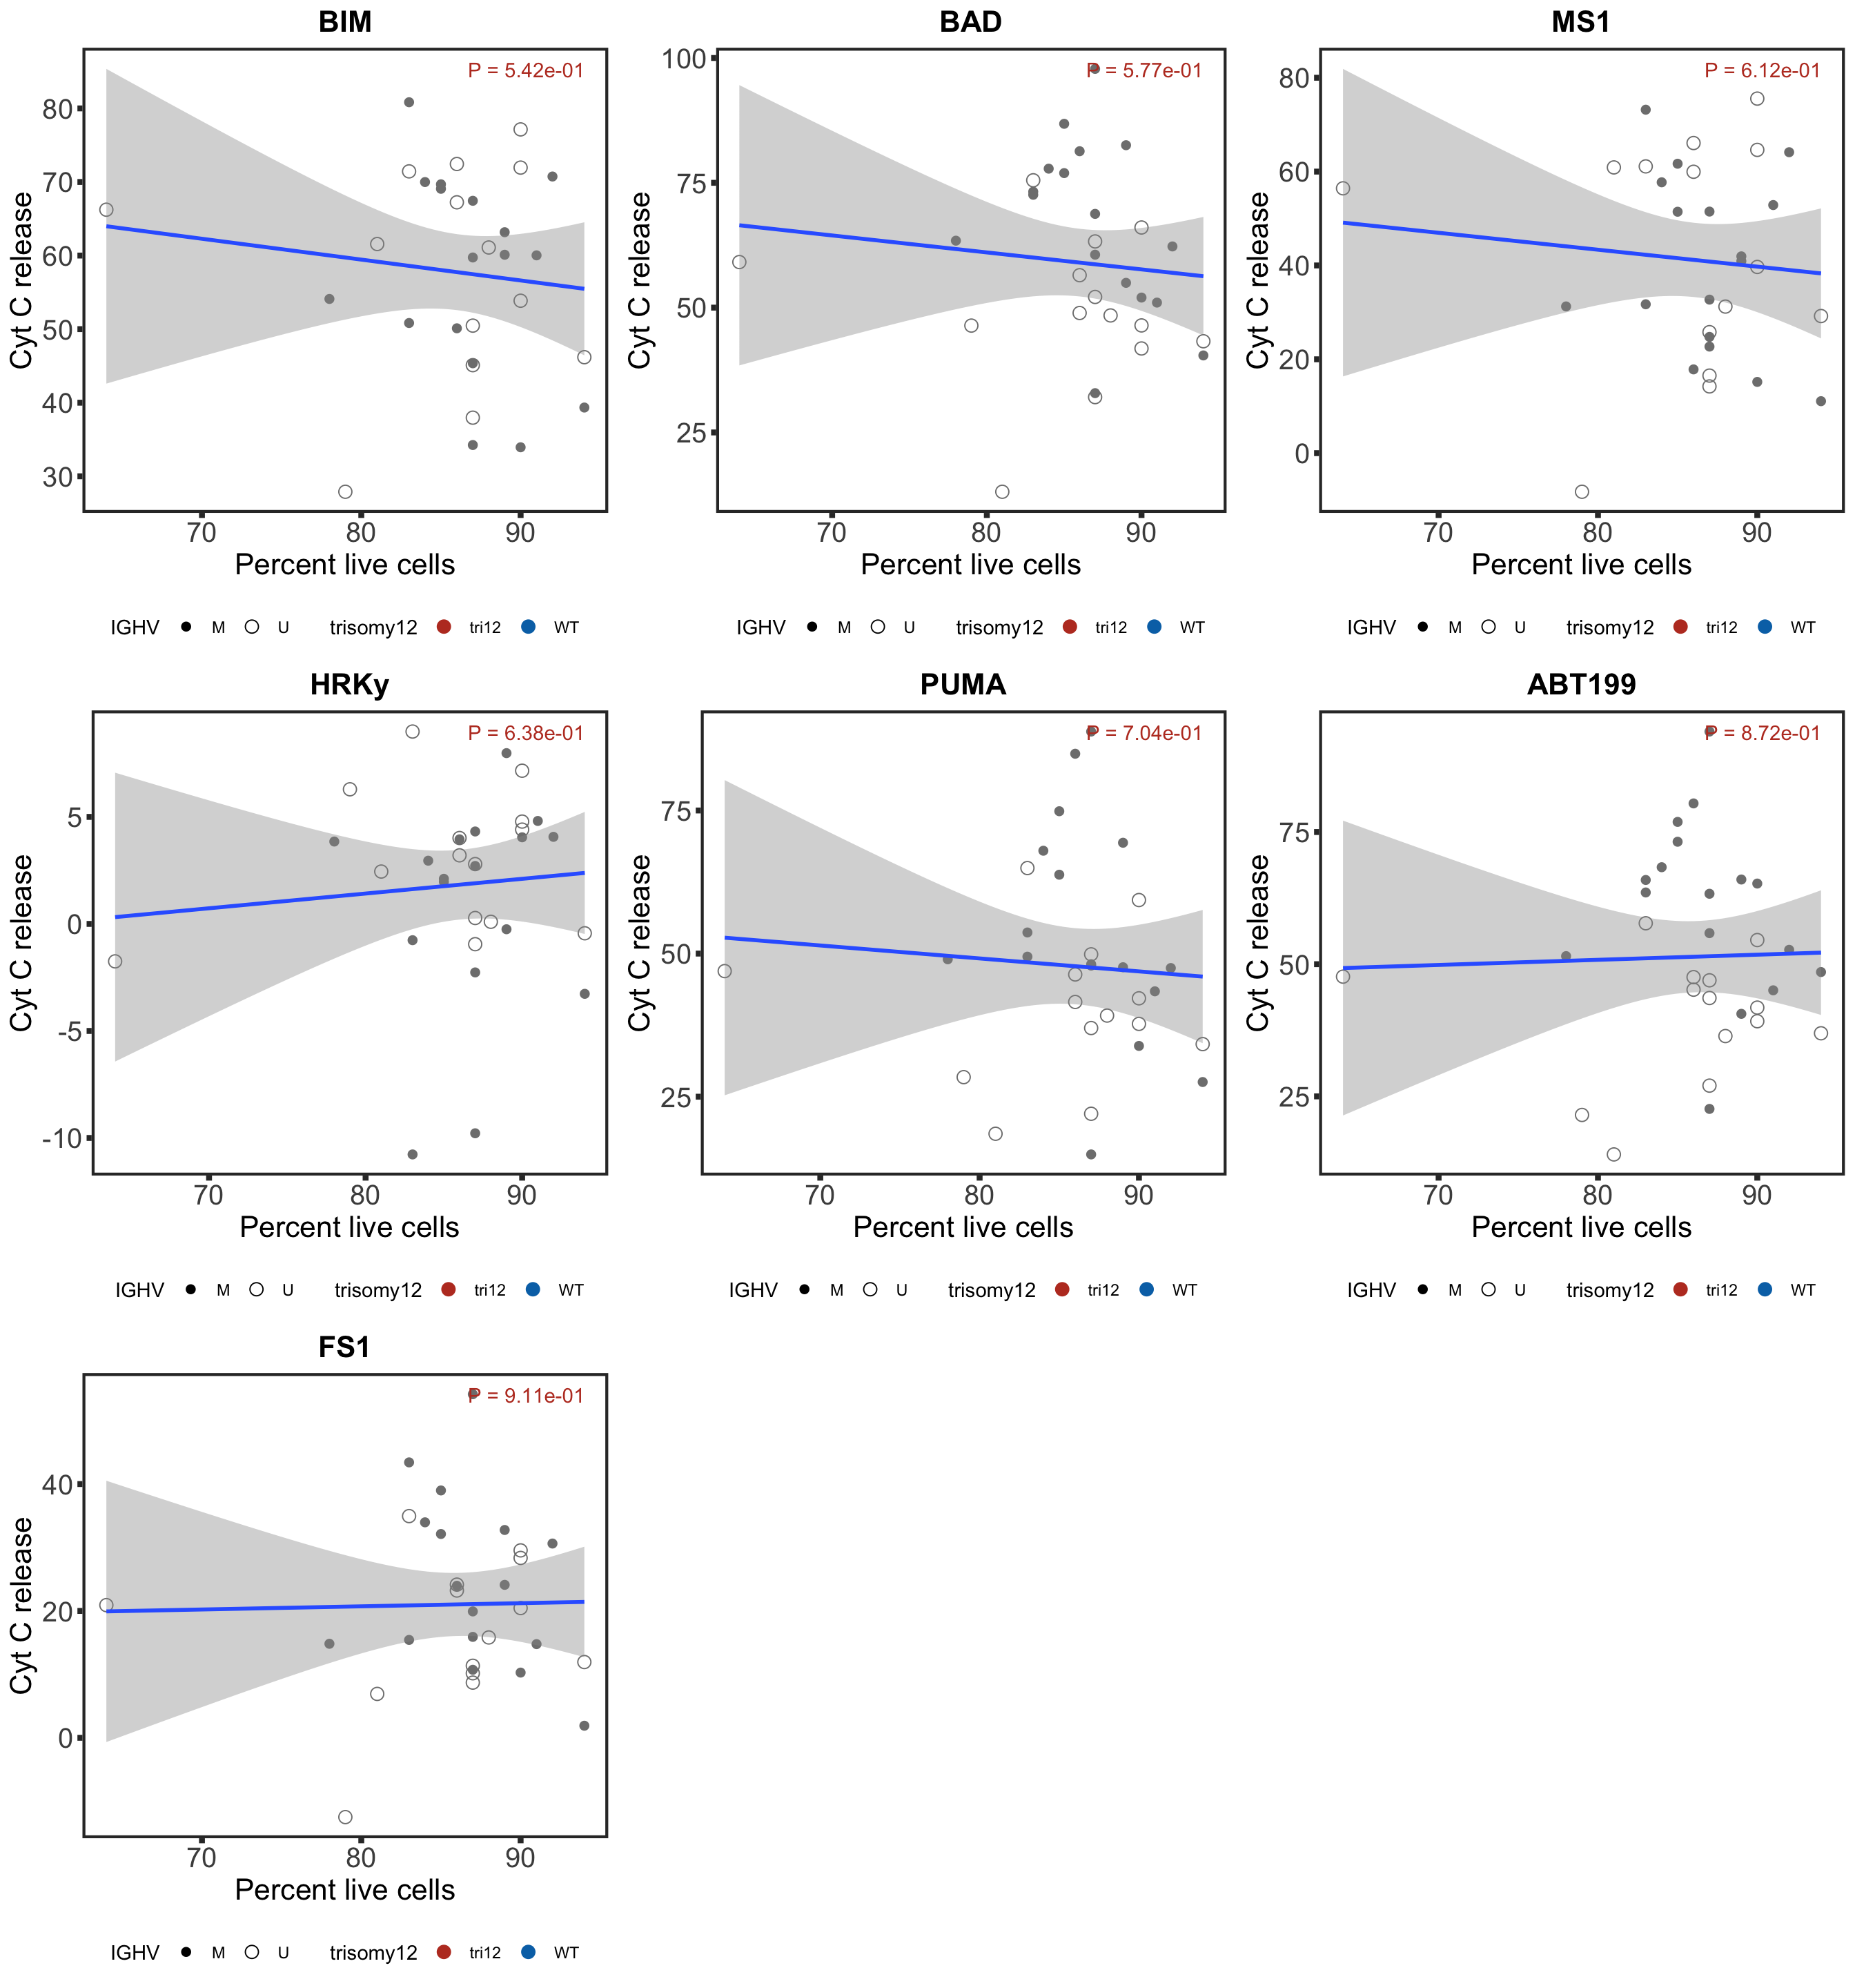
Association with basline Annexin data
    P.Value        coef feature adj.P.Val peptide  conc concIndex
1 0.5419874 -0.11384658     BIM 0.9110941     BIM 5e-03         1
2 0.5769504 -0.10420050     BAD 0.9110941     BAD 5e-02         1
3 0.6122063 -0.09473453     MS1 0.9110941     MS1 1e+01         1
4 0.6383630  0.08785945    HRKy 0.9110941    HRKy 1e+01         1
5 0.7044989 -0.07094563    PUMA 0.9110941    PUMA 1e-01         1
6 0.8722659  0.03010788  ABT199 0.9110941  ABT199 1e-02         1
7 0.9110941  0.02091168     FS1 0.9110941     FS1 1e+01         1
No significant correlations?
Association between baseline ATP levels of cells and BH3 profile
The baseline ATP levels represent the cell viability without any drug treatment in our screen. There are three features, ATP level at 0 hour, ATP level at 48 hour and the difference of those two values. These measurements can in some degree represent the intrinsic vulnerability/metabolic activity of the cells.
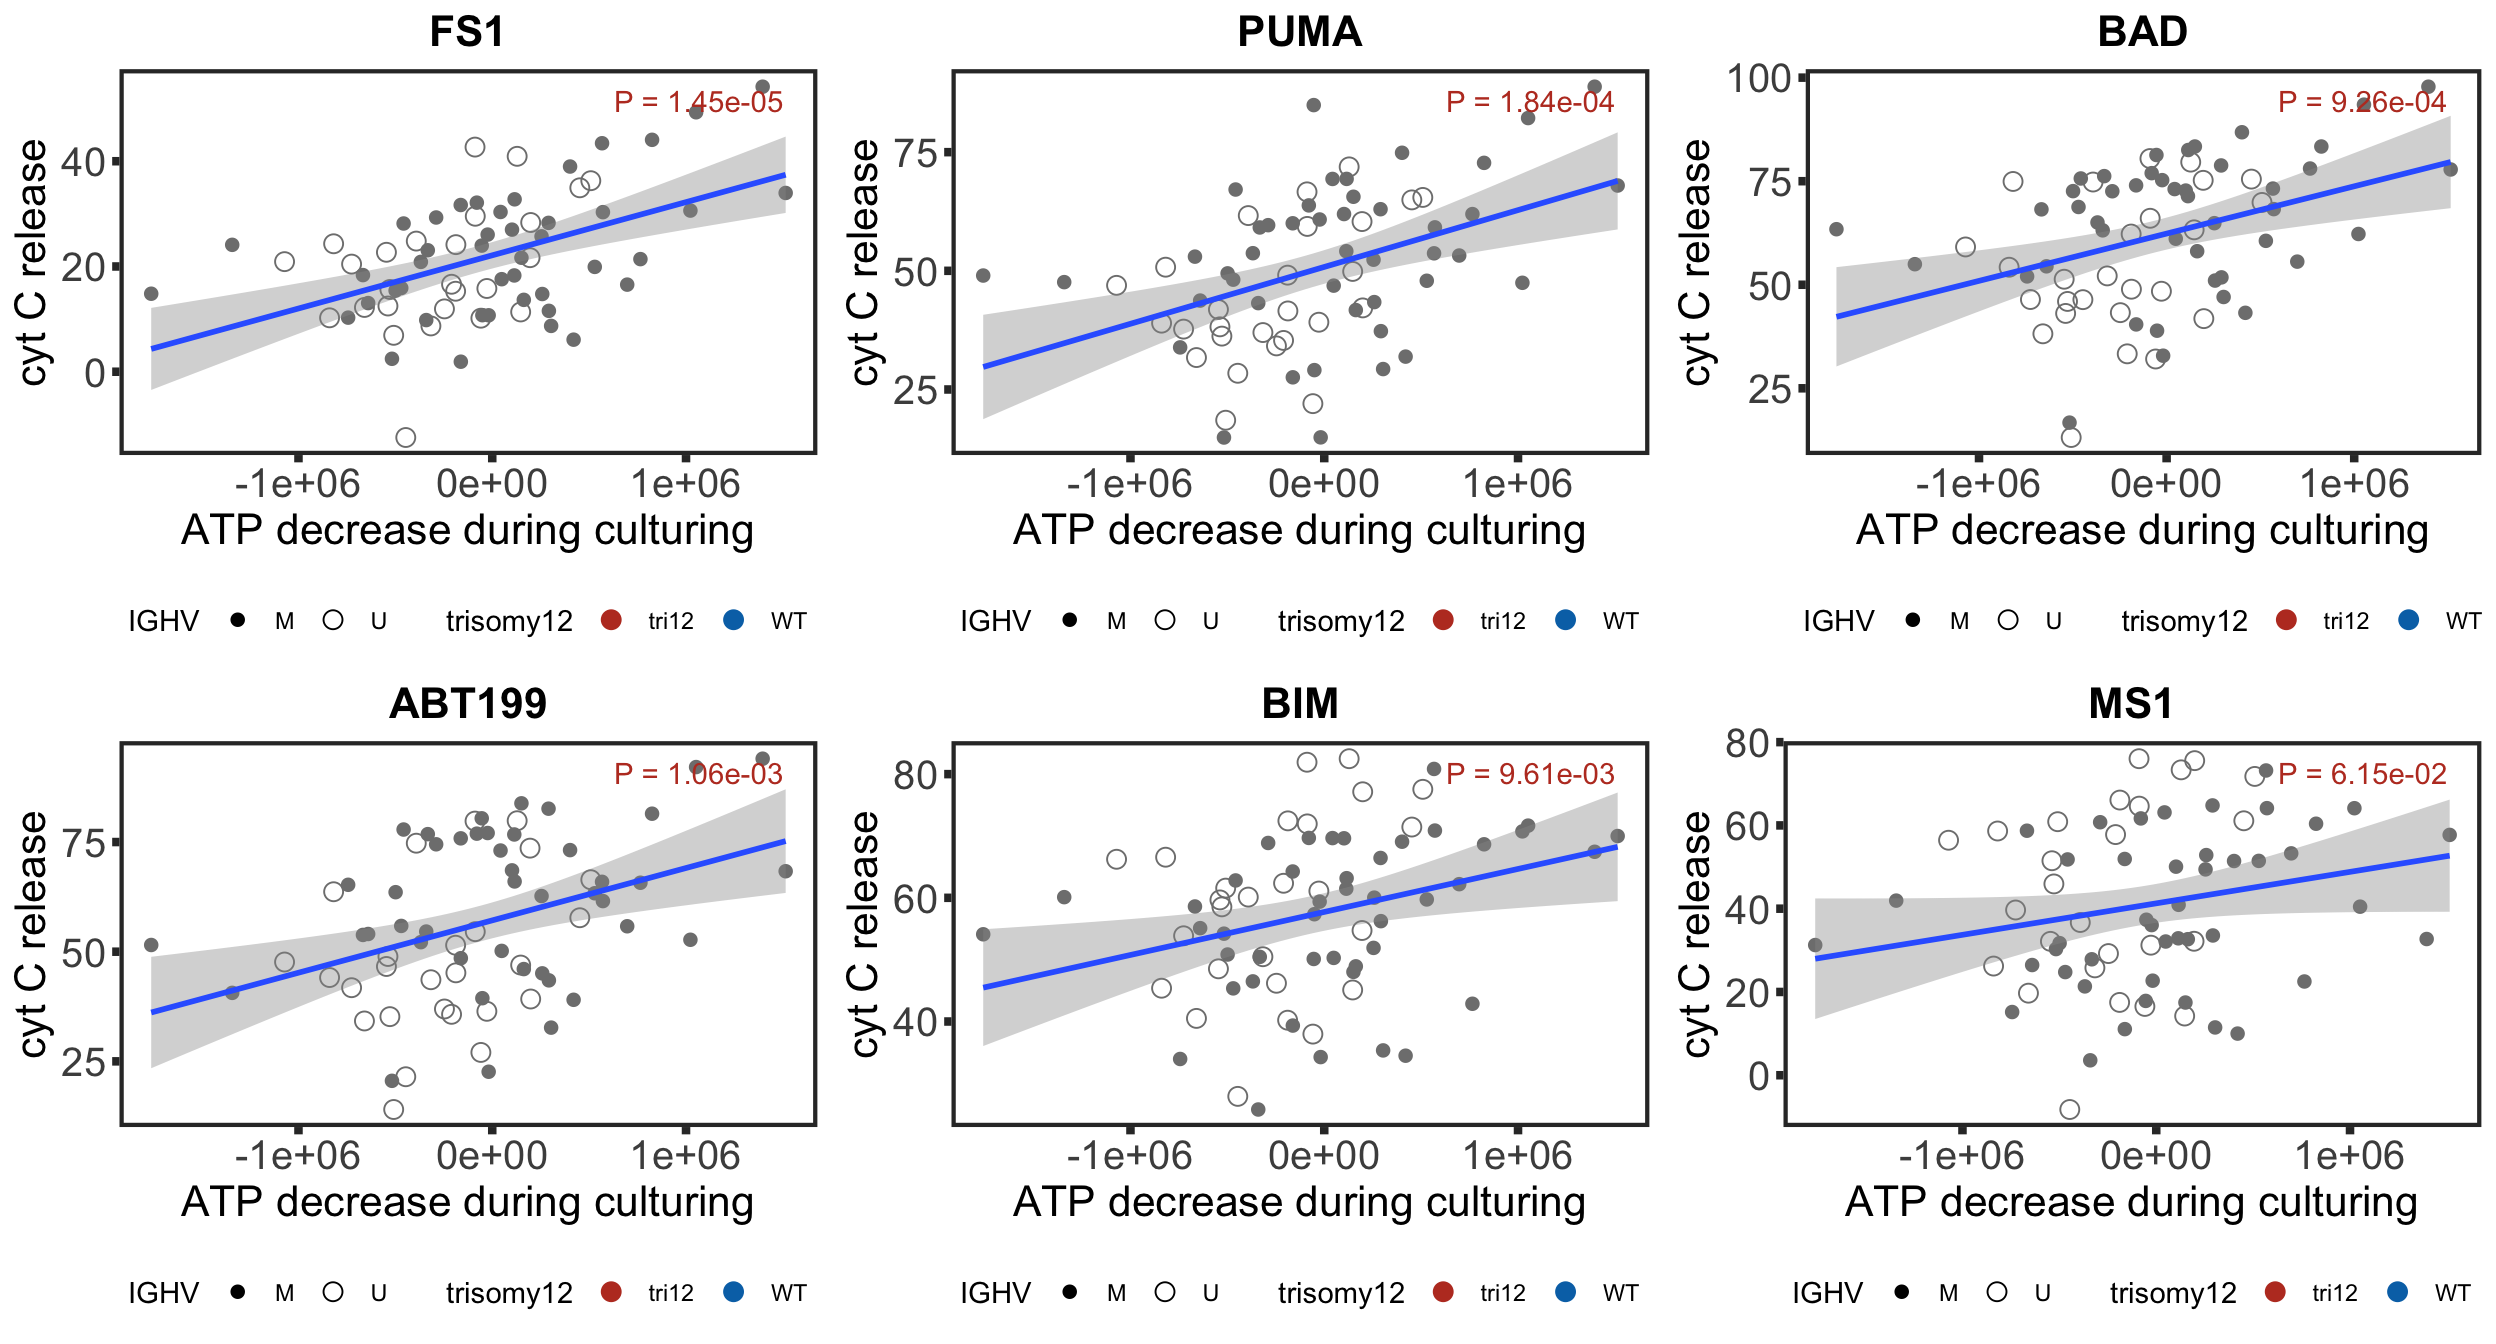 “ATP_diff” is the measurement of ATP loss during 48h culturing
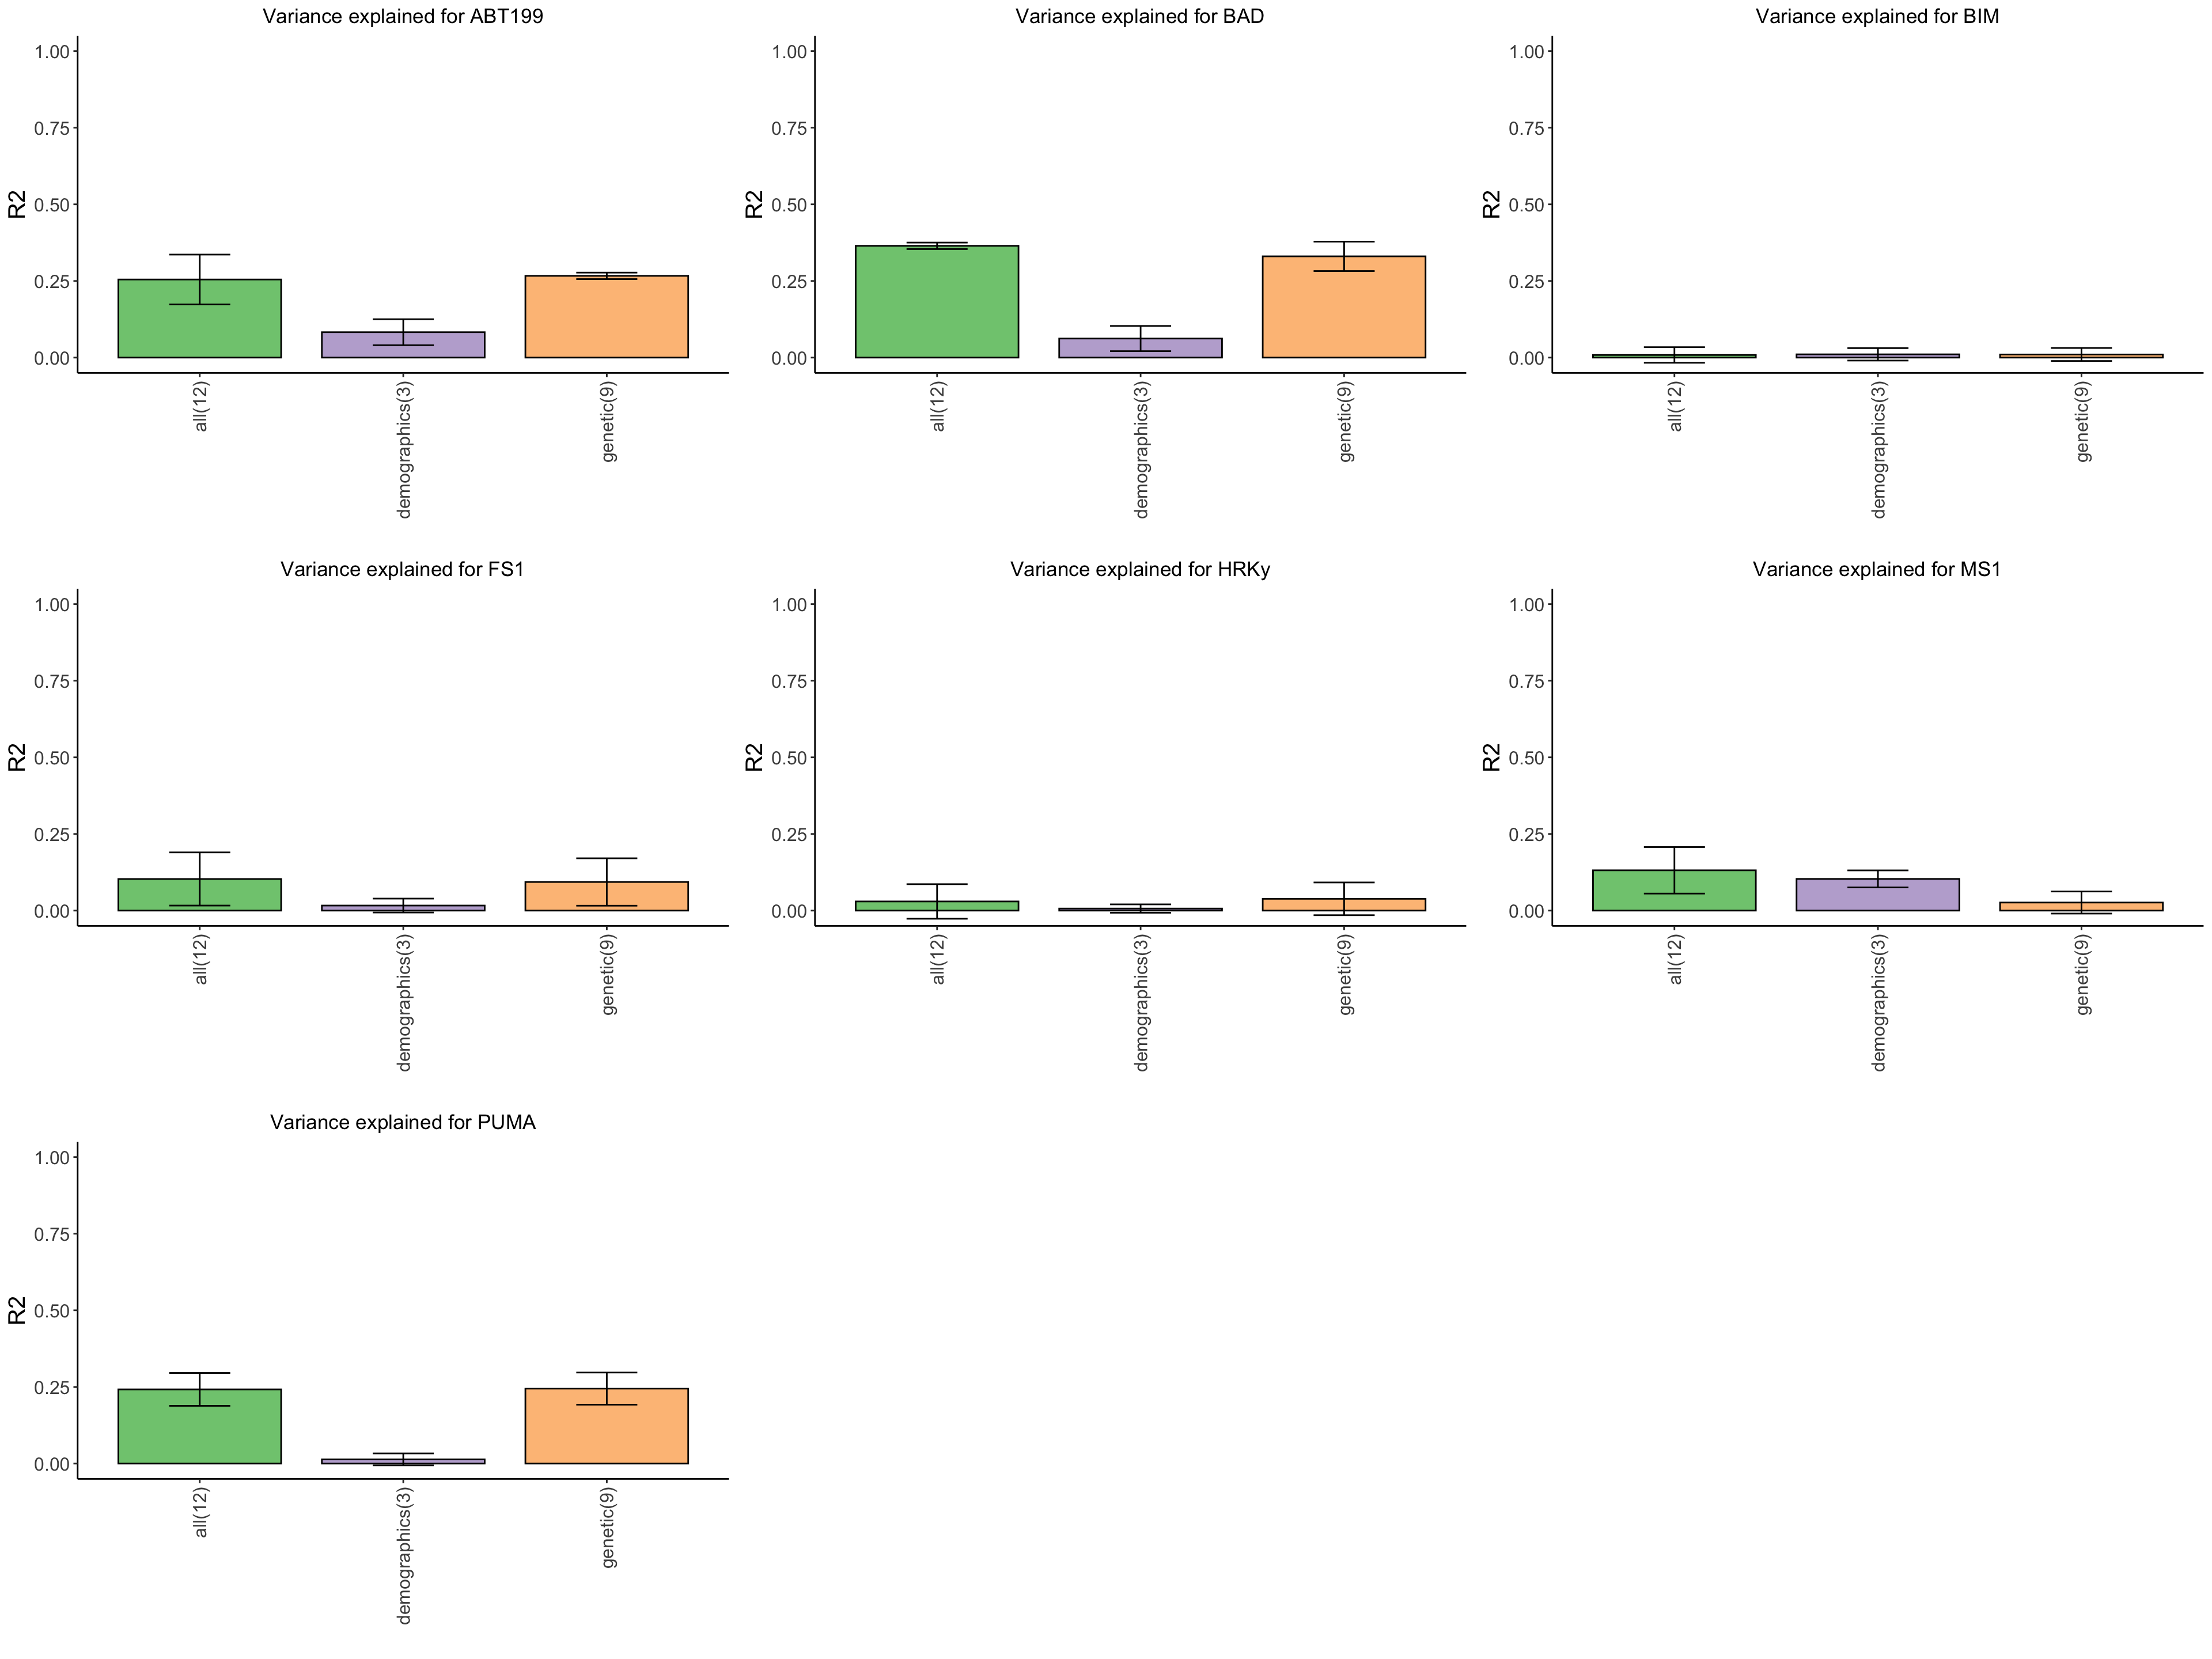
Multivariate feature selection for explaining BH3 profling in CLL
Data pre-processing
BH3 profiling
RNAseq
For genomic data
For demographic and clinical data
Function to Generate the explanatory dataset for each BH3 profile
Clean and integrate multi-omics data
Perform multi-variate regression
LASSO model
Training models
Function for multi-variate regression
Perform lasso regression
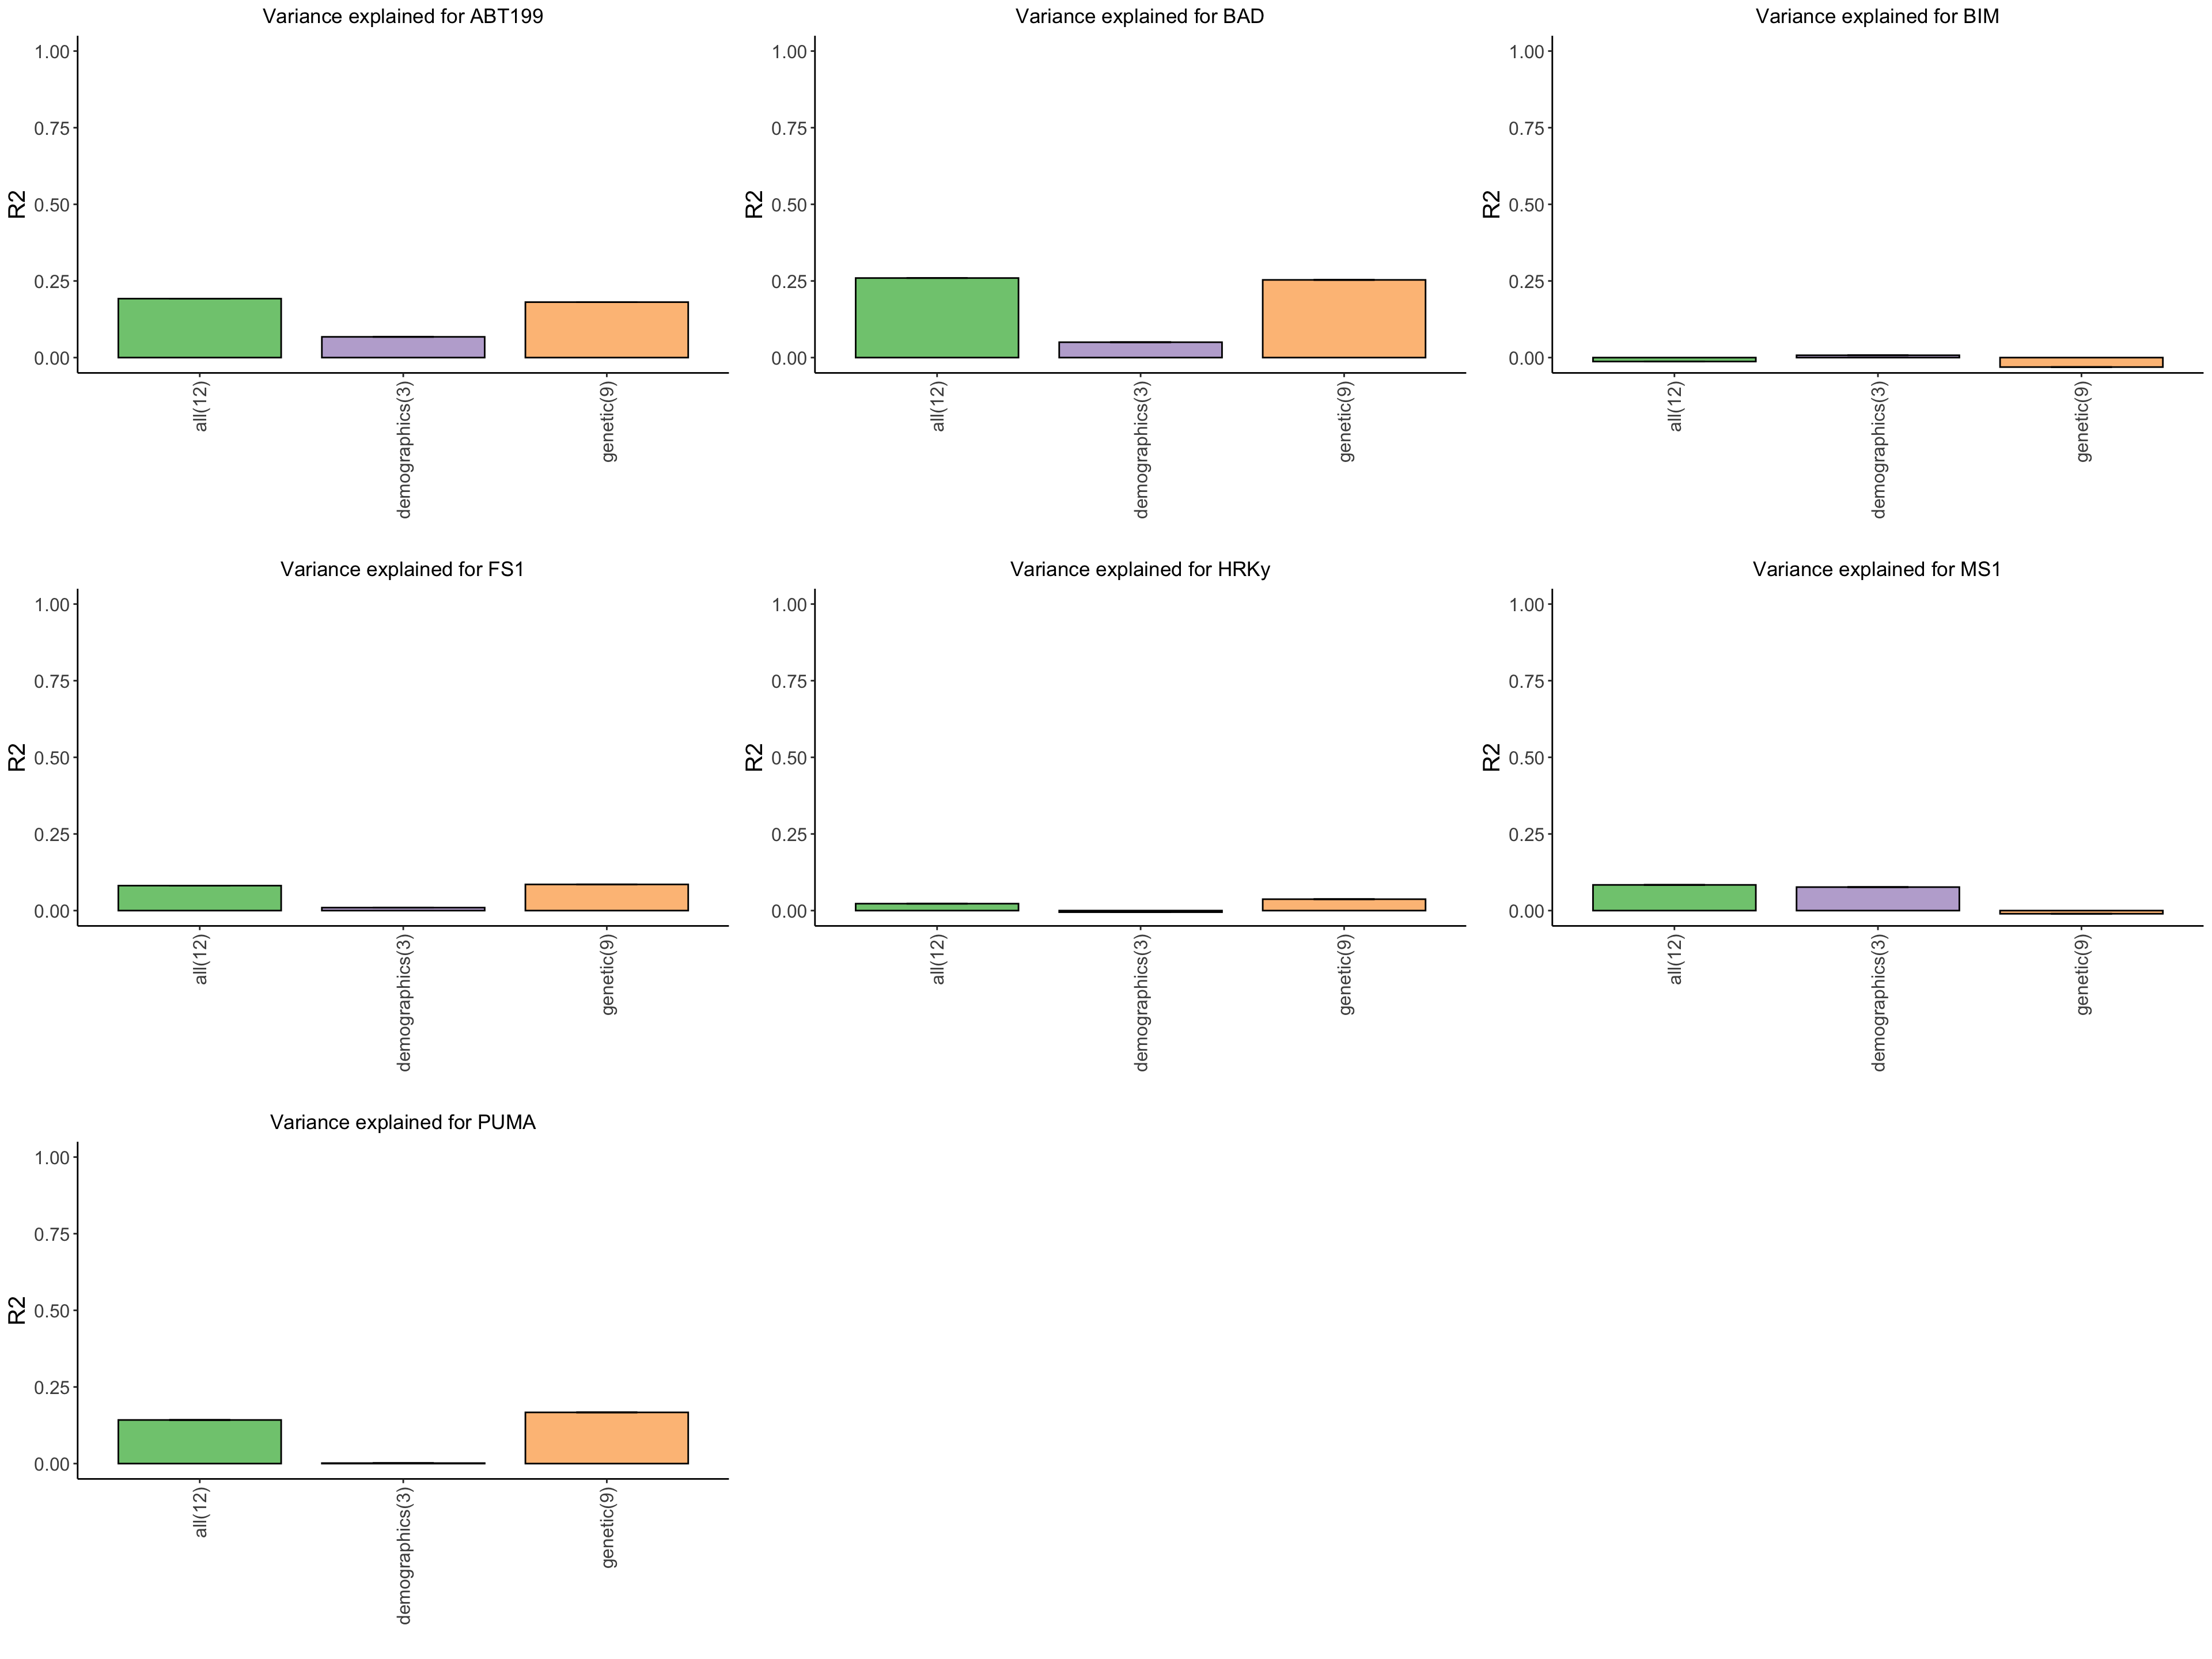
Ploting R2
Function for plotting variance explained for each measurement
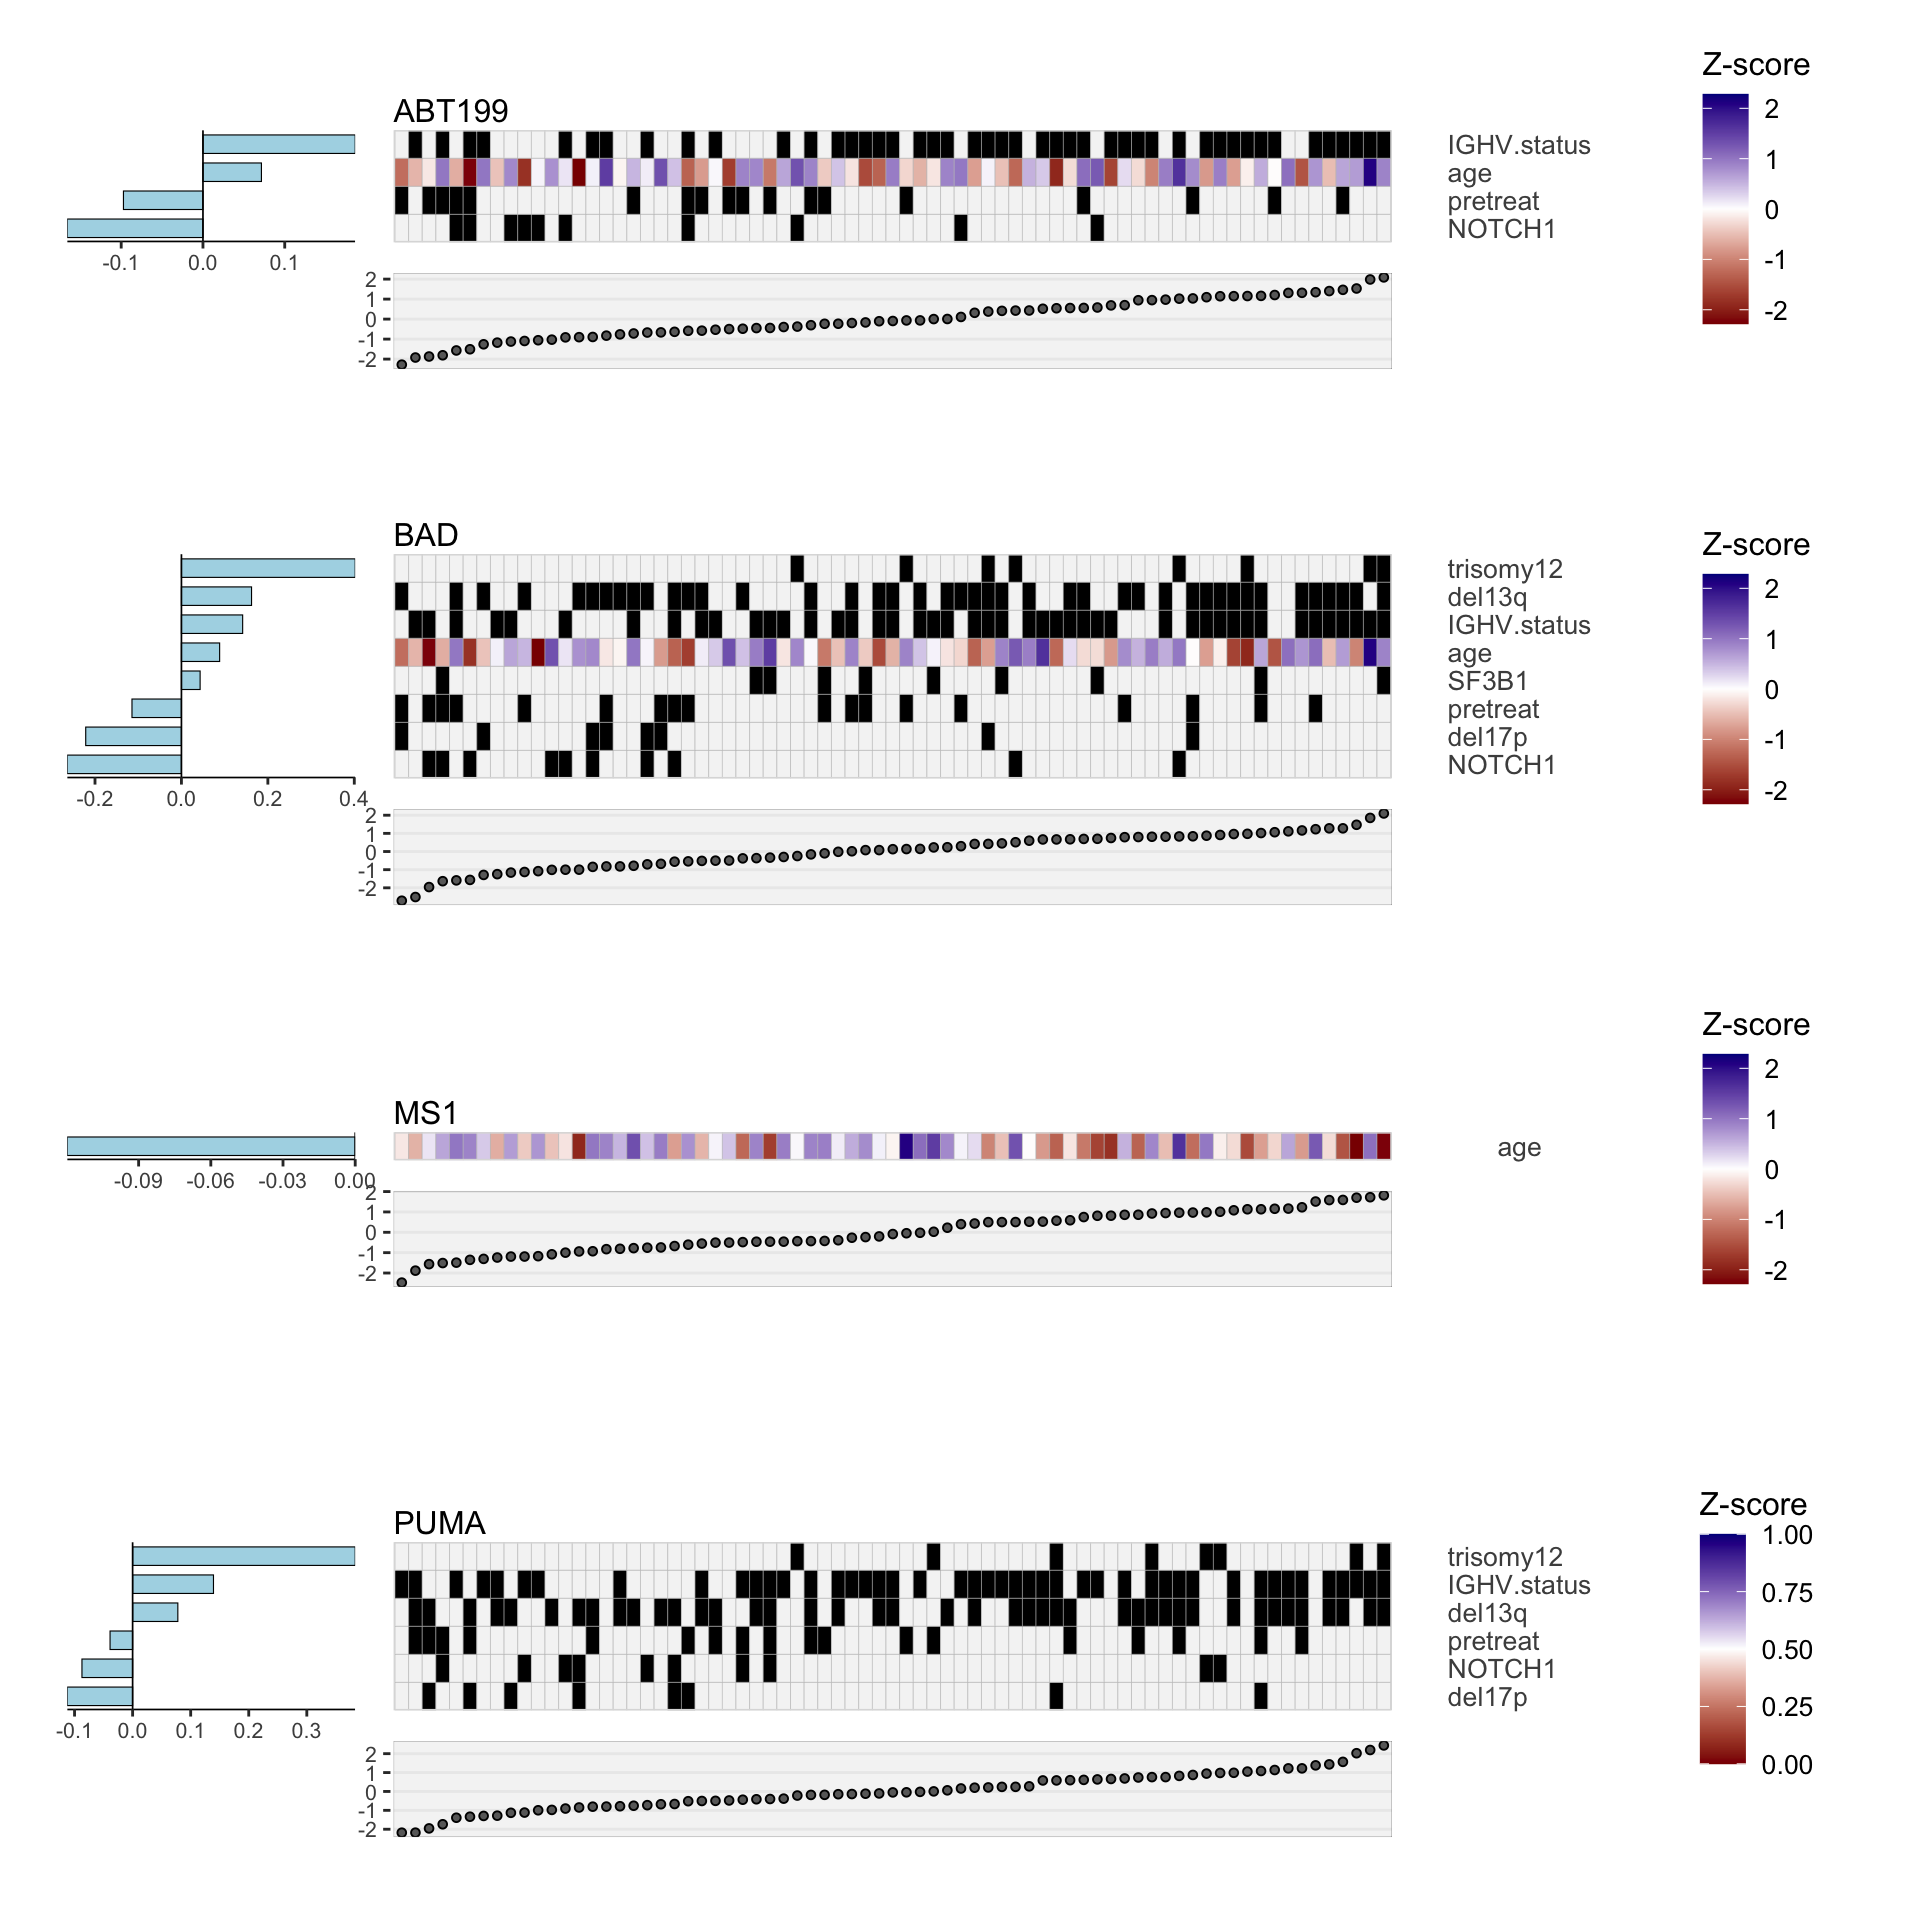
Ploting heatmap of selected features
Function for the heatmap plot
Plot all heatmaps
Multivariate linear regression without LASSO penalty
Training model
Function for multi-variate regression without lasso penalty
Perform linear regression without penalization
Ploting R2
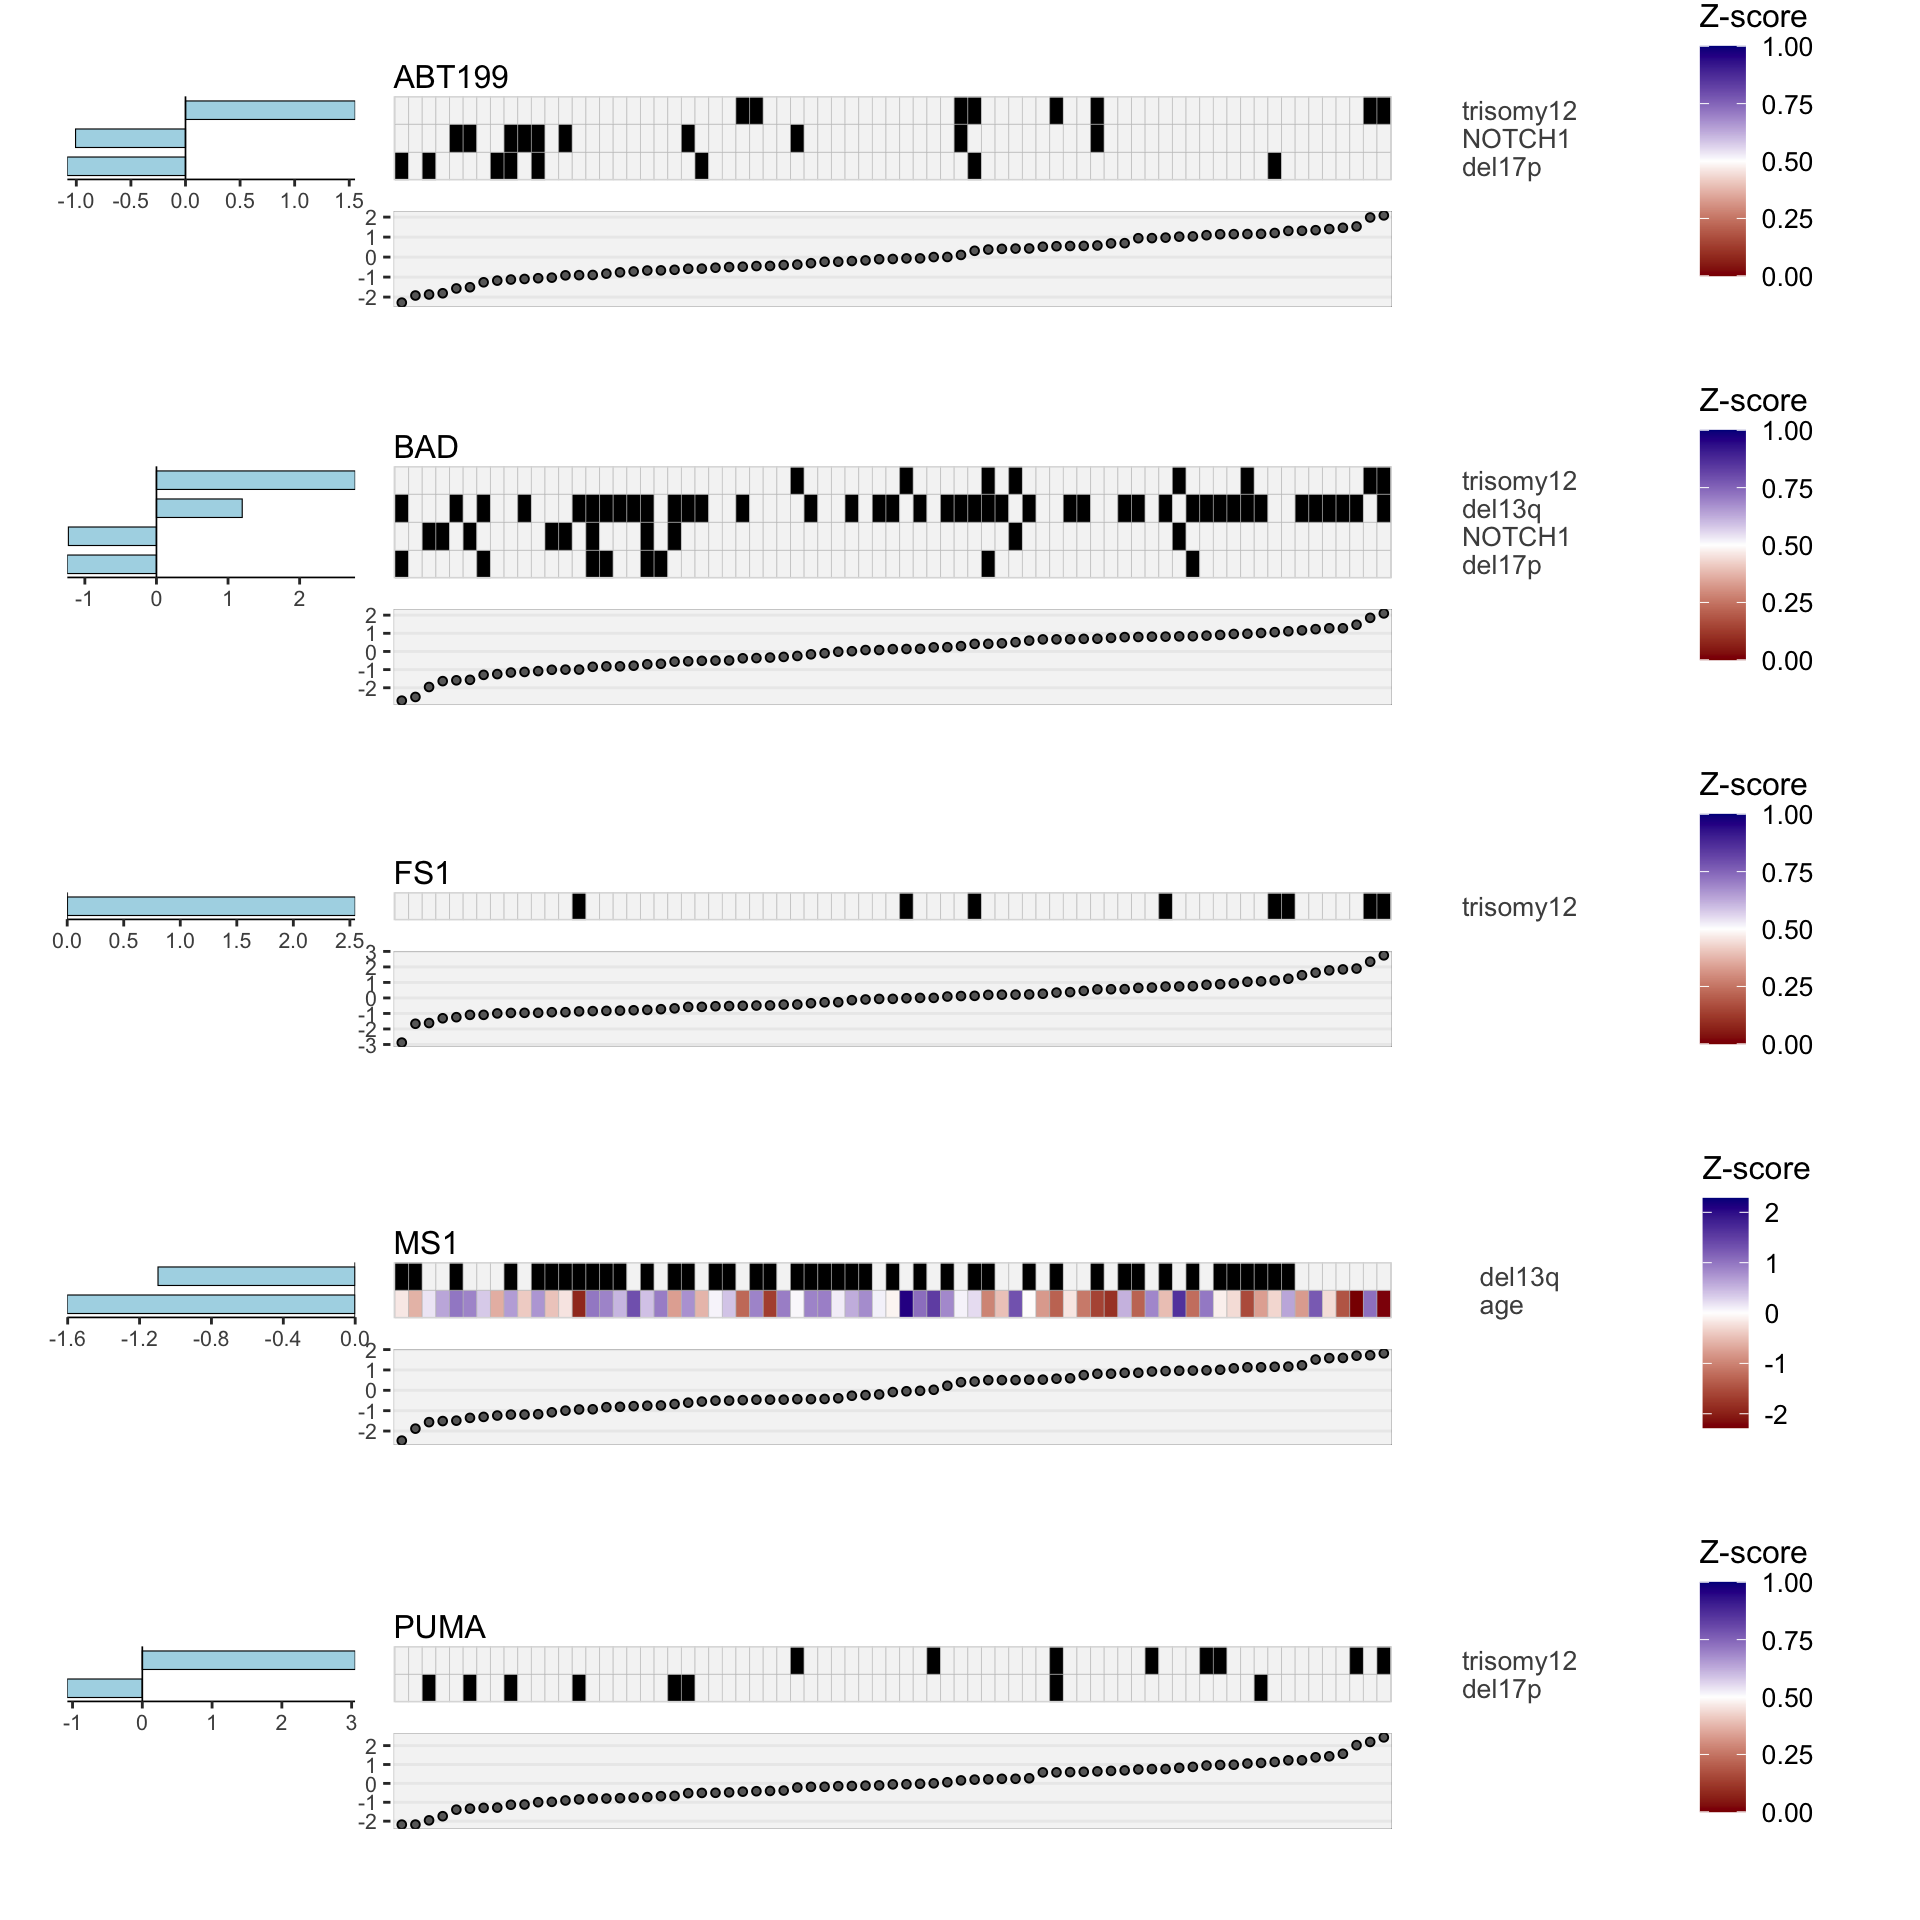
Heatmap of selected features, without lasso penalty (0.1 Pvalue)
Plot all heatmaps
R version 4.2.0 (2022-04-22)
Platform: x86_64-apple-darwin17.0 (64-bit)
Running under: macOS Big Sur/Monterey 10.16

Matrix products: default
BLAS:   /Library/Frameworks/R.framework/Versions/4.2/Resources/lib/libRblas.0.dylib
LAPACK: /Library/Frameworks/R.framework/Versions/4.2/Resources/lib/libRlapack.dylib

locale:
[1] en_US.UTF-8/en_US.UTF-8/en_US.UTF-8/C/en_US.UTF-8/en_US.UTF-8

attached base packages:
[1] stats4    stats     graphics  grDevices utils     datasets  methods
[8] base

other attached packages:
 [1] gtable_0.3.0                glmnet_4.1-4
 [3] Matrix_1.4-1                DESeq2_1.36.0
 [5] latex2exp_0.9.4             forcats_0.5.1
 [7] stringr_1.4.0               dplyr_1.0.9
 [9] purrr_0.3.4                 readr_2.1.2
[11] tidyr_1.2.0                 tibble_3.1.7
[13] ggplot2_3.3.6               tidyverse_1.3.1
[15] SummarizedExperiment_1.26.1 Biobase_2.56.0
[17] GenomicRanges_1.48.0        GenomeInfoDb_1.32.2
[19] IRanges_2.30.0              S4Vectors_0.34.0
[21] BiocGenerics_0.42.0         MatrixGenerics_1.8.0
[23] matrixStats_0.62.0          IHW_1.24.0
[25] limma_3.52.2                pheatmap_1.0.12
[27] cowplot_1.1.1               corrplot_0.92
[29] qgraph_1.9.2                jyluMisc_0.1.5

loaded via a namespace (and not attached):
  [1] utf8_1.2.2             shinydashboard_0.7.2   tidyselect_1.1.2
  [4] RSQLite_2.2.14         AnnotationDbi_1.58.0   htmlwidgets_1.5.4
  [7] grid_4.2.0             BiocParallel_1.30.3    maxstat_0.7-25
 [10] munsell_0.5.0          codetools_0.2-18       DT_0.23
 [13] withr_2.5.0            colorspace_2.0-3       highr_0.9
 [16] knitr_1.39             rstudioapi_0.13        ggsignif_0.6.3
 [19] labeling_0.4.2         git2r_0.30.1           slam_0.1-50
 [22] GenomeInfoDbData_1.2.8 lpsymphony_1.24.0      mnormt_2.1.0
 [25] KMsurv_0.1-5           bit64_4.0.5            farver_2.1.0
 [28] rprojroot_2.0.3        vctrs_0.4.1            generics_0.1.2
 [31] TH.data_1.1-1          xfun_0.31              sets_1.0-21
 [34] R6_2.5.1               ggbeeswarm_0.6.0       locfit_1.5-9.5
 [37] cachem_1.0.6           bitops_1.0-7           fgsea_1.22.0
 [40] DelayedArray_0.22.0    assertthat_0.2.1       vroom_1.5.7
 [43] promises_1.2.0.1       scales_1.2.0           multcomp_1.4-19
 [46] nnet_7.3-17            beeswarm_0.4.0         sandwich_3.0-2
 [49] workflowr_1.7.0        rlang_1.0.2            genefilter_1.78.0
 [52] splines_4.2.0          rstatix_0.7.0          broom_0.8.0
 [55] checkmate_2.1.0        yaml_2.3.5             reshape2_1.4.4
 [58] abind_1.4-5            modelr_0.1.8           crosstalk_1.2.0
 [61] backports_1.4.1        httpuv_1.6.5           Hmisc_4.7-0
 [64] tools_4.2.0            relations_0.6-12       psych_2.2.5
 [67] lavaan_0.6-11          ellipsis_0.3.2         gplots_3.1.3
 [70] jquerylib_0.1.4        RColorBrewer_1.1-3     Rcpp_1.0.8.3
 [73] plyr_1.8.7             base64enc_0.1-3        visNetwork_2.1.0
 [76] zlibbioc_1.42.0        RCurl_1.98-1.7         ggpubr_0.4.0
 [79] rpart_4.1.16           pbapply_1.5-0          zoo_1.8-10
 [82] ggrepel_0.9.1          haven_2.5.0            cluster_2.1.3
 [85] exactRankTests_0.8-35  fs_1.5.2               magrittr_2.0.3
 [88] data.table_1.14.2      reprex_2.0.1           survminer_0.4.9
 [91] mvtnorm_1.1-3          hms_1.1.1              shinyjs_2.1.0
 [94] mime_0.12              evaluate_0.15          xtable_1.8-4
 [97] XML_3.99-0.10          jpeg_0.1-9             readxl_1.4.0
[100] shape_1.4.6            gridExtra_2.3          compiler_4.2.0
[103] KernSmooth_2.23-20     crayon_1.5.1           htmltools_0.5.2
[106] mgcv_1.8-40            corpcor_1.6.10         later_1.3.0
[109] tzdb_0.3.0             Formula_1.2-4          geneplotter_1.74.0
[112] lubridate_1.8.0        DBI_1.1.3              dbplyr_2.2.0
[115] MASS_7.3-57            car_3.1-0              cli_3.3.0
[118] marray_1.74.0          parallel_4.2.0         igraph_1.3.2
[121] pkgconfig_2.0.3        km.ci_0.5-6            foreign_0.8-82
[124] piano_2.12.0           foreach_1.5.2          xml2_1.3.3
[127] annotate_1.74.0        pbivnorm_0.6.0         vipor_0.4.5
[130] bslib_0.3.1            XVector_0.36.0         drc_3.0-1
[133] rvest_1.0.2            digest_0.6.29          Biostrings_2.64.0
[136] rmarkdown_2.14         cellranger_1.1.0       fastmatch_1.1-3
[139] survMisc_0.5.6         htmlTable_2.4.0        shiny_1.7.1
[142] gtools_3.9.2.2         lifecycle_1.0.1        nlme_3.1-158
[145] glasso_1.11            jsonlite_1.8.0         carData_3.0-5
[148] fansi_1.0.3            pillar_1.7.0           lattice_0.20-45
[151] KEGGREST_1.36.2        fastmap_1.1.0          httr_1.4.3
[154] plotrix_3.8-2          survival_3.3-1         glue_1.6.2
[157] fdrtool_1.2.17         iterators_1.0.14       png_0.1-7
[160] bit_4.0.4              stringi_1.7.6          sass_0.4.1
[163] blob_1.2.3             memoise_2.0.1          latticeExtra_0.6-29
[166] caTools_1.18.2