Correlate cytokine expression with STAT2
Junyan Lu
2020-06-09
Last updated: 2020-09-02
Checks: 6 1
Knit directory: Proteomics/analysis/
This reproducible R Markdown analysis was created with workflowr (version 1.6.2). The Checks tab describes the reproducibility checks that were applied when the results were created. The Past versions tab lists the development history.
The R Markdown is untracked by Git. To know which version of the R Markdown file created these results, you'll want to first commit it to the Git repo. If you're still working on the analysis, you can ignore this warning. When you're finished, you can run wflow_publish to commit the R Markdown file and build the HTML.
Great job! The global environment was empty. Objects defined in the global environment can affect the analysis in your R Markdown file in unknown ways. For reproduciblity it's best to always run the code in an empty environment.
The command set.seed(20200227) was run prior to running the code in the R Markdown file. Setting a seed ensures that any results that rely on randomness, e.g. subsampling or permutations, are reproducible.
Great job! Recording the operating system, R version, and package versions is critical for reproducibility.
Nice! There were no cached chunks for this analysis, so you can be confident that you successfully produced the results during this run.
Great job! Using relative paths to the files within your workflowr project makes it easier to run your code on other machines.
Great! You are using Git for version control. Tracking code development and connecting the code version to the results is critical for reproducibility.
The results in this page were generated with repository version 3fb50c5. See the Past versions tab to see a history of the changes made to the R Markdown and HTML files.
Note that you need to be careful to ensure that all relevant files for the analysis have been committed to Git prior to generating the results (you can use wflow_publish or wflow_git_commit). workflowr only checks the R Markdown file, but you know if there are other scripts or data files that it depends on. Below is the status of the Git repository when the results were generated:
Ignored files:
    Ignored:    .DS_Store
    Ignored:    .Rhistory
    Ignored:    .Rproj.user/
    Ignored:    analysis/.DS_Store
    Ignored:    analysis/.Rhistory
    Ignored:    analysis/correlateCLLPD_cache/
    Ignored:    analysis/manuscript_S2_genomicAssociation_oldTimsTOF_cache/
    Ignored:    analysis/manuscript_S4_IGHV_oldTimsTOF_cache/
    Ignored:    analysis/manuscript_S6_del11q_oldTimsTOF_cache/
    Ignored:    code/.Rhistory
    Ignored:    data/.DS_Store
    Ignored:    output/.DS_Store

Untracked files:
    Untracked:  analysis/.trisomy12_norm.pdf
    Untracked:  analysis/CNVanalysis_11q.Rmd
    Untracked:  analysis/CNVanalysis_trisomy12.Rmd
    Untracked:  analysis/CNVanalysis_trisomy19.Rmd
    Untracked:  analysis/STAT2_cytokines.Rmd
    Untracked:  analysis/SUGP1_splicing.svg.xml
    Untracked:  analysis/analysisDrugResponses.Rmd
    Untracked:  analysis/analysisDrugResponses_IC50.Rmd
    Untracked:  analysis/analysisPCA.Rmd
    Untracked:  analysis/analysisPreliminary_LUMOS.Rmd
    Untracked:  analysis/analysisPreliminary_timsTOF_Hela.Rmd
    Untracked:  analysis/analysisPreliminary_timsTOF_new.Rmd
    Untracked:  analysis/analysisSplicing.Rmd
    Untracked:  analysis/analysisTrisomy19.Rmd
    Untracked:  analysis/annotateCNV.Rmd
    Untracked:  analysis/comparePlatforms_LUMOS_helaTimsTOF.Rmd
    Untracked:  analysis/comparePlatforms_LUMOS_newTimsTOF.Rmd
    Untracked:  analysis/comparePlatforms_newTimsTOF_helaTimsTOF.Rmd
    Untracked:  analysis/complexAnalysis_IGHV.Rmd
    Untracked:  analysis/complexAnalysis_IGHV_alternative.Rmd
    Untracked:  analysis/complexAnalysis_overall.Rmd
    Untracked:  analysis/complexAnalysis_trisomy12.Rmd
    Untracked:  analysis/complexAnalysis_trisomy12_alternative.Rmd
    Untracked:  analysis/correlateGenomic_PC12adjusted.Rmd
    Untracked:  analysis/correlateGenomic_noBlock.Rmd
    Untracked:  analysis/correlateGenomic_noBlock_MCLL.Rmd
    Untracked:  analysis/correlateGenomic_noBlock_UCLL.Rmd
    Untracked:  analysis/correlateGenomic_timsTOFnew.Rmd
    Untracked:  analysis/correlateGenomic_timsTOFnewHela.Rmd
    Untracked:  analysis/correlateRNAexpression.Rmd
    Untracked:  analysis/default.css
    Untracked:  analysis/del11q.pdf
    Untracked:  analysis/del11q_norm.pdf
    Untracked:  analysis/manuscript_S0_PrepareData.Rmd
    Untracked:  analysis/manuscript_S1_Overview.Rmd
    Untracked:  analysis/manuscript_S2_genomicAssociation.Rmd
    Untracked:  analysis/manuscript_S2_genomicAssociation_oldTimsTOF.Rmd
    Untracked:  analysis/manuscript_S3_trisomy12.Rmd
    Untracked:  analysis/manuscript_S4_IGHV.Rmd
    Untracked:  analysis/manuscript_S4_IGHV_oldTimsTOF.Rmd
    Untracked:  analysis/manuscript_S5_trisomy19.Rmd
    Untracked:  analysis/manuscript_S6_del11q.Rmd
    Untracked:  analysis/manuscript_S6_del11q_oldTimsTOF.Rmd
    Untracked:  analysis/manuscript_S7_SF3B1.Rmd
    Untracked:  analysis/manuscript_S8_drugResponse_Outcomes.Rmd
    Untracked:  analysis/peptideValidate.Rmd
    Untracked:  analysis/plotCNV_del11q.pdf
    Untracked:  analysis/plotExpressionCNV.Rmd
    Untracked:  analysis/processPeptides_LUMOS.Rmd
    Untracked:  analysis/processProteomics_timsTOF_Hela.Rmd
    Untracked:  analysis/processProteomics_timsTOF_new.Rmd
    Untracked:  analysis/protCLL.RData
    Untracked:  analysis/qualityControl_timsTOF_Hela.Rmd
    Untracked:  analysis/qualityControl_timsTOF_new.Rmd
    Untracked:  analysis/style.css
    Untracked:  analysis/test.pdf
    Untracked:  analysis/test.svg
    Untracked:  analysis/tri12Enrich.pdf
    Untracked:  analysis/trisomy12.pdf
    Untracked:  analysis/trisomy12_AFcor.Rmd
    Untracked:  analysis/trisomy12_norm.pdf
    Untracked:  code/AlteredPQR.R
    Untracked:  code/utils.R
    Untracked:  data/190909_CLL_prot_abund_med_norm.tsv
    Untracked:  data/190909_CLL_prot_abund_no_norm.tsv
    Untracked:  data/200725_cll_diaPASEF_direct_reports/
    Untracked:  data/200728_cll_diaPASEF_direct_plus_hela_reports/
    Untracked:  data/20190423_Proteom_submitted_samples_bereinigt.xlsx
    Untracked:  data/20191025_Proteom_submitted_samples_final.xlsx
    Untracked:  data/Chemokines.csv
    Untracked:  data/IFN_list.csv
    Untracked:  data/IFNreceptor.csv
    Untracked:  data/Interleukin_receptor.csv
    Untracked:  data/Interleukins.csv
    Untracked:  data/LUMOS/
    Untracked:  data/LUMOS_peptides/
    Untracked:  data/LUMOS_protAnnotation.csv
    Untracked:  data/LUMOS_protAnnotation_fix.csv
    Untracked:  data/SampleAnnotation_cleaned.xlsx
    Untracked:  data/chemoReceptor.csv
    Untracked:  data/example_proteomics_data
    Untracked:  data/facTab_IC50atLeast3New.RData
    Untracked:  data/gmts/
    Untracked:  data/mapEnsemble.txt
    Untracked:  data/mapSymbol.txt
    Untracked:  data/proteins_in_complexes
    Untracked:  data/pyprophet_export_aligned.csv
    Untracked:  data/timsTOF_protAnnotation.csv
    Untracked:  output/Fig1A.pdf
    Untracked:  output/Fig1A.png
    Untracked:  output/Fig1A.pptx
    Untracked:  output/LUMOS_processed.RData
    Untracked:  output/MSH6_splicing.svg
    Untracked:  output/SUGP1_splicing.eps
    Untracked:  output/SUGP1_splicing.pdf
    Untracked:  output/SUGP1_splicing.svg
    Untracked:  output/cnv_plots.zip
    Untracked:  output/cnv_plots/
    Untracked:  output/cnv_plots_norm.zip
    Untracked:  output/ddsrna_enc.RData
    Untracked:  output/deResList.RData
    Untracked:  output/deResList_timsTOF.RData
    Untracked:  output/deResList_timsTOF_old.RData
    Untracked:  output/dxdCLL.RData
    Untracked:  output/dxdCLL2.RData
    Untracked:  output/encMap.RData
    Untracked:  output/exprCNV.RData
    Untracked:  output/exprCNV_enc.RData
    Untracked:  output/lassoResults_CPS.RData
    Untracked:  output/lassoResults_IC50.RData
    Untracked:  output/patMeta_enc.RData
    Untracked:  output/pepCLL_lumos.RData
    Untracked:  output/pepCLL_lumos_enc.RData
    Untracked:  output/pepTab_lumos.RData
    Untracked:  output/pheno1000_enc.RData
    Untracked:  output/pheno1000_main.RData
    Untracked:  output/plotCNV_allChr11_diff.pdf
    Untracked:  output/plotCNV_del11q_sum.pdf
    Untracked:  output/proteomic_LUMOS_20200227.RData
    Untracked:  output/proteomic_LUMOS_20200320.RData
    Untracked:  output/proteomic_LUMOS_20200430.RData
    Untracked:  output/proteomic_LUMOS_enc.RData
    Untracked:  output/proteomic_timsTOF_20200227.RData
    Untracked:  output/proteomic_timsTOF_Hela_20200806.RData
    Untracked:  output/proteomic_timsTOF_enc.RData
    Untracked:  output/proteomic_timsTOF_new_20200806.RData
    Untracked:  output/proteomic_timsTOF_old_enc.RData
    Untracked:  output/splicingResults.RData
    Untracked:  output/survival_enc.RData
    Untracked:  output/timsTOF_processed.RData
    Untracked:  plotCNV_del11q_diff.pdf
    Untracked:  summary/
    Untracked:  supp_latex/

Unstaged changes:
    Modified:   analysis/_site.yml
    Modified:   analysis/analysisSF3B1.Rmd
    Modified:   analysis/compareProteomicsRNAseq.Rmd
    Modified:   analysis/correlateCLLPD.Rmd
    Modified:   analysis/correlateGenomic.Rmd
    Deleted:    analysis/correlateGenomic_removePC.Rmd
    Modified:   analysis/correlateMIR.Rmd
    Modified:   analysis/correlateMethylationCluster.Rmd
    Modified:   analysis/index.Rmd
    Modified:   analysis/predictOutcome.Rmd
    Modified:   analysis/processProteomics_LUMOS.Rmd
    Modified:   analysis/qualityControl_LUMOS.Rmd
Note that any generated files, e.g. HTML, png, CSS, etc., are not included in this status report because it is ok for generated content to have uncommitted changes.
There are no past versions. Publish this analysis with wflow_publish() to start tracking its development.
Associations with cytokines (interferon, chemokine, interleukin)
ifList <- read_csv("../data/IFN_list.csv", skip = 1)[[2]]
chemoList <- read_csv("../data/Chemokines.csv", skip = 1)[[2]]
ilList <- read_csv("../data/Interleukins.csv", skip = 1)[[2]]
cytoTab <- tibble(symbol = c(ifList,chemoList,ilList),
                  type = c(rep("Interferon",length(ifList)),rep("Chemokine",length(chemoList)),rep("Interleukin",length(ilList)))) %>%
  distinct(symbol, .keep_all = TRUE)
Proteomics
Cytokines detected in proteomics data
cytoTab.sub <- filter(cytoTab, symbol %in% rowData(protCLL)$hgnc_symbol)
cytoTab.sub
# A tibble: 1 x 2
symbol type
<chr> <chr>
1 IL16 InterleukinOnly IL16 is detected
Does IL16 correlate with STAT2?
exprMat <- assays(protCLL)[["count"]]
exprIL16 <- exprMat[rowData(protCLL)$hgnc_symbol == "IL16",]
exprSTAT2 <- exprMat[rowData(protCLL)$hgnc_symbol == "STAT2",]
plotTab <- tibble(IL16 = exprIL16, STAT2 = exprSTAT2, patID = colnames(exprMat)) %>%
  left_join(patMeta, by = c(patID = "Patient.ID"))
ggplot(plotTab, aes(x=IL16, y=STAT2)) + geom_point(aes(col = trisomy12, shape = IGHV.status)) +
  geom_smooth(method = "lm") +
  scale_shape_manual(values = c(U=1, M=20)) + theme_bw()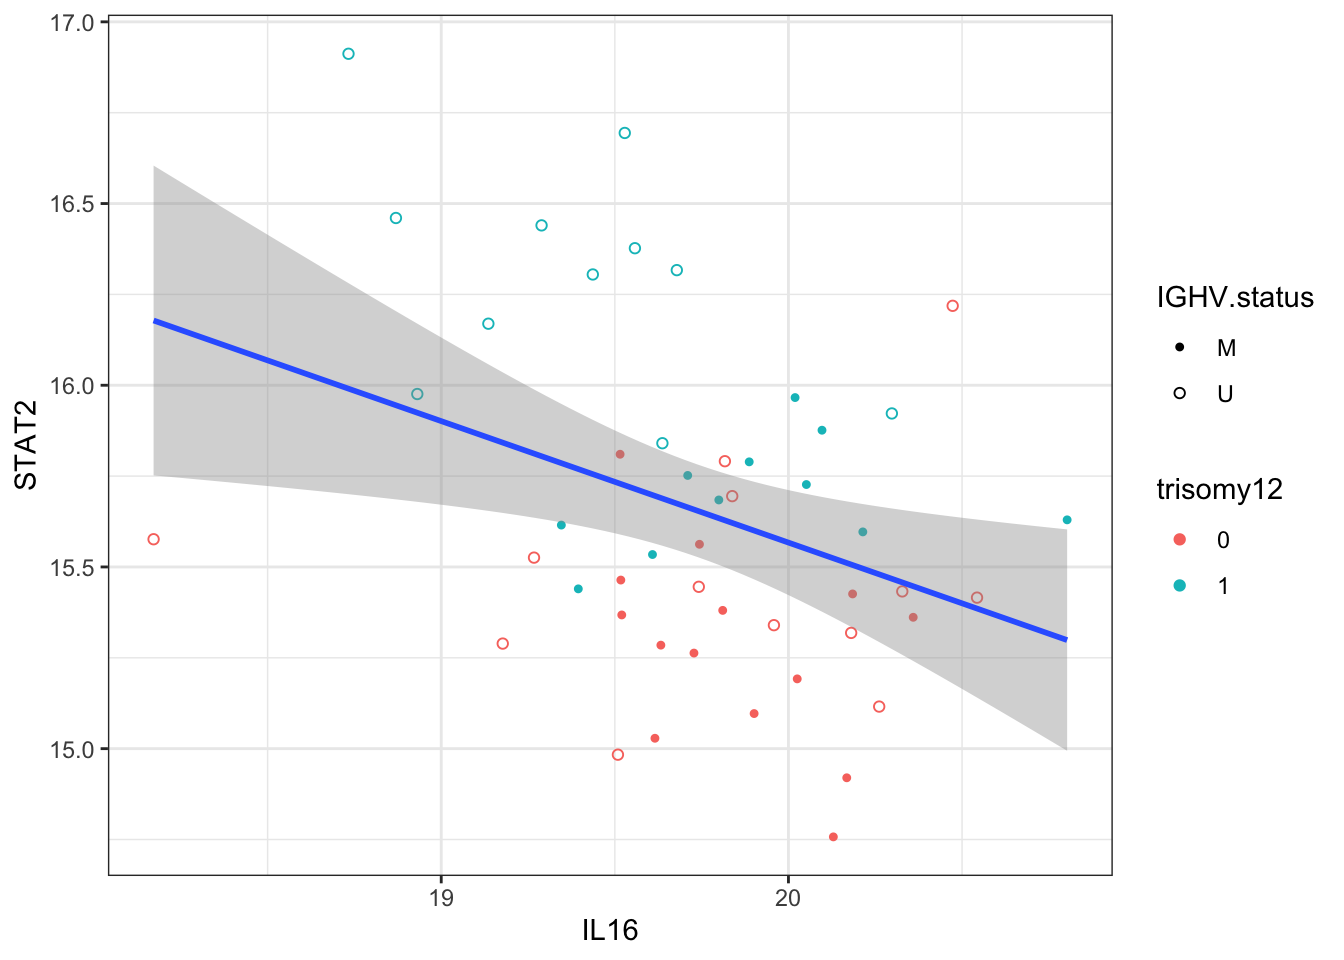
Correlation test
cor.test(plotTab$IL16, plotTab$STAT2)
    Pearson's product-moment correlation

data:  plotTab$IL16 and plotTab$STAT2
t = -2.5886, df = 47, p-value = 0.01279
alternative hypothesis: true correlation is not equal to 0
95 percent confidence interval:
 -0.57711313 -0.07999021
sample estimates:
       cor
-0.3532413
Transcriptomics
colnames(dds) <- dds$PatID
dds <- estimateSizeFactors(dds)
sampleOverlap <- intersect(colnames(protCLL), colnames(dds))
ddsSub <- dds[rowData(dds)$symbol %in% cytoTab$symbol, sampleOverlap]
ddsSub <- ddsSub[rowSums(counts(ddsSub,normalized = TRUE))>0,]
How many cytokine mRNAs can be detected?
nrow(ddsSub)[1] 103rowData(ddsSub)$symbol [1] "CX3CL1" "CCL26" "IL32" "CXCL2" "IL11" "CCL22" "CCL17"
[8] "IL7" "CCL24" "CXCL12" "CCL7" "CCL2" "CCL8" "CCL1"
[15] "IL2" "IL23A" "IL26" "IFNG" "IL17A" "IL17F" "IL12B"
[22] "IL4" "IL5" "IL1A" "CCL20" "IFNA6" "IFNA8" "IL17C"
[29] "CXCL6" "IL1B" "IL37" "IL22" "IL17B" "CCL25" "IL6"
[36] "IL10" "IL36G" "IL1RN" "IL36A" "IL36RN" "IL36B" "IL1F10"
[43] "IL33" "CCL21" "IFNA21" "IL21" "CXCL9" "IL19" "XCL1"
[50] "XCL2" "CXCL14" "IL9" "IFNA5" "IFNA16" "IFNK" "IL18"
[57] "CCL28" "CXCL13" "IL34" "CXCL16" "IL20" "IL24" "CXCL3"
[64] "CXCL5" "CXCL1" "IL15" "IL3" "IL25" "IL12A" "IL13"
[71] "CXCL10" "CXCL11" "CXCL8" "IFNB1" "CCL11" "IL16" "IL17D"
[78] "CCL19" "IFNW1" "CCL13" "IFNL1" "IFNL2" "IFNA10" "IFNA2"
[85] "CXCL17" "IFNL3" "IL27" "IFNA1" "IL31" "IFNA7" "IFNWP18"
[92] "IFNA22P" "IFNWP4" "IFNA20P" "IFNWP9" "IFNA14" "IFNNP1" "IFNWP5"
[99] "IFNWP15" "IFNA13" "IFNA17" "IFNA4" "IFNWP19"Does any mRNA expression correlate with STAT2 protein level?
ddsSub.voom <- ddsSub
assay(ddsSub.voom) <- voom(counts(ddsSub), lib.size = ddsSub$sizeFactor)$E
exprMat <- assay(ddsSub.voom)
protExpr <- assays(protCLL[,colnames(exprMat)])[["count"]][rowData(protCLL)$hgnc_symbol == "STAT2"]
designMat <- model.matrix(~protExpr)
fit <- lmFit(exprMat, designMat)
fit2 <- eBayes(fit)
resTab <- topTable(fit2, coef = "protExpr", number = "all") %>%
data.frame() %>% rownames_to_column("id") %>%
mutate(symbol = rowData(ddsSub[id,])$symbol)List of significant associations
resTab.sig <- filter(resTab, P.Value < 0.05) %>%
  select(id, symbol, logFC, P.Value, adj.P.Val)
resTab.sig %>% mutate_if(is.numeric, formatC, digits=2) %>%
DT::datatable()Plot significant associations (raw P < 0.05)
plotList <- lapply(seq(nrow(resTab.sig)), function(i) {
  gene <- resTab.sig[i,]$id
  name <- resTab.sig[i,]$symbol
  plotTab <- tibble(geneExp = counts(ddsSub,normalized = TRUE)[gene,],
                    protExp = protExpr, patID = colnames(exprMat)) %>%
    left_join(patMeta, by = c(patID = "Patient.ID"))

  ggplot(plotTab, aes(x=log2(geneExp), y=protExp)) +
    geom_point(aes(col = trisomy12, shape = IGHV.status)) +
    geom_smooth(method = "lm") +
    scale_shape_manual(values = c(U=1, M=20)) + theme_bw() +
    ylab("STAT2 protein expression") +
    xlab("log2 mRNA count") + ggtitle(name)
})

cowplot::plot_grid(plotlist= plotList, ncol=3)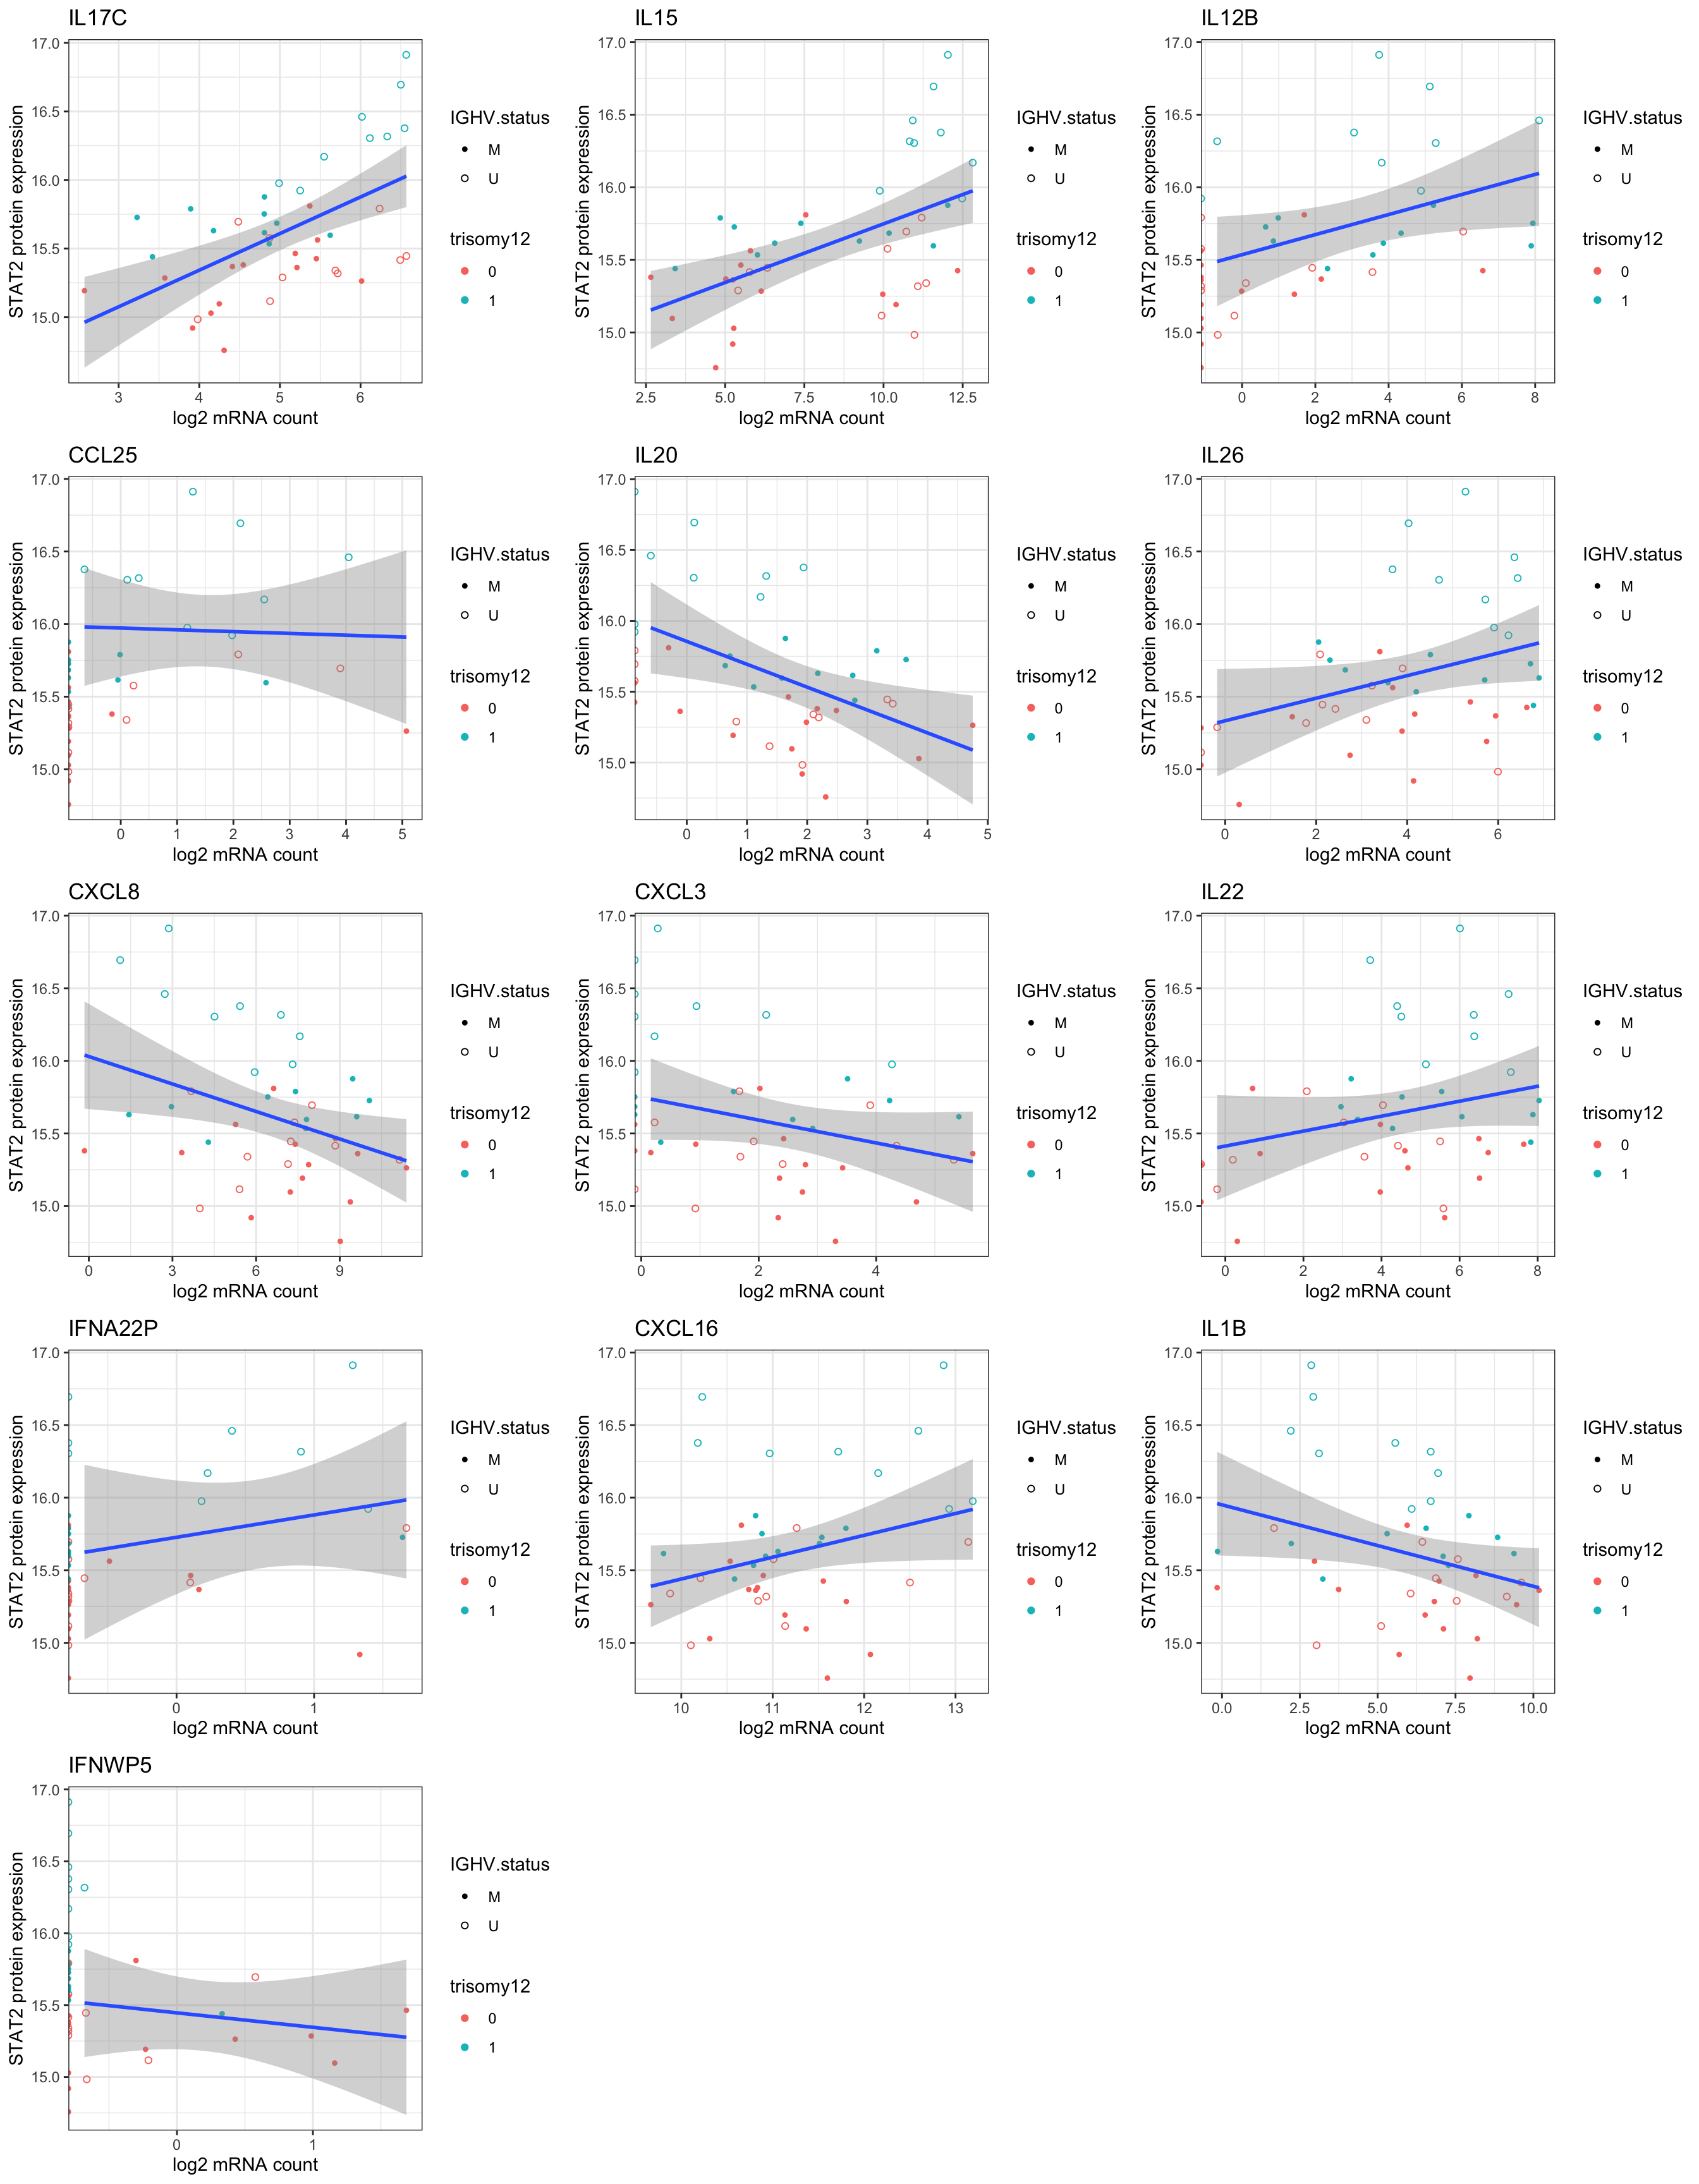
Heatmap of all detected cytokine mRNAs
plotMat <- exprMat
plotMat <- jyluMisc::mscale(plotMat, censor = 5)
rownames(plotMat) <- rowData(ddsSub.voom)$symbol
colAnno <- patMeta %>% filter(Patient.ID %in% colnames(plotMat)) %>%
  select(Patient.ID, IGHV.status, trisomy12) %>%
  mutate(STAT2 = protExpr[match(Patient.ID,colnames(exprMat))]) %>%
  arrange(STAT2) %>%
  data.frame() %>% column_to_rownames("Patient.ID")
rowAnno <- tibble(gene = resTab$symbol) %>%
  mutate(type = cytoTab[match(gene, cytoTab$symbol),]$type) %>%
  data.frame() %>% column_to_rownames("gene")

plotMat <- plotMat[rownames(rowAnno), rownames(colAnno)]
pheatmap(plotMat, cluster_rows = FALSE, cluster_cols = FALSE,
         annotation_row = rowAnno, annotation_col = colAnno,
         color = colorRampPalette(c("blue","white","red"))(100))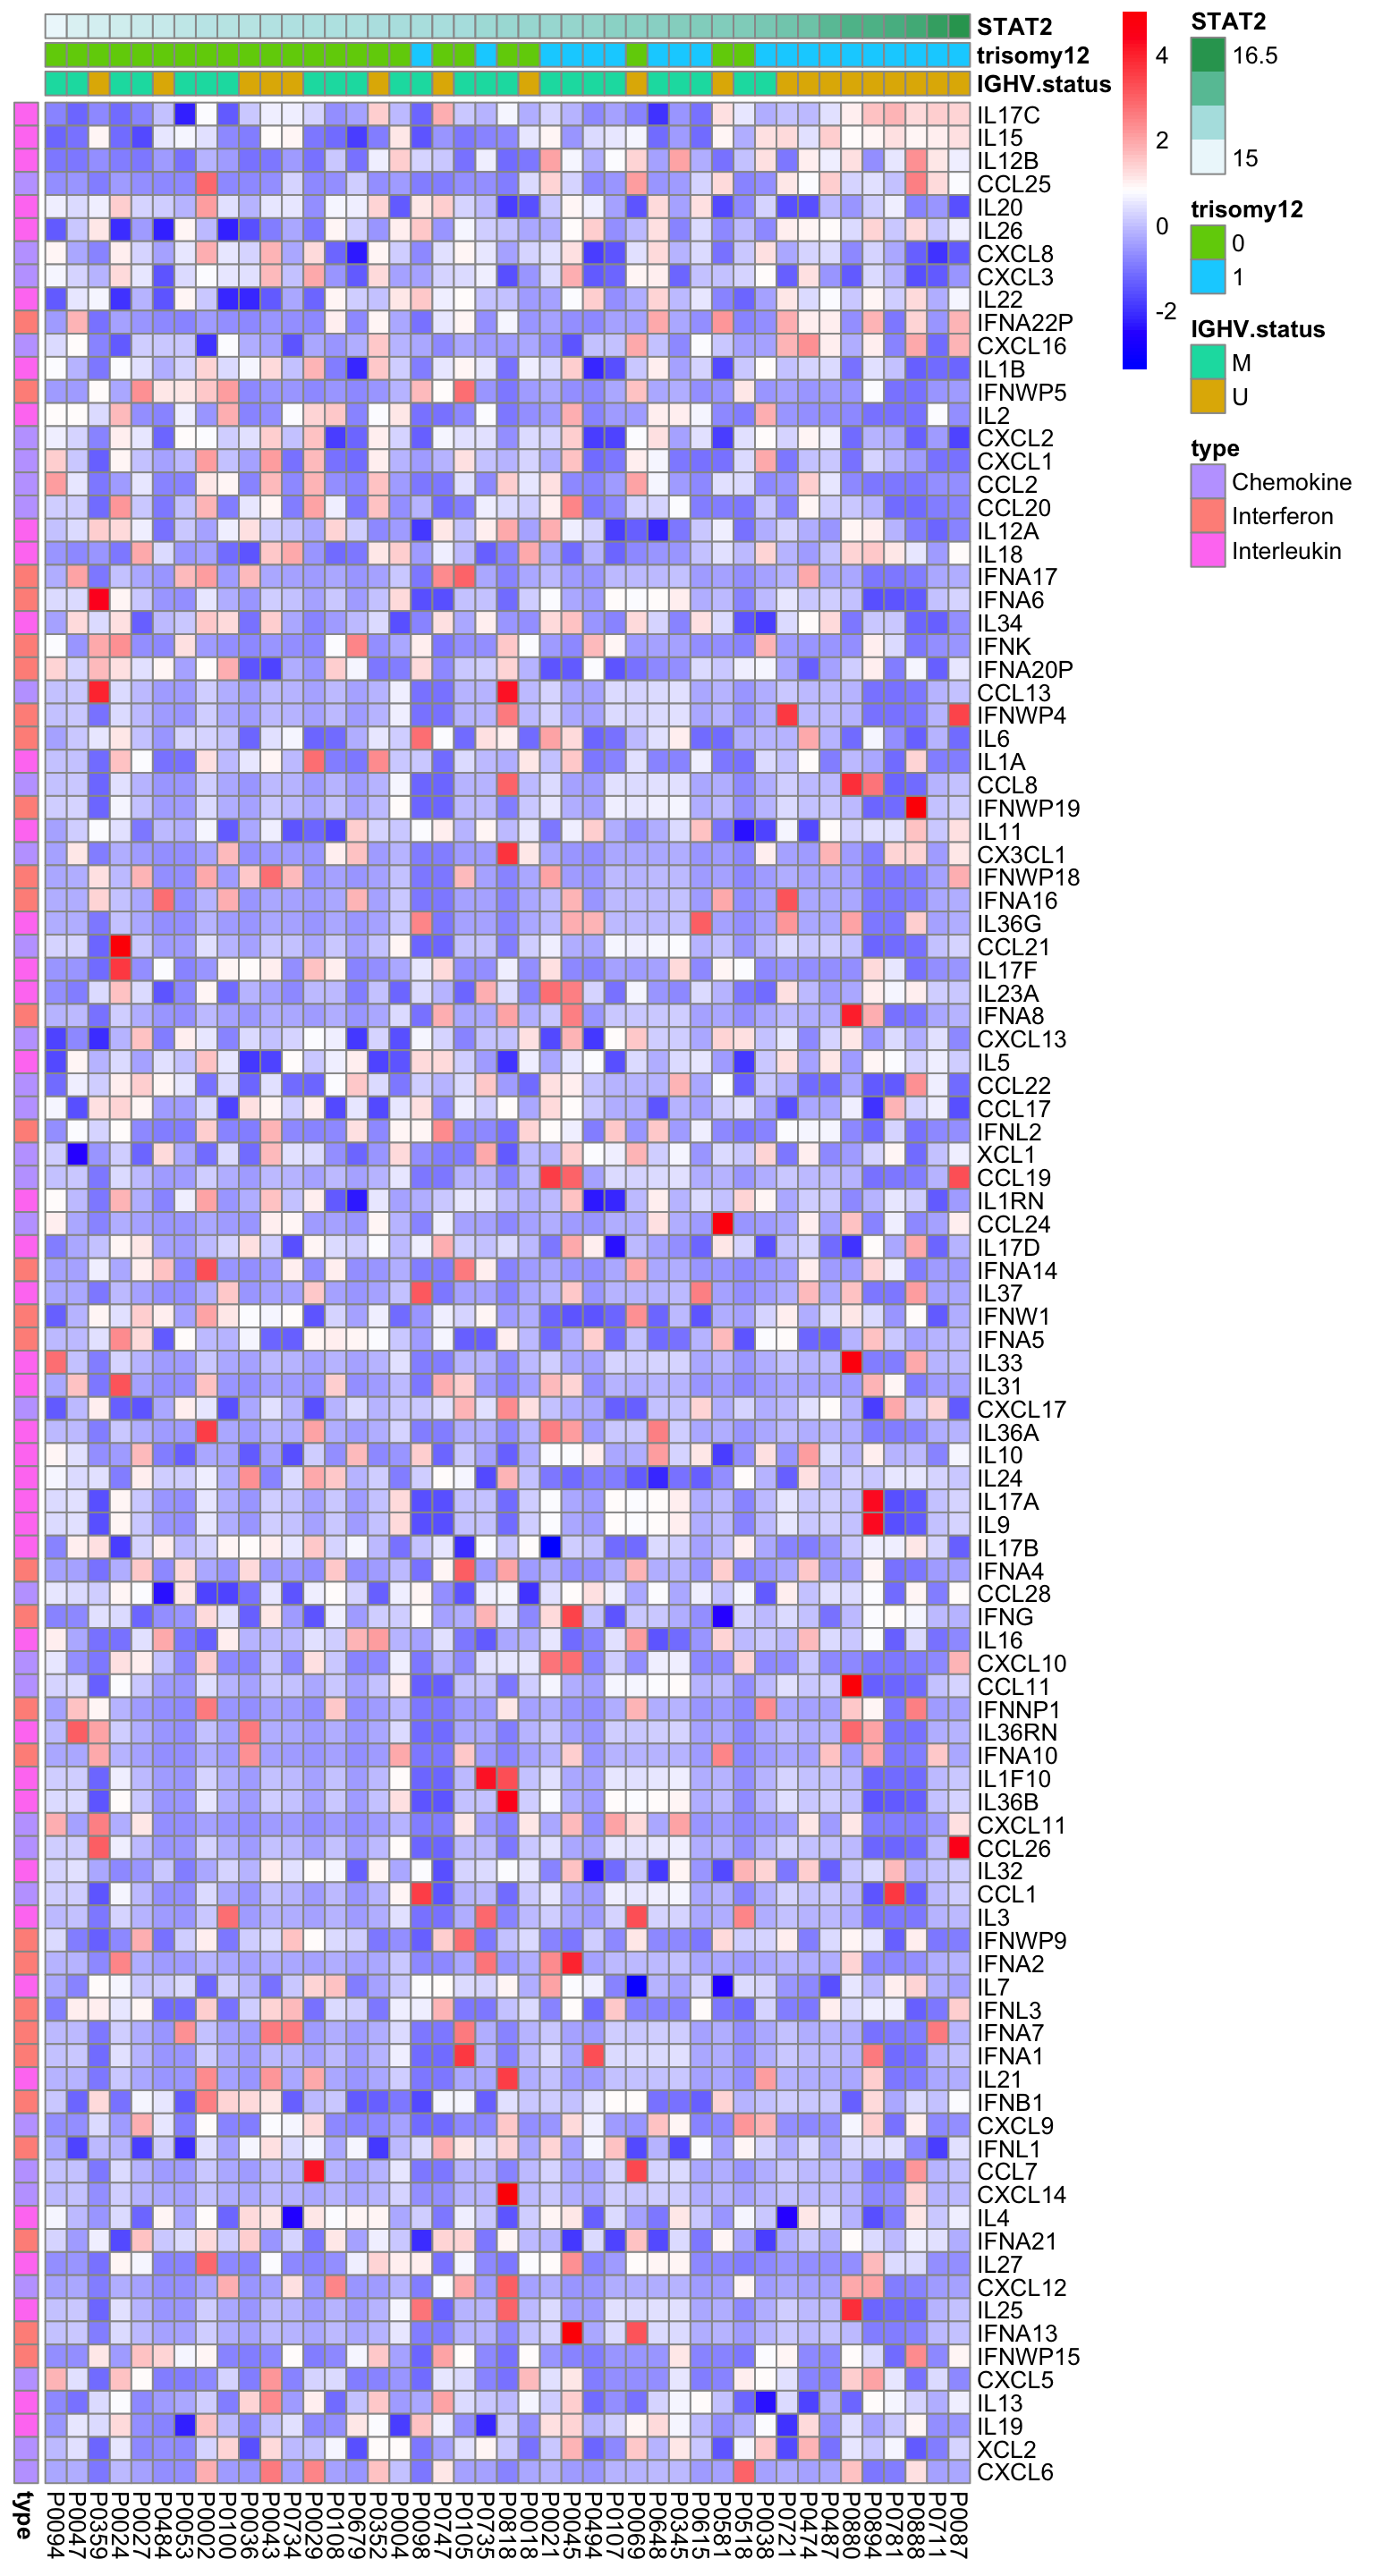
Associations with cytokine receptors
ifList <- read_csv("../data/IFNreceptor.csv", skip = 1)[[2]]
chemoList <- read_csv("../data/chemoReceptor.csv", skip = 1)[[2]]
ilList <- read_csv("../data/Interleukin_receptor.csv", skip = 1)[[2]]
cytoTab <- tibble(symbol = c(ifList,chemoList,ilList),
                  type = c(rep("Interferon",length(ifList)),rep("Chemokine",length(chemoList)),rep("Interleukin",length(ilList)))) %>%
  distinct(symbol, .keep_all = TRUE)
Proteomics
Cytokines detected in proteomics data
cytoTab.sub <- filter(cytoTab, symbol %in% rowData(protCLL)$hgnc_symbol)
cytoTab.sub
# A tibble: 2 x 2
symbol type
<chr> <chr>
1 CCR7 Chemokine
2 CXCR4 ChemokineOnly CCR7 and CXCR4 are detected
Does CCR7 correlate with STAT2?
exprMat <- assays(protCLL)[["count"]]
exprProt <- exprMat[rowData(protCLL)$hgnc_symbol == "CCR7",]
exprSTAT2 <- exprMat[rowData(protCLL)$hgnc_symbol == "STAT2",]
plotTab <- tibble(CCR7 = exprProt, STAT2 = exprSTAT2, patID = colnames(exprMat)) %>%
  left_join(patMeta, by = c(patID = "Patient.ID"))
ggplot(plotTab, aes(x=CCR7, y=STAT2)) + geom_point(aes(col = trisomy12, shape = IGHV.status)) +
  geom_smooth(method = "lm") +
  scale_shape_manual(values = c(U=1, M=20)) + theme_bw()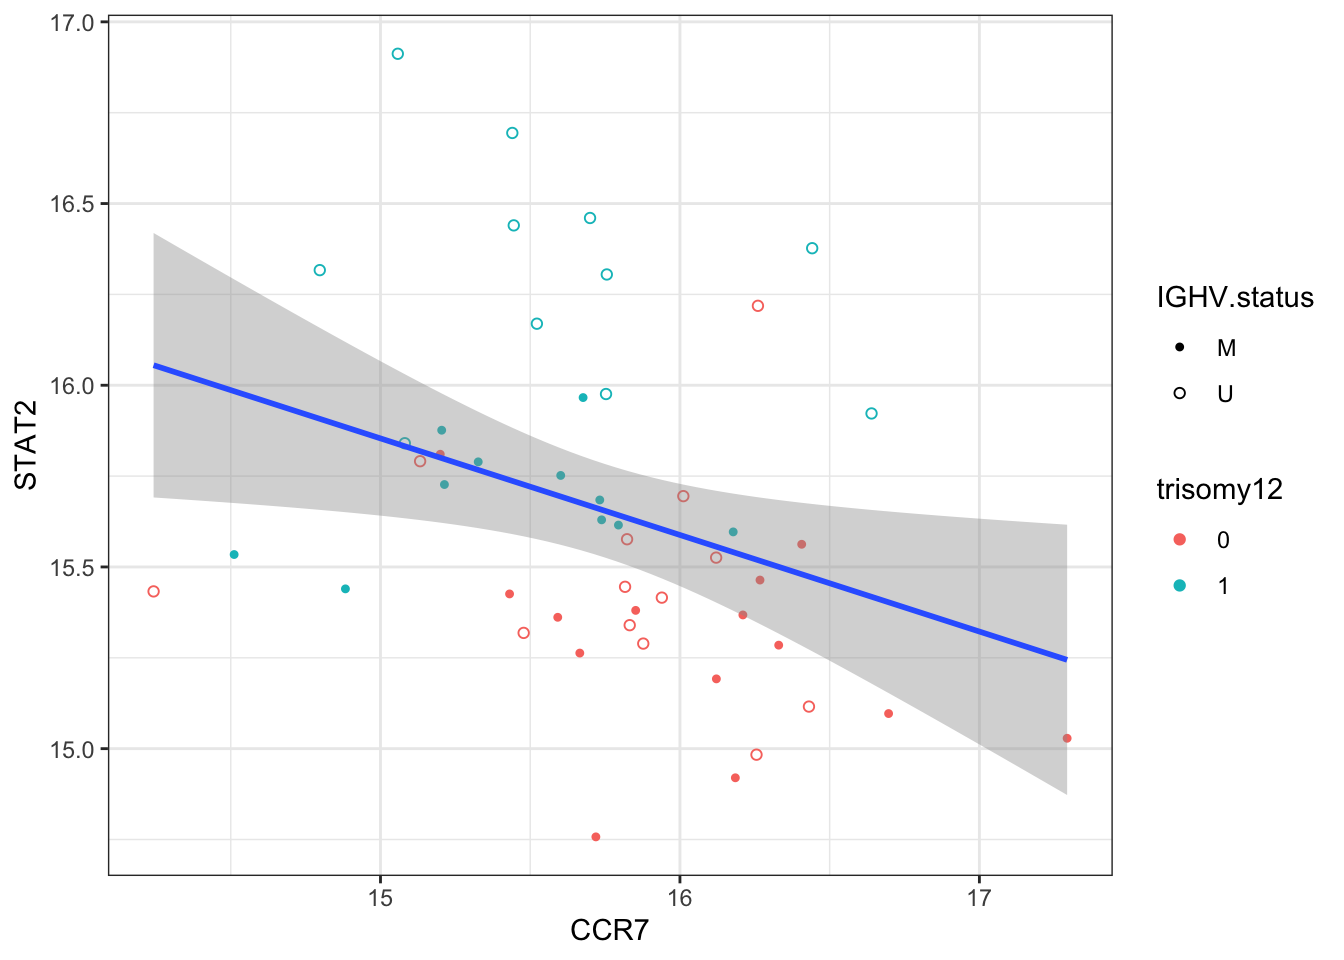
Correlation test
cor.test(plotTab$CCR7, plotTab$STAT2)
    Pearson's product-moment correlation

data:  plotTab$CCR7 and plotTab$STAT2
t = -2.3661, df = 47, p-value = 0.02215
alternative hypothesis: true correlation is not equal to 0
95 percent confidence interval:
 -0.55640138 -0.04960315
sample estimates:
       cor
-0.3262491
Does CXCR4 correlate with STAT2?
exprMat <- assays(protCLL)[["count"]]
exprProt <- exprMat[rowData(protCLL)$hgnc_symbol == "CXCR4",]
exprSTAT2 <- exprMat[rowData(protCLL)$hgnc_symbol == "STAT2",]
plotTab <- tibble(CXCR4 = exprProt, STAT2 = exprSTAT2, patID = colnames(exprMat)) %>%
  left_join(patMeta, by = c(patID = "Patient.ID"))
ggplot(plotTab, aes(x=CXCR4, y=STAT2)) + geom_point(aes(col = trisomy12, shape = IGHV.status)) +
  geom_smooth(method = "lm") +
  scale_shape_manual(values = c(U=1, M=20)) + theme_bw()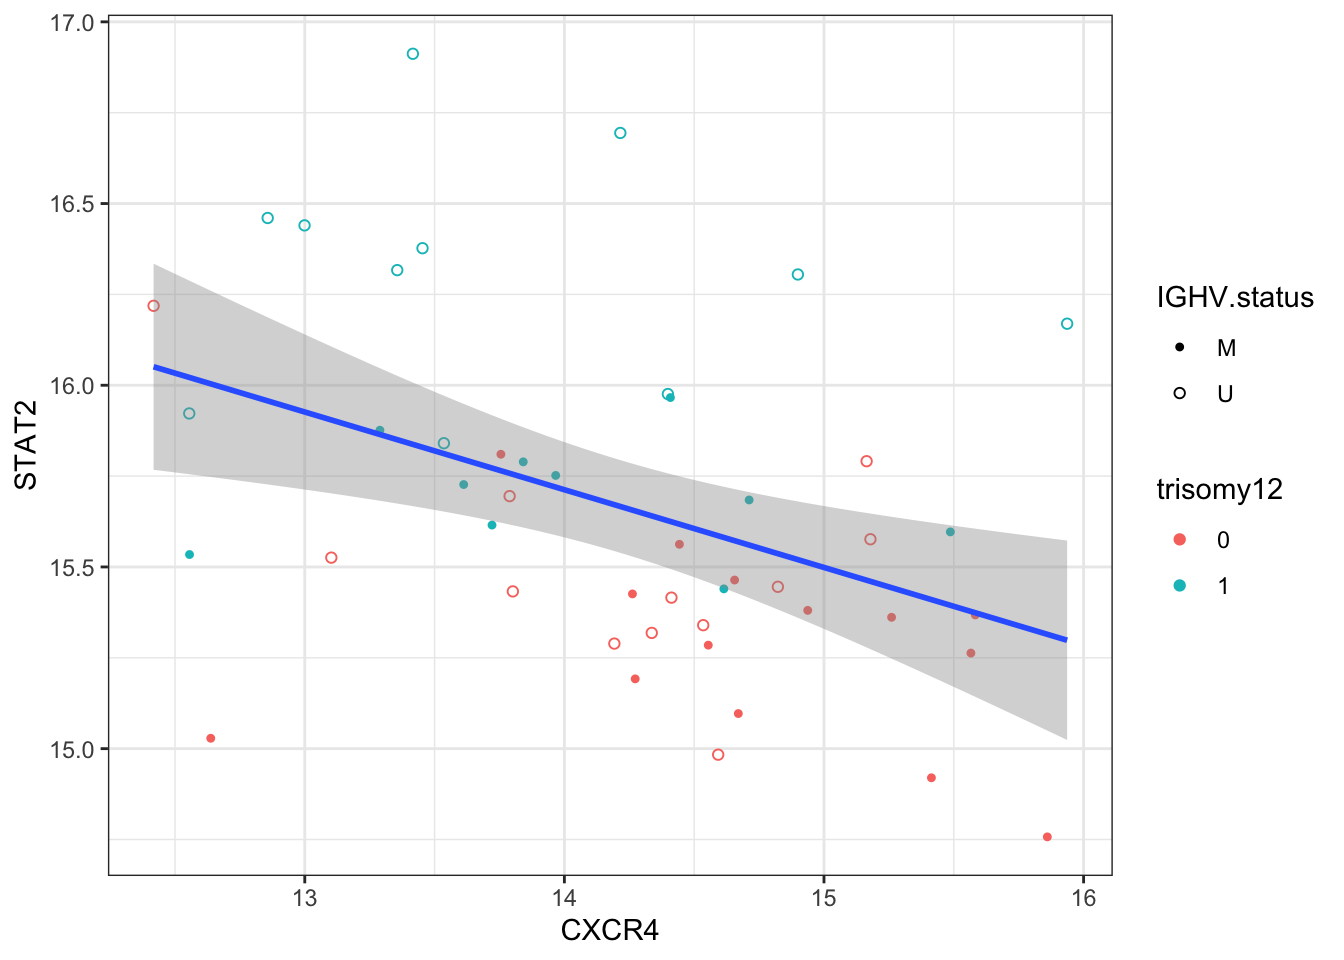
Correlation test
cor.test(plotTab$CXCR4, plotTab$STAT2)
    Pearson's product-moment correlation

data:  plotTab$CXCR4 and plotTab$STAT2
t = -3.0551, df = 45, p-value = 0.003774
alternative hypothesis: true correlation is not equal to 0
95 percent confidence interval:
 -0.6270111 -0.1445056
sample estimates:
      cor
-0.414473
Transcriptomics
colnames(dds) <- dds$PatID
dds <- estimateSizeFactors(dds)
sampleOverlap <- intersect(colnames(protCLL), colnames(dds))
ddsSub <- dds[rowData(dds)$symbol %in% cytoTab$symbol, sampleOverlap]
ddsSub <- ddsSub[rowSums(counts(ddsSub,normalized = TRUE))>0,]
How many cytokine mRNAs can be detected?
nrow(ddsSub)[1] 69rowData(ddsSub)$symbol [1] "IL20RA" "IFNGR1" "IL17RB" "IL4R" "IL12RB2" "IL5RA"
[7] "PITPNM3" "IL12RB1" "IL2RB" "IL21R" "IL27RA" "IL10RA"
[13] "CCR6" "IL1R2" "IL1R1" "IL1RL2" "IL1RL1" "IL18R1"
[19] "IL18RAP" "CCRL2" "CCR2" "CXCR4" "IL13RA2" "IL9R"
[25] "CCR7" "ACKR4" "IL13RA1" "IL6ST" "IL2RA" "IL15RA"
[31] "IL1RN" "IL11RA" "IFNAR1" "IL22RA1" "ACKR3" "ACKR2"
[37] "IL17RD" "IL2RG" "IFNAR2" "IFNGR2" "CXCR5" "IL6R"
[43] "CCR5" "CXCR1" "IL17RE" "IL17RC" "CCR1" "IL22RA2"
[49] "IL31RA" "CX3CR1" "IL7R" "IL1RAPL1" "CXCR6" "XCR1"
[55] "CCR9" "IL20RB" "IL17RA" "CCR8" "CXCR2" "CCR3"
[61] "CCR4" "CCR10" "IL3RA" "IFNLR1" "CXCR3" "IL1RAPL2"
[67] "IL1RAP" "ACKR1" "IL10RB" Does any mRNA expression correlate with STAT2 protein level?
ddsSub.voom <- ddsSub
assay(ddsSub.voom) <- voom(counts(ddsSub), lib.size = ddsSub$sizeFactor)$E
exprMat <- assay(ddsSub.voom)
protExpr <- assays(protCLL[,colnames(exprMat)])[["count"]][rowData(protCLL)$hgnc_symbol == "STAT2"]
designMat <- model.matrix(~protExpr)
fit <- lmFit(exprMat, designMat)
fit2 <- eBayes(fit)
resTab <- topTable(fit2, coef = "protExpr", number = "all") %>%
data.frame() %>% rownames_to_column("id") %>%
mutate(symbol = rowData(ddsSub[id,])$symbol)List of significant associations
resTab.sig <- filter(resTab, P.Value < 0.05) %>%
  select(id, symbol, logFC, P.Value, adj.P.Val)
resTab.sig %>% mutate_if(is.numeric, formatC, digits=2) %>%
DT::datatable()Plot significant associations (raw P < 0.05)
plotList <- lapply(seq(nrow(resTab.sig)), function(i) {
  gene <- resTab.sig[i,]$id
  name <- resTab.sig[i,]$symbol
  plotTab <- tibble(geneExp = counts(ddsSub,normalized = TRUE)[gene,],
                    protExp = protExpr, patID = colnames(exprMat)) %>%
    left_join(patMeta, by = c(patID = "Patient.ID"))

  ggplot(plotTab, aes(x=log2(geneExp), y=protExp)) +
    geom_point(aes(col = trisomy12, shape = IGHV.status)) +
    geom_smooth(method = "lm") +
    scale_shape_manual(values = c(U=1, M=20)) + theme_bw() +
    ylab("STAT2 protein expression") +
    xlab("log2 mRNA count") + ggtitle(name)
})

cowplot::plot_grid(plotlist= plotList, ncol=3)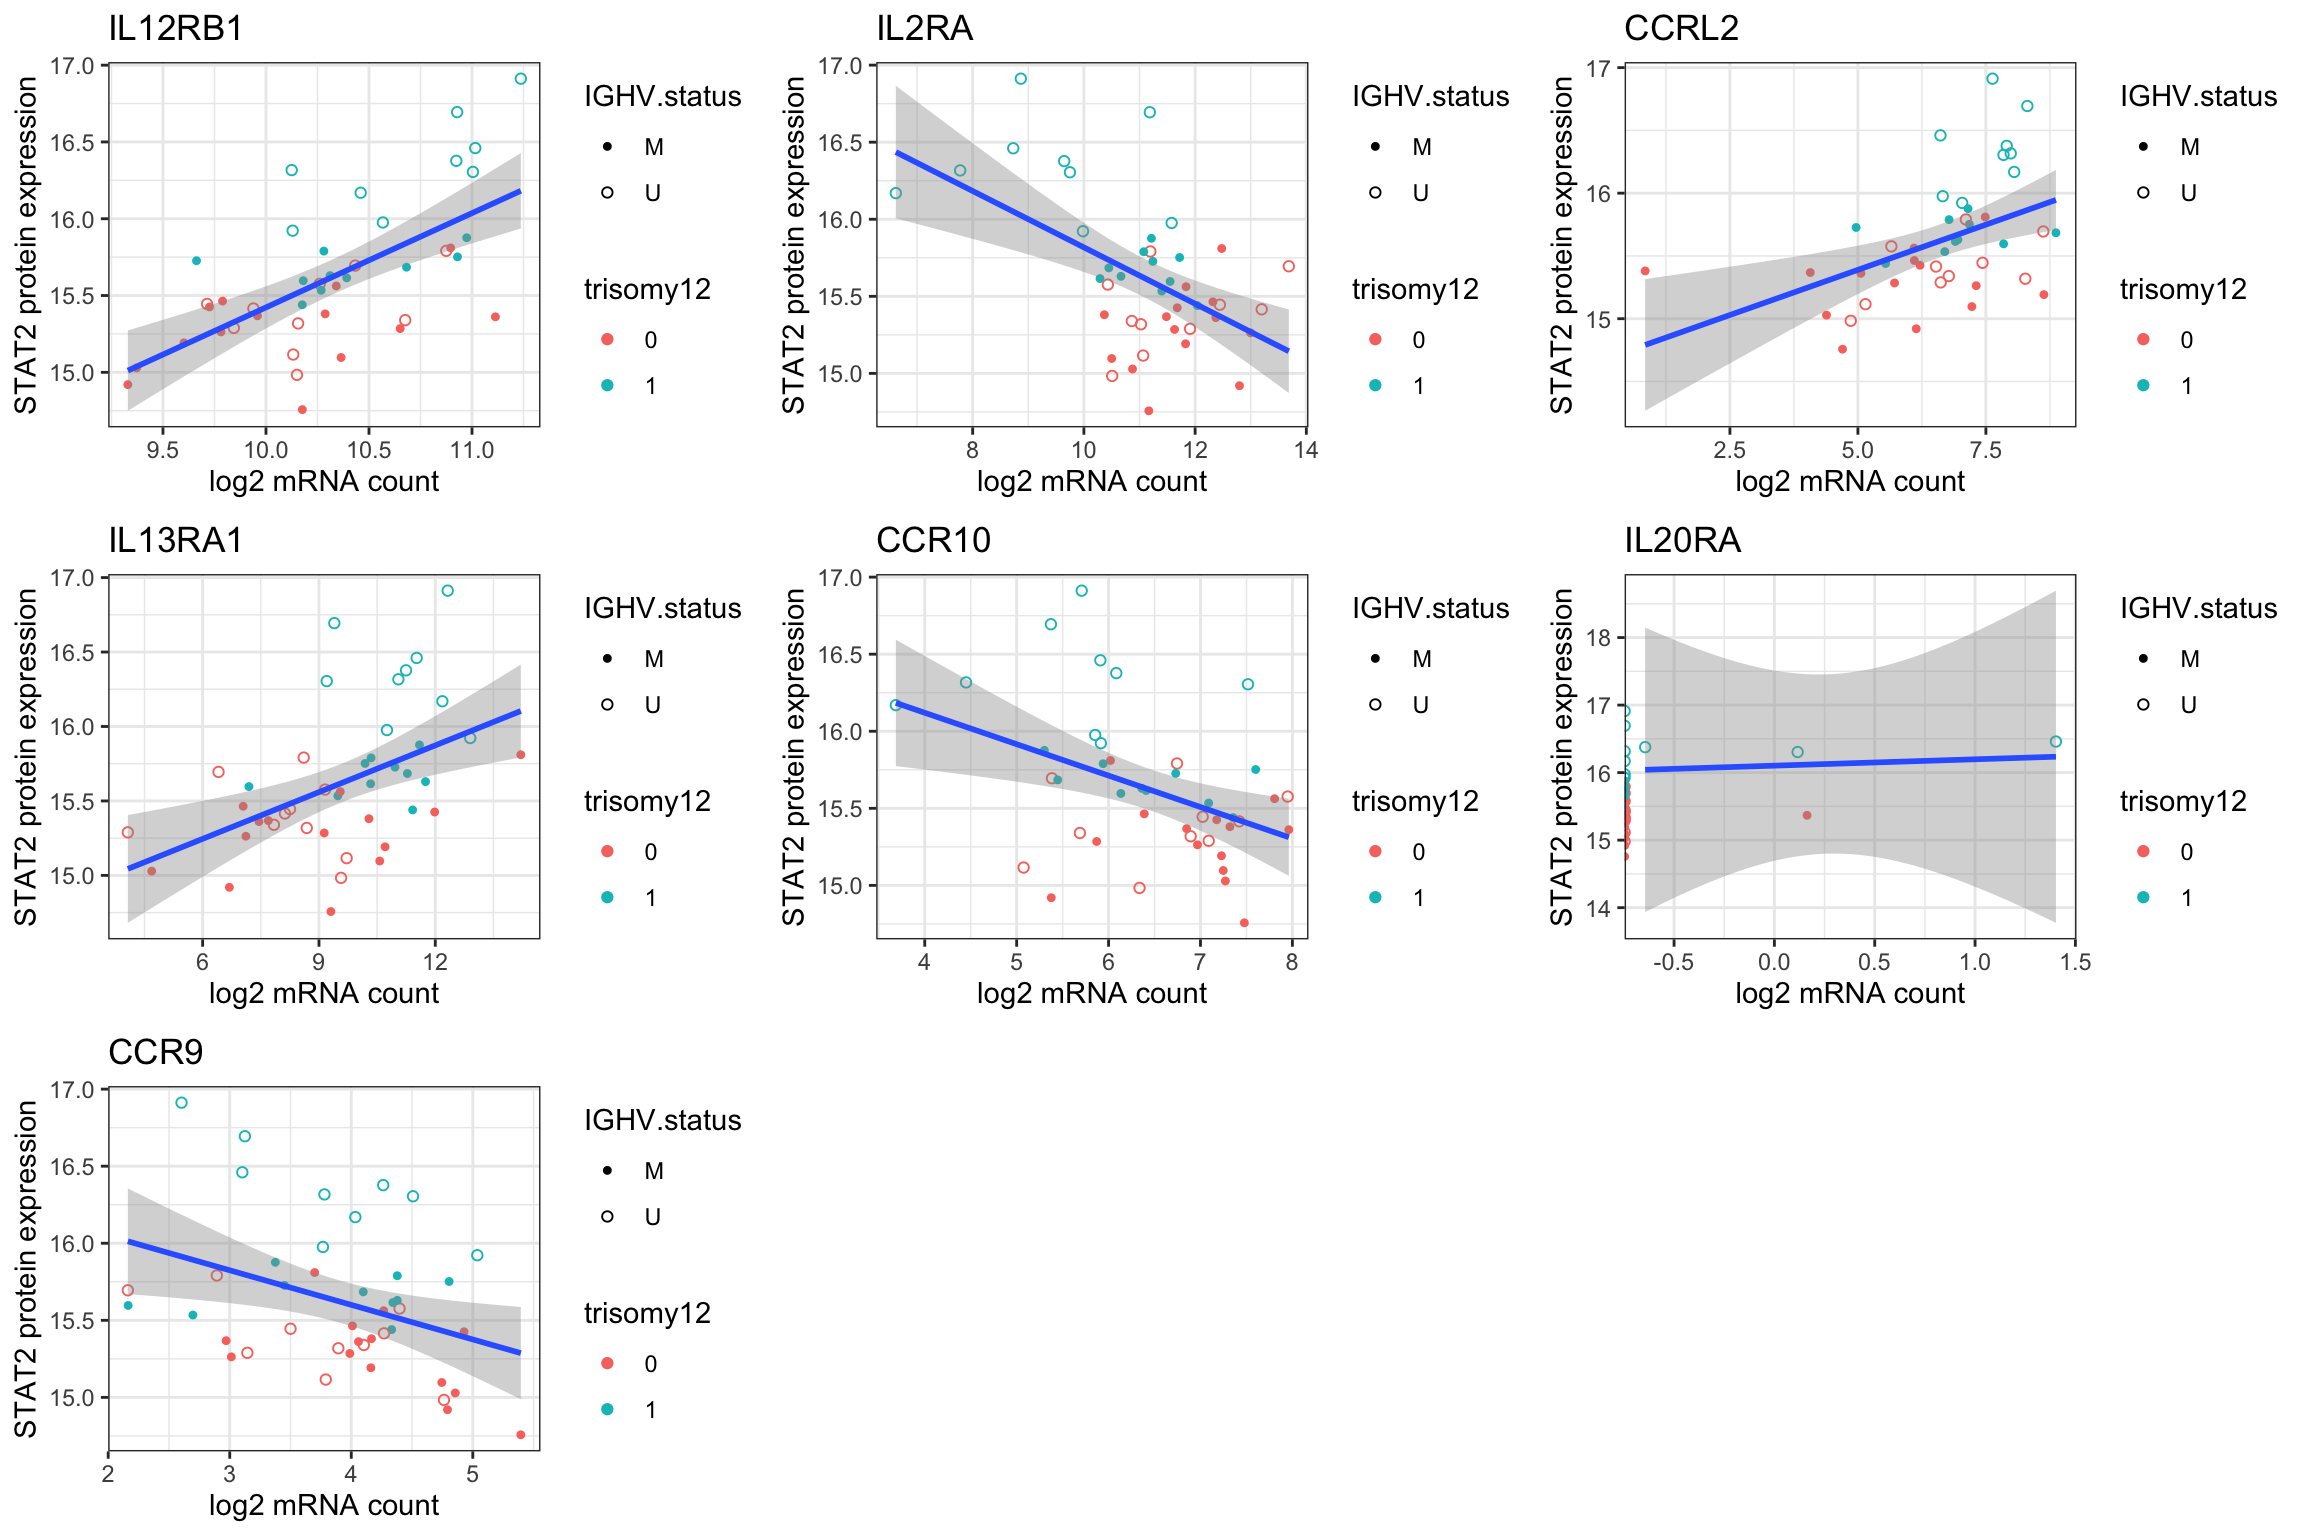
Heatmap of all detected cytokine receptor mRNAs
plotMat <- exprMat
plotMat <- jyluMisc::mscale(plotMat, censor = 5)
rownames(plotMat) <- rowData(ddsSub.voom)$symbol
colAnno <- patMeta %>% filter(Patient.ID %in% colnames(plotMat)) %>%
  select(Patient.ID, IGHV.status, trisomy12) %>%
  mutate(STAT2 = protExpr[match(Patient.ID,colnames(exprMat))]) %>%
  arrange(STAT2) %>%
  data.frame() %>% column_to_rownames("Patient.ID")
rowAnno <- tibble(gene = resTab$symbol) %>%
  mutate(type = cytoTab[match(gene, cytoTab$symbol),]$type) %>%
  data.frame() %>% column_to_rownames("gene")

plotMat <- plotMat[rownames(rowAnno), rownames(colAnno)]
pheatmap(plotMat, cluster_rows = FALSE, cluster_cols = FALSE,
         annotation_row = rowAnno, annotation_col = colAnno,
         color = colorRampPalette(c("blue","white","red"))(100))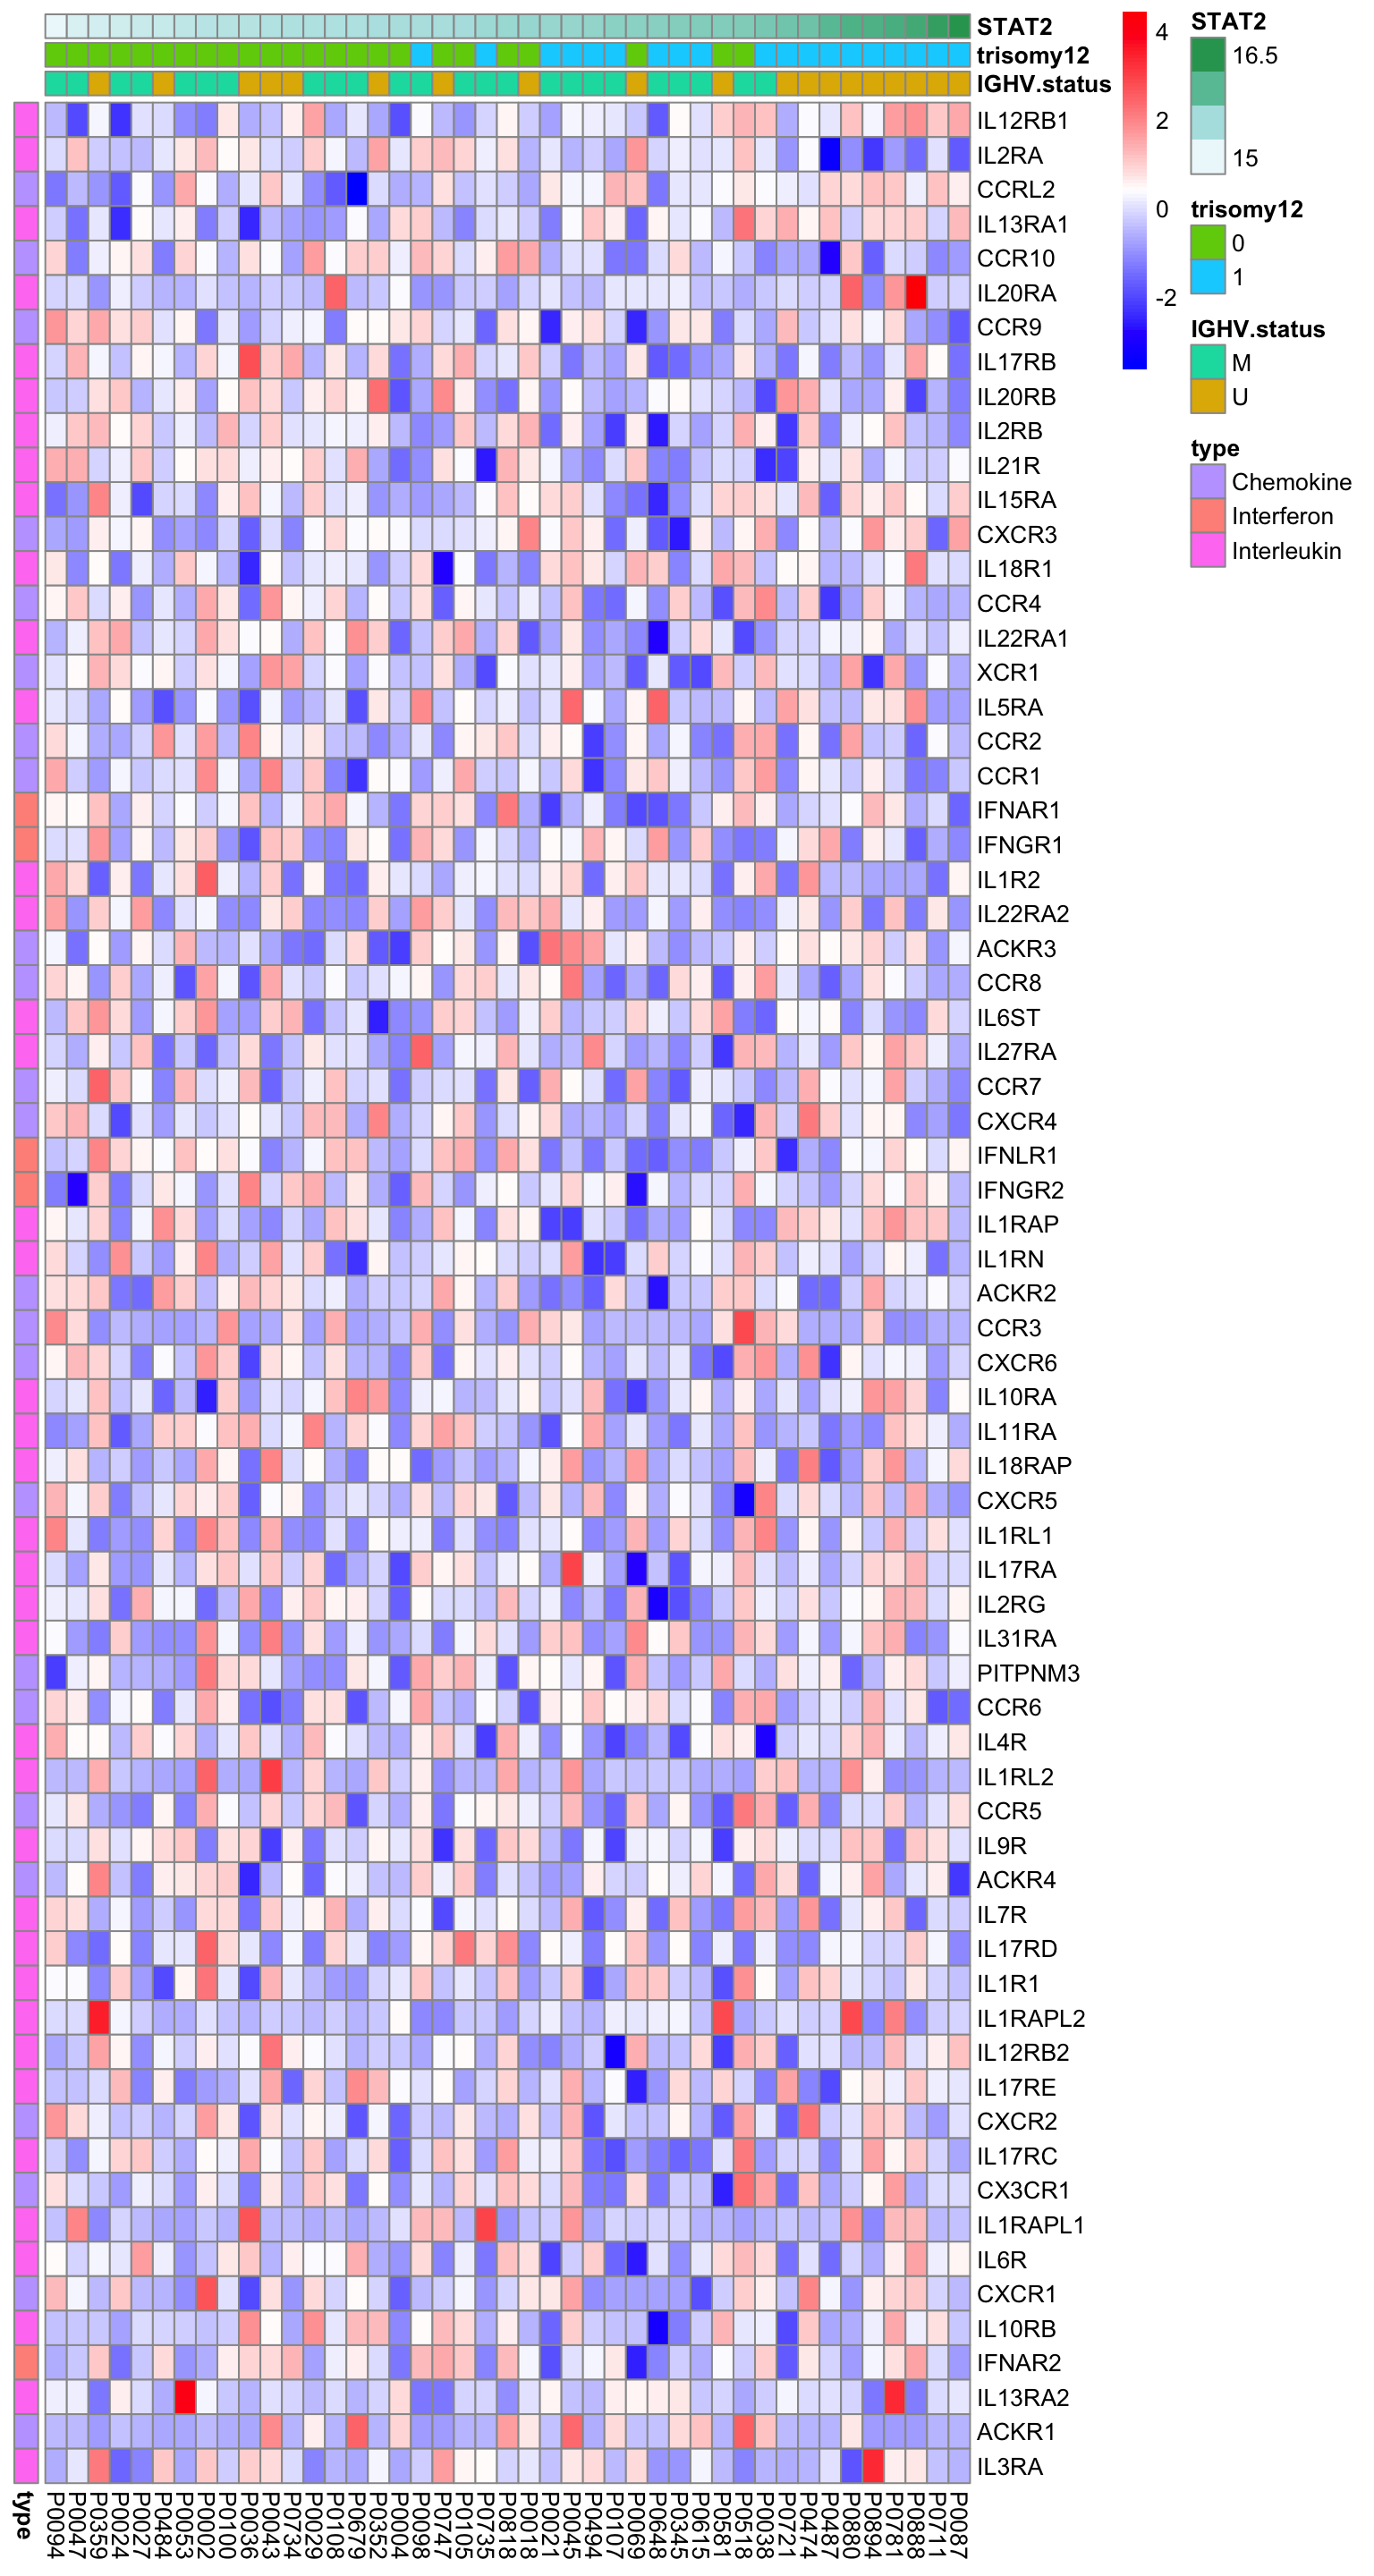
sessionInfo()R version 3.6.0 (2019-04-26)
Platform: x86_64-apple-darwin15.6.0 (64-bit)
Running under: macOS 10.15.6
Matrix products: default
BLAS: /Library/Frameworks/R.framework/Versions/3.6/Resources/lib/libRblas.0.dylib
LAPACK: /Library/Frameworks/R.framework/Versions/3.6/Resources/lib/libRlapack.dylib
locale:
[1] en_US.UTF-8/en_US.UTF-8/en_US.UTF-8/C/en_US.UTF-8/en_US.UTF-8
attached base packages:
[1] parallel stats4 stats graphics grDevices utils datasets
[8] methods base
other attached packages:
[1] forcats_0.5.0 stringr_1.4.0
[3] dplyr_1.0.0 purrr_0.3.4
[5] readr_1.3.1 tidyr_1.1.0
[7] tibble_3.0.3 ggplot2_3.3.2
[9] tidyverse_1.3.0 pheatmap_1.0.12
[11] DESeq2_1.26.0 SummarizedExperiment_1.16.1
[13] DelayedArray_0.12.3 BiocParallel_1.20.1
[15] matrixStats_0.56.0 Biobase_2.46.0
[17] GenomicRanges_1.38.0 GenomeInfoDb_1.22.1
[19] IRanges_2.20.2 S4Vectors_0.24.4
[21] BiocGenerics_0.32.0 jyluMisc_0.1.5
[23] limma_3.42.2
loaded via a namespace (and not attached):
[1] utf8_1.1.4 shinydashboard_0.7.1 tidyselect_1.1.0
[4] RSQLite_2.2.0 AnnotationDbi_1.48.0 htmlwidgets_1.5.1
[7] grid_3.6.0 maxstat_0.7-25 munsell_0.5.0
[10] codetools_0.2-16 DT_0.14 withr_2.2.0
[13] colorspace_1.4-1 knitr_1.29 rstudioapi_0.11
[16] ggsignif_0.6.0 labeling_0.3 git2r_0.27.1
[19] slam_0.1-47 GenomeInfoDbData_1.2.2 KMsurv_0.1-5
[22] bit64_0.9-7 farver_2.0.3 rprojroot_1.3-2
[25] vctrs_0.3.1 generics_0.0.2 TH.data_1.0-10
[28] xfun_0.15 sets_1.0-18 R6_2.4.1
[31] locfit_1.5-9.4 bitops_1.0-6 fgsea_1.12.0
[34] assertthat_0.2.1 promises_1.1.1 scales_1.1.1
[37] multcomp_1.4-13 nnet_7.3-14 gtable_0.3.0
[40] sandwich_2.5-1 workflowr_1.6.2 rlang_0.4.7
[43] genefilter_1.68.0 splines_3.6.0 rstatix_0.6.0
[46] acepack_1.4.1 broom_0.7.0 checkmate_2.0.0
[49] yaml_2.2.1 abind_1.4-5 modelr_0.1.8
[52] crosstalk_1.1.0.1 backports_1.1.8 httpuv_1.5.4
[55] Hmisc_4.4-0 tools_3.6.0 relations_0.6-9
[58] ellipsis_0.3.1 gplots_3.0.4 RColorBrewer_1.1-2
[61] Rcpp_1.0.5 base64enc_0.1-3 visNetwork_2.0.9
[64] zlibbioc_1.32.0 RCurl_1.98-1.2 ggpubr_0.4.0
[67] rpart_4.1-15 cowplot_1.0.0 zoo_1.8-8
[70] haven_2.3.1 cluster_2.1.0 exactRankTests_0.8-31
[73] fs_1.4.2 magrittr_1.5 data.table_1.12.8
[76] openxlsx_4.1.5 reprex_0.3.0 survminer_0.4.7
[79] mvtnorm_1.1-1 hms_0.5.3 shinyjs_1.1
[82] mime_0.9 evaluate_0.14 xtable_1.8-4
[85] XML_3.98-1.20 rio_0.5.16 jpeg_0.1-8.1
[88] readxl_1.3.1 gridExtra_2.3 compiler_3.6.0
[91] KernSmooth_2.23-17 crayon_1.3.4 htmltools_0.5.0
[94] mgcv_1.8-31 later_1.1.0.1 Formula_1.2-3
[97] geneplotter_1.64.0 lubridate_1.7.9 DBI_1.1.0
[100] dbplyr_1.4.4 MASS_7.3-51.6 Matrix_1.2-18
[103] car_3.0-8 cli_2.0.2 marray_1.64.0
[106] gdata_2.18.0 igraph_1.2.5 pkgconfig_2.0.3
[109] km.ci_0.5-2 foreign_0.8-71 piano_2.2.0
[112] xml2_1.3.2 annotate_1.64.0 XVector_0.26.0
[115] drc_3.0-1 rvest_0.3.5 digest_0.6.25
[118] rmarkdown_2.3 cellranger_1.1.0 fastmatch_1.1-0
[121] survMisc_0.5.5 htmlTable_2.0.1 curl_4.3
[124] shiny_1.5.0 gtools_3.8.2 lifecycle_0.2.0
[127] nlme_3.1-148 jsonlite_1.7.0 carData_3.0-4
[130] fansi_0.4.1 pillar_1.4.6 lattice_0.20-41
[133] fastmap_1.0.1 httr_1.4.1 plotrix_3.7-8
[136] survival_3.2-3 glue_1.4.1 zip_2.0.4
[139] png_0.1-7 bit_1.1-15.2 stringi_1.4.6
[142] blob_1.2.1 latticeExtra_0.6-29 caTools_1.18.0
[145] memoise_1.1.0