Correlate proteomic profiling with CLL-PD (CLL proliferative drive)
Junyan Lu
2020-03-09
Last updated: 2020-09-22
Checks: 5 2
Knit directory: Proteomics/analysis/
This reproducible R Markdown analysis was created with workflowr (version 1.6.2). The Checks tab describes the reproducibility checks that were applied when the results were created. The Past versions tab lists the development history.
The R Markdown file has unstaged changes. To know which version of the R Markdown file created these results, you'll want to first commit it to the Git repo. If you're still working on the analysis, you can ignore this warning. When you're finished, you can run wflow_publish to commit the R Markdown file and build the HTML.
Great job! The global environment was empty. Objects defined in the global environment can affect the analysis in your R Markdown file in unknown ways. For reproduciblity it's best to always run the code in an empty environment.
The command set.seed(20200227) was run prior to running the code in the R Markdown file. Setting a seed ensures that any results that rely on randomness, e.g. subsampling or permutations, are reproducible.
Great job! Recording the operating system, R version, and package versions is critical for reproducibility.
- unnamed-chunk-21
- unnamed-chunk-23
- unnamed-chunk-5
- unnamed-chunk-7
To ensure reproducibility of the results, delete the cache directory correlateCLLPD_cache and re-run the analysis. To have workflowr automatically delete the cache directory prior to building the file, set delete_cache = TRUE when running wflow_build() or wflow_publish().
Great job! Using relative paths to the files within your workflowr project makes it easier to run your code on other machines.
Great! You are using Git for version control. Tracking code development and connecting the code version to the results is critical for reproducibility.
The results in this page were generated with repository version 3fb50c5. See the Past versions tab to see a history of the changes made to the R Markdown and HTML files.
Note that you need to be careful to ensure that all relevant files for the analysis have been committed to Git prior to generating the results (you can use wflow_publish or wflow_git_commit). workflowr only checks the R Markdown file, but you know if there are other scripts or data files that it depends on. Below is the status of the Git repository when the results were generated:
Ignored files:
    Ignored:    .DS_Store
    Ignored:    .Rhistory
    Ignored:    .Rproj.user/
    Ignored:    analysis/.DS_Store
    Ignored:    analysis/.Rhistory
    Ignored:    analysis/correlateCLLPD_cache/
    Ignored:    analysis/lassoForSTAT2_cache/
    Ignored:    analysis/manuscript_S1_Overview_cache/
    Ignored:    analysis/manuscript_S2_genomicAssociation_oldTimsTOF_cache/
    Ignored:    analysis/manuscript_S3_trisomy12_cache/
    Ignored:    analysis/manuscript_S4_IGHV_cache/
    Ignored:    analysis/manuscript_S4_IGHV_oldTimsTOF_cache/
    Ignored:    analysis/manuscript_S6_del11q_oldTimsTOF_cache/
    Ignored:    analysis/manuscript_S8_drugResponse_Outcomes_cache/
    Ignored:    analysis/manuscript_S9_STAT2_cache/
    Ignored:    code/.Rhistory
    Ignored:    data/.DS_Store
    Ignored:    output/.DS_Store

Untracked files:
    Untracked:  analysis/.trisomy12_norm.pdf
    Untracked:  analysis/CNVanalysis_11q.Rmd
    Untracked:  analysis/CNVanalysis_trisomy12.Rmd
    Untracked:  analysis/CNVanalysis_trisomy19.Rmd
    Untracked:  analysis/STAT2_cytokines.Rmd
    Untracked:  analysis/SUGP1_splicing.svg.xml
    Untracked:  analysis/analysisDrugResponses.Rmd
    Untracked:  analysis/analysisDrugResponses_IC50.Rmd
    Untracked:  analysis/analysisPCA.Rmd
    Untracked:  analysis/analysisPreliminary_LUMOS.Rmd
    Untracked:  analysis/analysisPreliminary_timsTOF_Hela.Rmd
    Untracked:  analysis/analysisPreliminary_timsTOF_new.Rmd
    Untracked:  analysis/analysisSplicing.Rmd
    Untracked:  analysis/analysisTrisomy19.Rmd
    Untracked:  analysis/annotateCNV.Rmd
    Untracked:  analysis/comparePlatforms_LUMOS_helaTimsTOF.Rmd
    Untracked:  analysis/comparePlatforms_LUMOS_newTimsTOF.Rmd
    Untracked:  analysis/comparePlatforms_newTimsTOF_helaTimsTOF.Rmd
    Untracked:  analysis/complexAnalysis_IGHV.Rmd
    Untracked:  analysis/complexAnalysis_IGHV_alternative.Rmd
    Untracked:  analysis/complexAnalysis_overall.Rmd
    Untracked:  analysis/complexAnalysis_trisomy12.Rmd
    Untracked:  analysis/complexAnalysis_trisomy12_alternative.Rmd
    Untracked:  analysis/correlateGenomic_PC12adjusted.Rmd
    Untracked:  analysis/correlateGenomic_noBlock.Rmd
    Untracked:  analysis/correlateGenomic_noBlock_MCLL.Rmd
    Untracked:  analysis/correlateGenomic_noBlock_UCLL.Rmd
    Untracked:  analysis/correlateGenomic_timsTOFnew.Rmd
    Untracked:  analysis/correlateGenomic_timsTOFnewHela.Rmd
    Untracked:  analysis/correlateRNAexpression.Rmd
    Untracked:  analysis/default.css
    Untracked:  analysis/del11q.pdf
    Untracked:  analysis/del11q_norm.pdf
    Untracked:  analysis/full_diff_list.csv
    Untracked:  analysis/lassoForSTAT2.Rmd
    Untracked:  analysis/manuscript_S0_PrepareData.Rmd
    Untracked:  analysis/manuscript_S1_Overview.Rmd
    Untracked:  analysis/manuscript_S2_genomicAssociation.Rmd
    Untracked:  analysis/manuscript_S2_genomicAssociation_oldTimsTOF.Rmd
    Untracked:  analysis/manuscript_S3_trisomy12.Rmd
    Untracked:  analysis/manuscript_S4_IGHV.Rmd
    Untracked:  analysis/manuscript_S4_IGHV_oldTimsTOF.Rmd
    Untracked:  analysis/manuscript_S5_trisomy19.Rmd
    Untracked:  analysis/manuscript_S6_del11q.Rmd
    Untracked:  analysis/manuscript_S6_del11q_oldTimsTOF.Rmd
    Untracked:  analysis/manuscript_S7_SF3B1.Rmd
    Untracked:  analysis/manuscript_S8_drugResponse_Outcomes.Rmd
    Untracked:  analysis/manuscript_S9_STAT2.Rmd
    Untracked:  analysis/peptideValidate.Rmd
    Untracked:  analysis/plotCNV_del11q.pdf
    Untracked:  analysis/plotExpressionCNV.Rmd
    Untracked:  analysis/processPeptides_LUMOS.Rmd
    Untracked:  analysis/processProteomics_timsTOF_Hela.Rmd
    Untracked:  analysis/processProteomics_timsTOF_new.Rmd
    Untracked:  analysis/protCLL.RData
    Untracked:  analysis/qualityControl_timsTOF_Hela.Rmd
    Untracked:  analysis/qualityControl_timsTOF_new.Rmd
    Untracked:  analysis/style.css
    Untracked:  analysis/tableS1_DE_proteins_p0.01.xlsx
    Untracked:  analysis/test.pdf
    Untracked:  analysis/test.svg
    Untracked:  analysis/tri12Enrich.pdf
    Untracked:  analysis/trisomy12.pdf
    Untracked:  analysis/trisomy12_AFcor.Rmd
    Untracked:  analysis/trisomy12_norm.pdf
    Untracked:  code/AlteredPQR.R
    Untracked:  code/utils.R
    Untracked:  data/190909_CLL_prot_abund_med_norm.tsv
    Untracked:  data/190909_CLL_prot_abund_no_norm.tsv
    Untracked:  data/200725_cll_diaPASEF_direct_reports/
    Untracked:  data/200728_cll_diaPASEF_direct_plus_hela_reports/
    Untracked:  data/20190423_Proteom_submitted_samples_bereinigt.xlsx
    Untracked:  data/20191025_Proteom_submitted_samples_final.xlsx
    Untracked:  data/Chemokines.csv
    Untracked:  data/IFN_list.csv
    Untracked:  data/IFNreceptor.csv
    Untracked:  data/Interleukin_receptor.csv
    Untracked:  data/Interleukins.csv
    Untracked:  data/LUMOS/
    Untracked:  data/LUMOS_peptides/
    Untracked:  data/LUMOS_protAnnotation.csv
    Untracked:  data/LUMOS_protAnnotation_fix.csv
    Untracked:  data/SampleAnnotation_cleaned.xlsx
    Untracked:  data/chemoReceptor.csv
    Untracked:  data/example_proteomics_data
    Untracked:  data/facTab_IC50atLeast3New.RData
    Untracked:  data/gmts/
    Untracked:  data/mapEnsemble.txt
    Untracked:  data/mapSymbol.txt
    Untracked:  data/proteins_in_complexes
    Untracked:  data/pyprophet_export_aligned.csv
    Untracked:  data/timsTOF_protAnnotation.csv
    Untracked:  output/Fig1A.pdf
    Untracked:  output/Fig1A.png
    Untracked:  output/Fig1A.pptx
    Untracked:  output/LUMOS_processed.RData
    Untracked:  output/MSH6_splicing.svg
    Untracked:  output/SUGP1_splicing.eps
    Untracked:  output/SUGP1_splicing.pdf
    Untracked:  output/SUGP1_splicing.svg
    Untracked:  output/cnv_plots.zip
    Untracked:  output/cnv_plots/
    Untracked:  output/cnv_plots_norm.zip
    Untracked:  output/ddsrna_enc.RData
    Untracked:  output/deResList.RData
    Untracked:  output/deResList_timsTOF.RData
    Untracked:  output/deResList_timsTOF_old.RData
    Untracked:  output/dxdCLL.RData
    Untracked:  output/dxdCLL2.RData
    Untracked:  output/encMap.RData
    Untracked:  output/exprCNV.RData
    Untracked:  output/exprCNV_enc.RData
    Untracked:  output/lassoResults_CPS.RData
    Untracked:  output/lassoResults_IC50.RData
    Untracked:  output/patMeta_enc.RData
    Untracked:  output/pepCLL_lumos.RData
    Untracked:  output/pepCLL_lumos_enc.RData
    Untracked:  output/pepTab_lumos.RData
    Untracked:  output/pheno1000_enc.RData
    Untracked:  output/pheno1000_main.RData
    Untracked:  output/plotCNV_allChr11_diff.pdf
    Untracked:  output/plotCNV_del11q_sum.pdf
    Untracked:  output/proteomic_LUMOS_20200227.RData
    Untracked:  output/proteomic_LUMOS_20200320.RData
    Untracked:  output/proteomic_LUMOS_20200430.RData
    Untracked:  output/proteomic_LUMOS_enc.RData
    Untracked:  output/proteomic_timsTOF_20200227.RData
    Untracked:  output/proteomic_timsTOF_Hela_20200806.RData
    Untracked:  output/proteomic_timsTOF_enc.RData
    Untracked:  output/proteomic_timsTOF_new_20200806.RData
    Untracked:  output/proteomic_timsTOF_old_enc.RData
    Untracked:  output/splicingResults.RData
    Untracked:  output/survival_enc.RData
    Untracked:  output/timsTOF_processed.RData
    Untracked:  plotCNV_del11q_diff.pdf
    Untracked:  summary/
    Untracked:  supp_latex/

Unstaged changes:
    Modified:   analysis/_site.yml
    Modified:   analysis/analysisSF3B1.Rmd
    Modified:   analysis/compareProteomicsRNAseq.Rmd
    Modified:   analysis/correlateCLLPD.Rmd
    Modified:   analysis/correlateGenomic.Rmd
    Deleted:    analysis/correlateGenomic_removePC.Rmd
    Modified:   analysis/correlateMIR.Rmd
    Modified:   analysis/correlateMethylationCluster.Rmd
    Modified:   analysis/index.Rmd
    Modified:   analysis/predictOutcome.Rmd
    Modified:   analysis/processProteomics_LUMOS.Rmd
    Modified:   analysis/qualityControl_LUMOS.Rmd
Note that any generated files, e.g. HTML, png, CSS, etc., are not included in this status report because it is ok for generated content to have uncommitted changes.
These are the previous versions of the repository in which changes were made to the R Markdown (analysis/correlateCLLPD.Rmd) and HTML (public/correlateCLLPD.html) files. If you've configured a remote Git repository (see ?wflow_git_remote), click on the hyperlinks in the table below to view the files as they were in that past version.
| File | Version | Author | Date | Message |
|---|---|---|---|---|
| html | b8e0823 | Junyan Lu | 2020-03-10 | Build site. |
| Rmd | c8cb45c | Junyan Lu | 2020-03-10 | update analysis |
Distribution of CLL-PD in proteomic cohort compared to the whole cohort
plotTab <- facTab %>% mutate(proteomSample = ifelse(patID %in% colnames(protCLL),"yes","no")) %>%
  mutate(IGHV = patMeta[match(patID, patMeta$Patient.ID),]$IGHV.status) %>%
  arrange(factor) %>% mutate(patID = factor(patID, levels = patID)) %>%
  filter(!is.na(factor)) %>% filter(!is.na(IGHV))

ggplot(plotTab, aes(x=patID, y=factor)) +
  geom_bar(stat ="identity", aes(fill = proteomSample), width = 0.8) +
  scale_fill_manual(values = c(yes = "red", no = "grey80")) +
  theme_bw() +
  theme(axis.text.x = element_blank())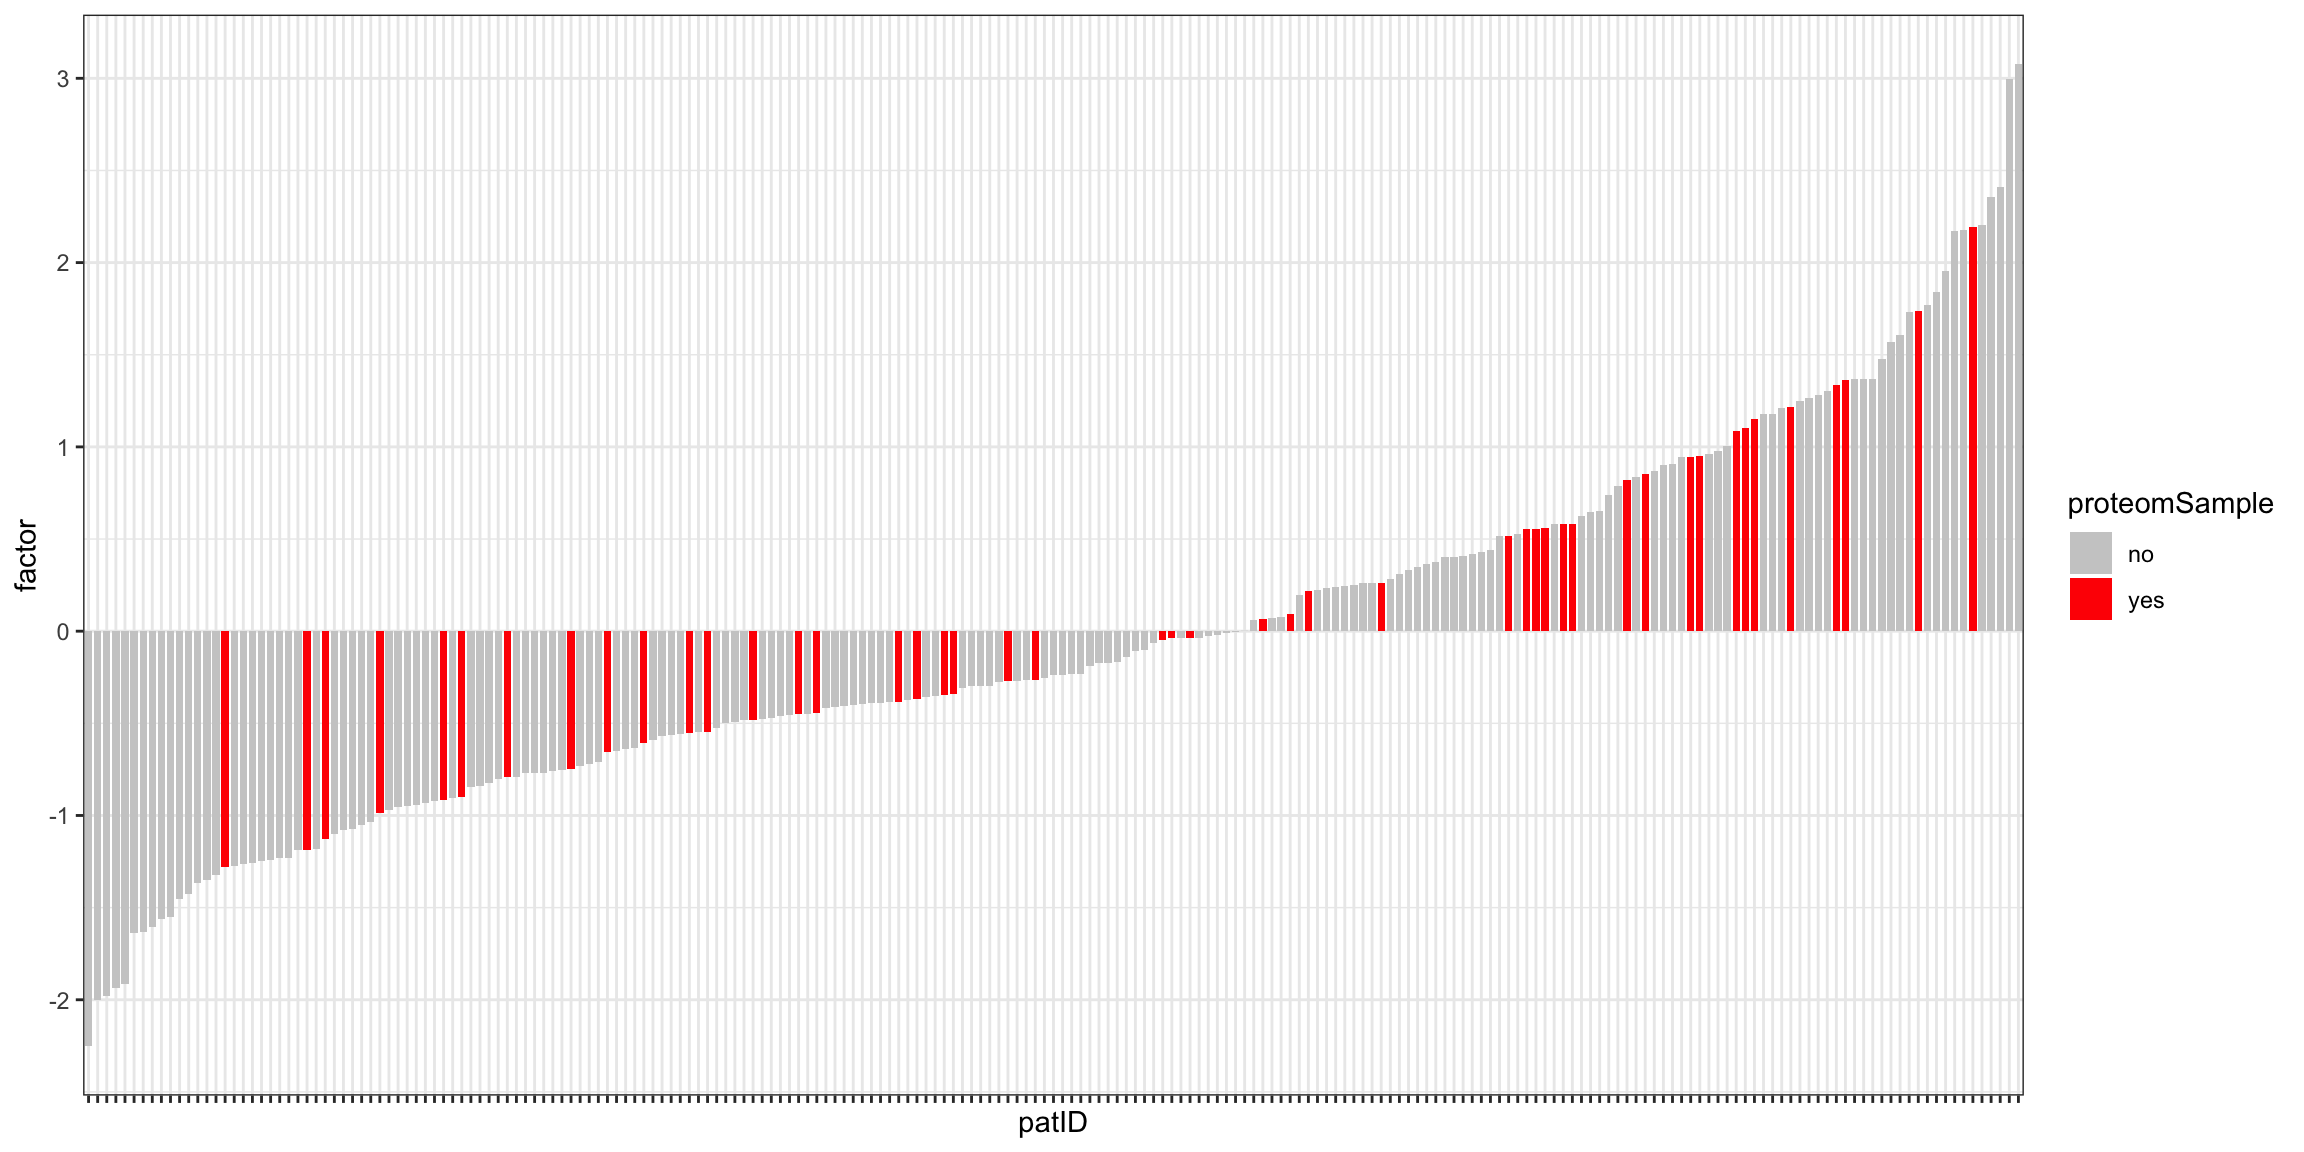
ggplot(plotTab, aes(x=IGHV,y=factor)) + geom_boxplot(aes(fill = IGHV)) + geom_point()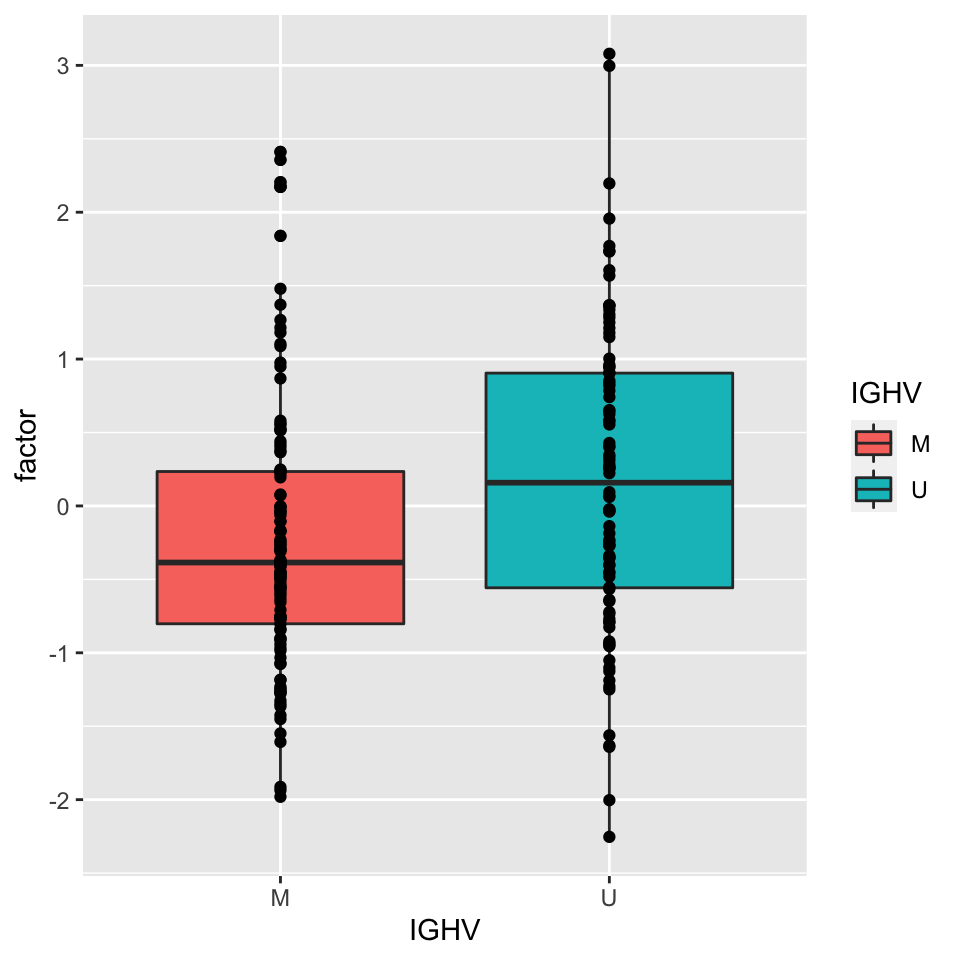
ggplot(filter(plotTab,proteomSample == "yes"), aes(x=IGHV,y=factor)) + geom_boxplot(aes(fill = IGHV)) + geom_point()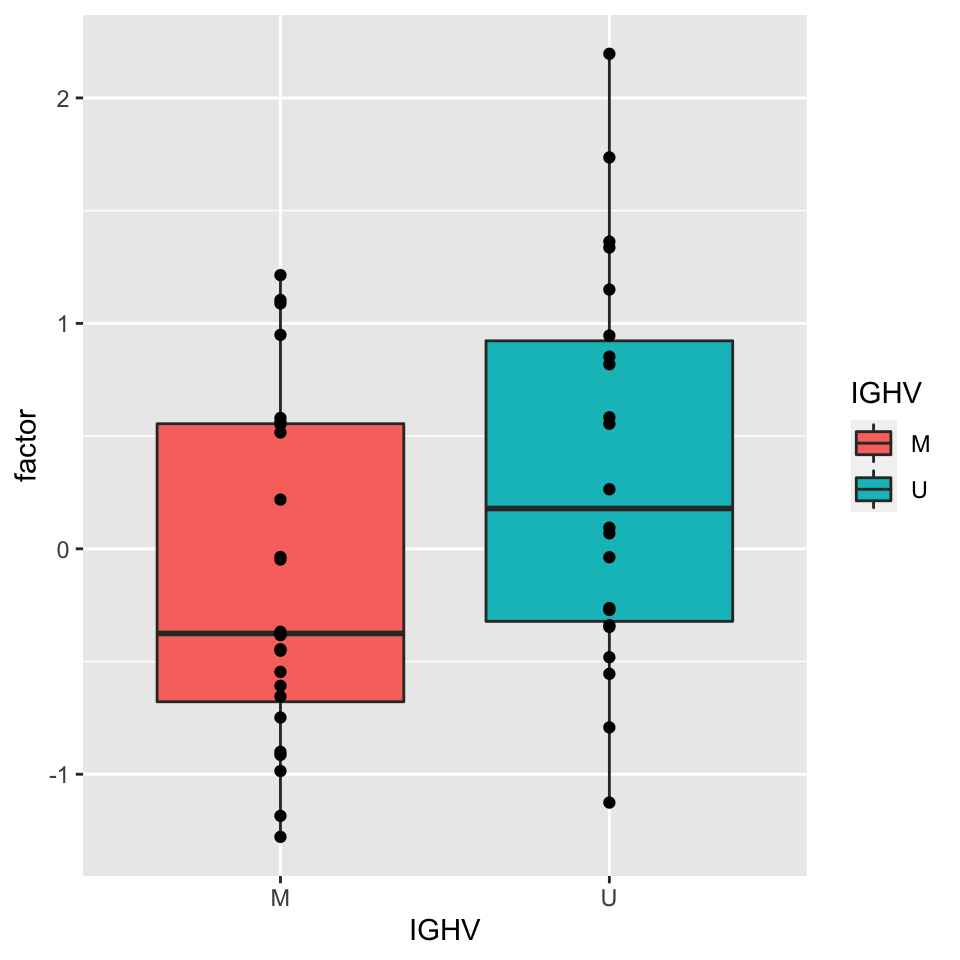
Detect proteins correlated with CLL-PD (LF4)
Process datasets
Process proteomics data
protCLL$LF4 <- facTab[match(colnames(protCLL), facTab$patID),]$factor
protCLL <- protCLL[,!is.na(protCLL$LF4)]
protMat <- assays(protCLL)[["count"]] #without imputation
**How many samples have CLL-PD value?
ncol(protMat)[1] 46Correlate protein expression with CLL-PD using proDA
Fit the probailistic dropout model
LF4 <- protCLL$LF4
fit <- proDA(protMat, design = ~ LF4)
Test for differentially expressed proteins
resTab <- test_diff(fit, "LF4") %>%
  dplyr::rename(id = name, logFC = diff, t=t_statistic,
                P.Value = pval, adj.P.Val = adj_pval) %>%
  mutate(name = rowData(protCLL[id,])$hgnc_symbol) %>%
  select(name, id, logFC, t, P.Value, adj.P.Val, n_obs) %>%
  arrange(P.Value) %>%
  as_tibble()
P-value histogram
ggplot(resTab, aes(x=P.Value)) + geom_histogram(fill = "lightblue",col="grey50") + xlim(0,1)`stat_bin()` using `bins = 30`. Pick better value with `binwidth`.Warning: Removed 2 rows containing missing values (geom_bar).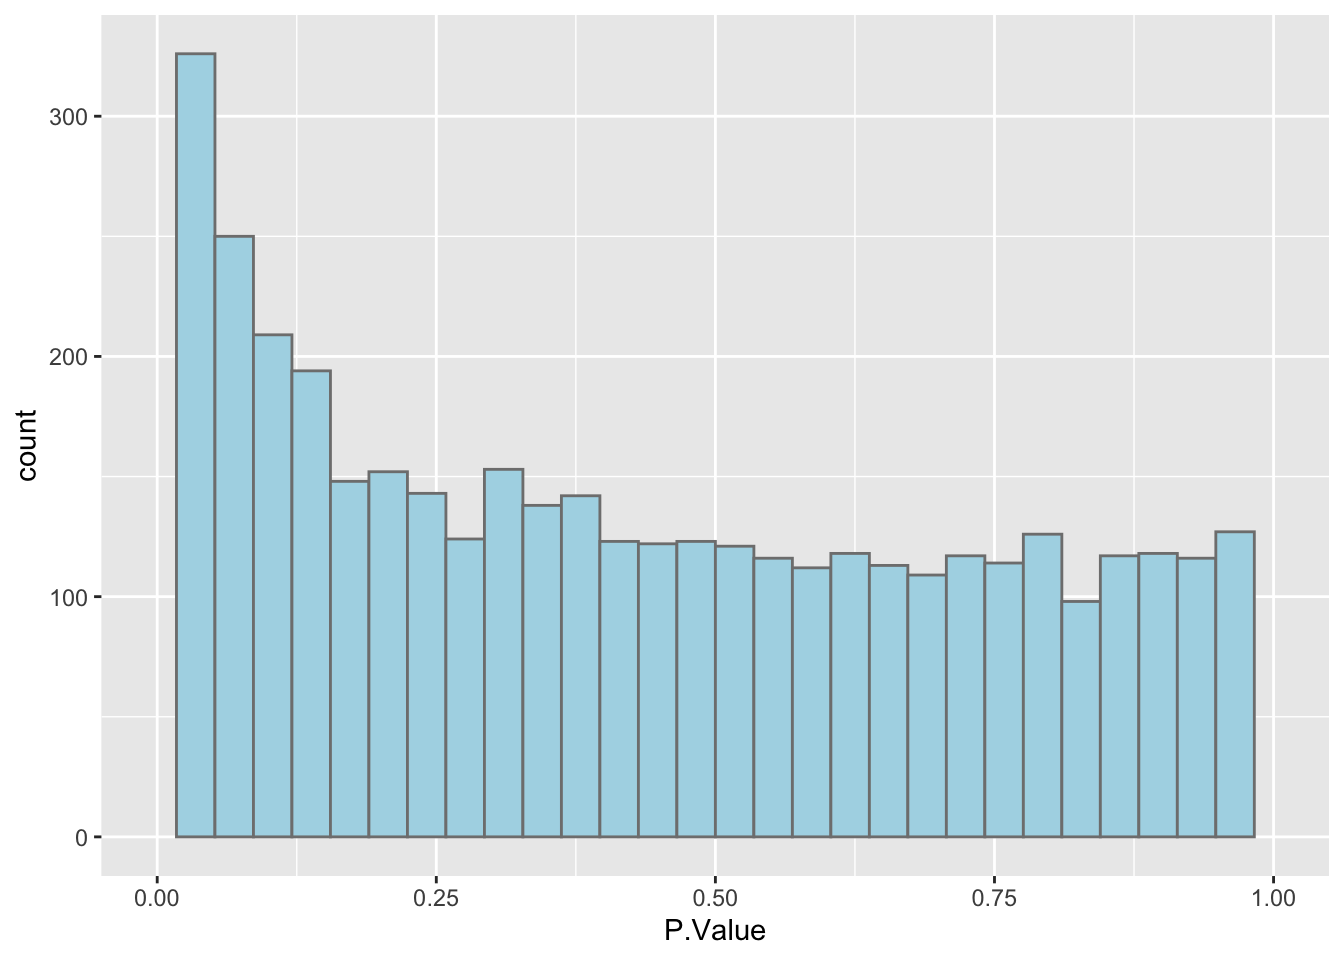
| Version | Author | Date |
|---|---|---|
| b8e0823 | Junyan Lu | 2020-03-10 |
Heatmap of significantly associated proteins (10% FDR)
colAnno <- tibble(patID = colnames(protMat),
CLL_PD = protCLL$LF4,
IGHV = protCLL$IGHV.status,
trisomy12 = protCLL$trisomy12) %>%
arrange(CLL_PD) %>% data.frame() %>% column_to_rownames("patID")
plotMat <- assays(protCLL[corRes.sig$id,rownames(colAnno)])[["QRILC"]]
plotMat <- jyluMisc::mscale(plotMat, censor = 6)
pheatmap(plotMat, scale = "none", annotation_col = colAnno, clustering_method = "ward.D2",
cluster_cols = FALSE,
labels_row = corRes.sig$name,
color = colorRampPalette(c("navy","white","firebrick"))(100),
breaks = seq(-6,6, length.out = 101))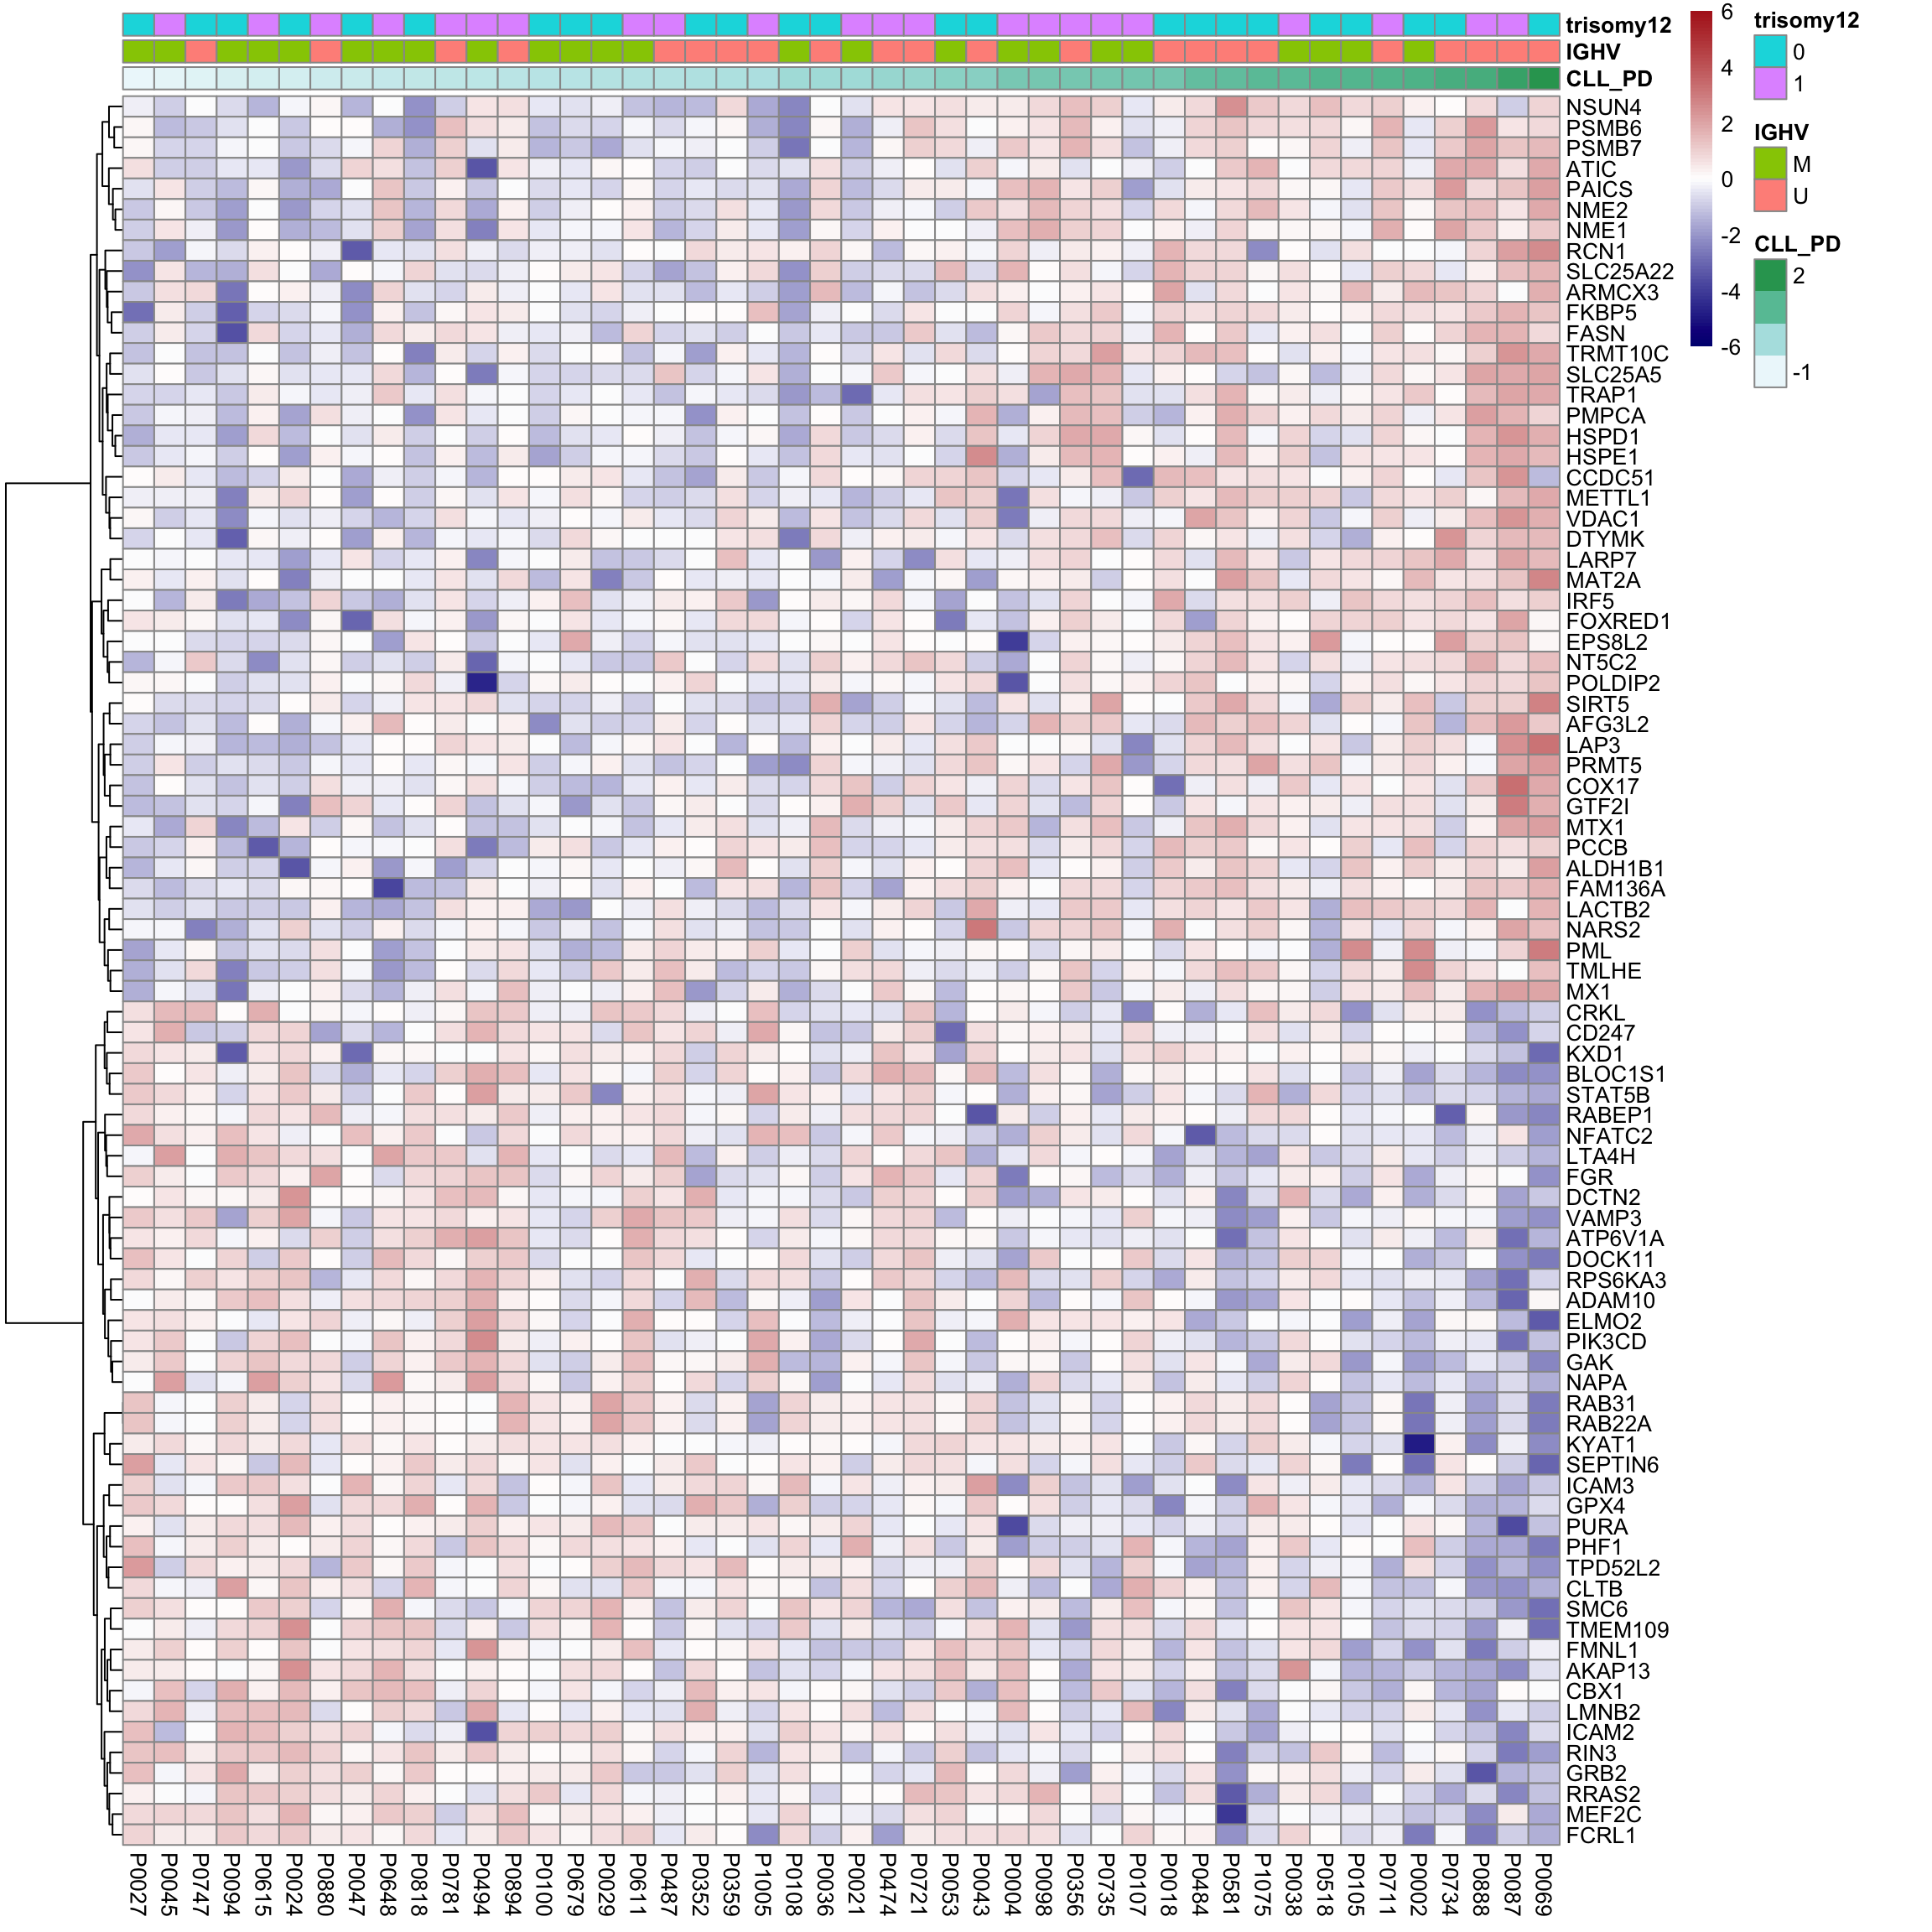 IGHV could be a potential confounder here. As the top six proteomics samples with highest CLL-PD are U-CLLs
Scatter plot of the top 9 associations
plotList <- lapply(seq(1,9),function(i) {
  id <- corRes.sig[i,]$id
  name <- corRes.sig[i,]$name
  plotTab <- tibble(patID = colnames(protMat),
                    CLL_PD = protCLL$LF4,
                    prot = protMat[id,],
                    IGHV = protCLL$IGHV.status)
  R2 <- cor(plotTab$prot, plotTab$CLL_PD,use = "pairwise.complete.obs")^2
  ggplot(plotTab, aes(x=CLL_PD, y=prot)) + geom_point(aes(col = IGHV)) +
    geom_smooth(method="lm") +
    xlab("CLL-PD") + ylab(name) + ggtitle(sprintf("R2 = %1.1f",R2))
})
plot_grid(plotlist = plotList, ncol =3)
`geom_smooth()` using formula 'y ~ x'
`geom_smooth()` using formula 'y ~ x'
`geom_smooth()` using formula 'y ~ x'
`geom_smooth()` using formula 'y ~ x'
`geom_smooth()` using formula 'y ~ x'
`geom_smooth()` using formula 'y ~ x'
`geom_smooth()` using formula 'y ~ x'
`geom_smooth()` using formula 'y ~ x'
`geom_smooth()` using formula 'y ~ x'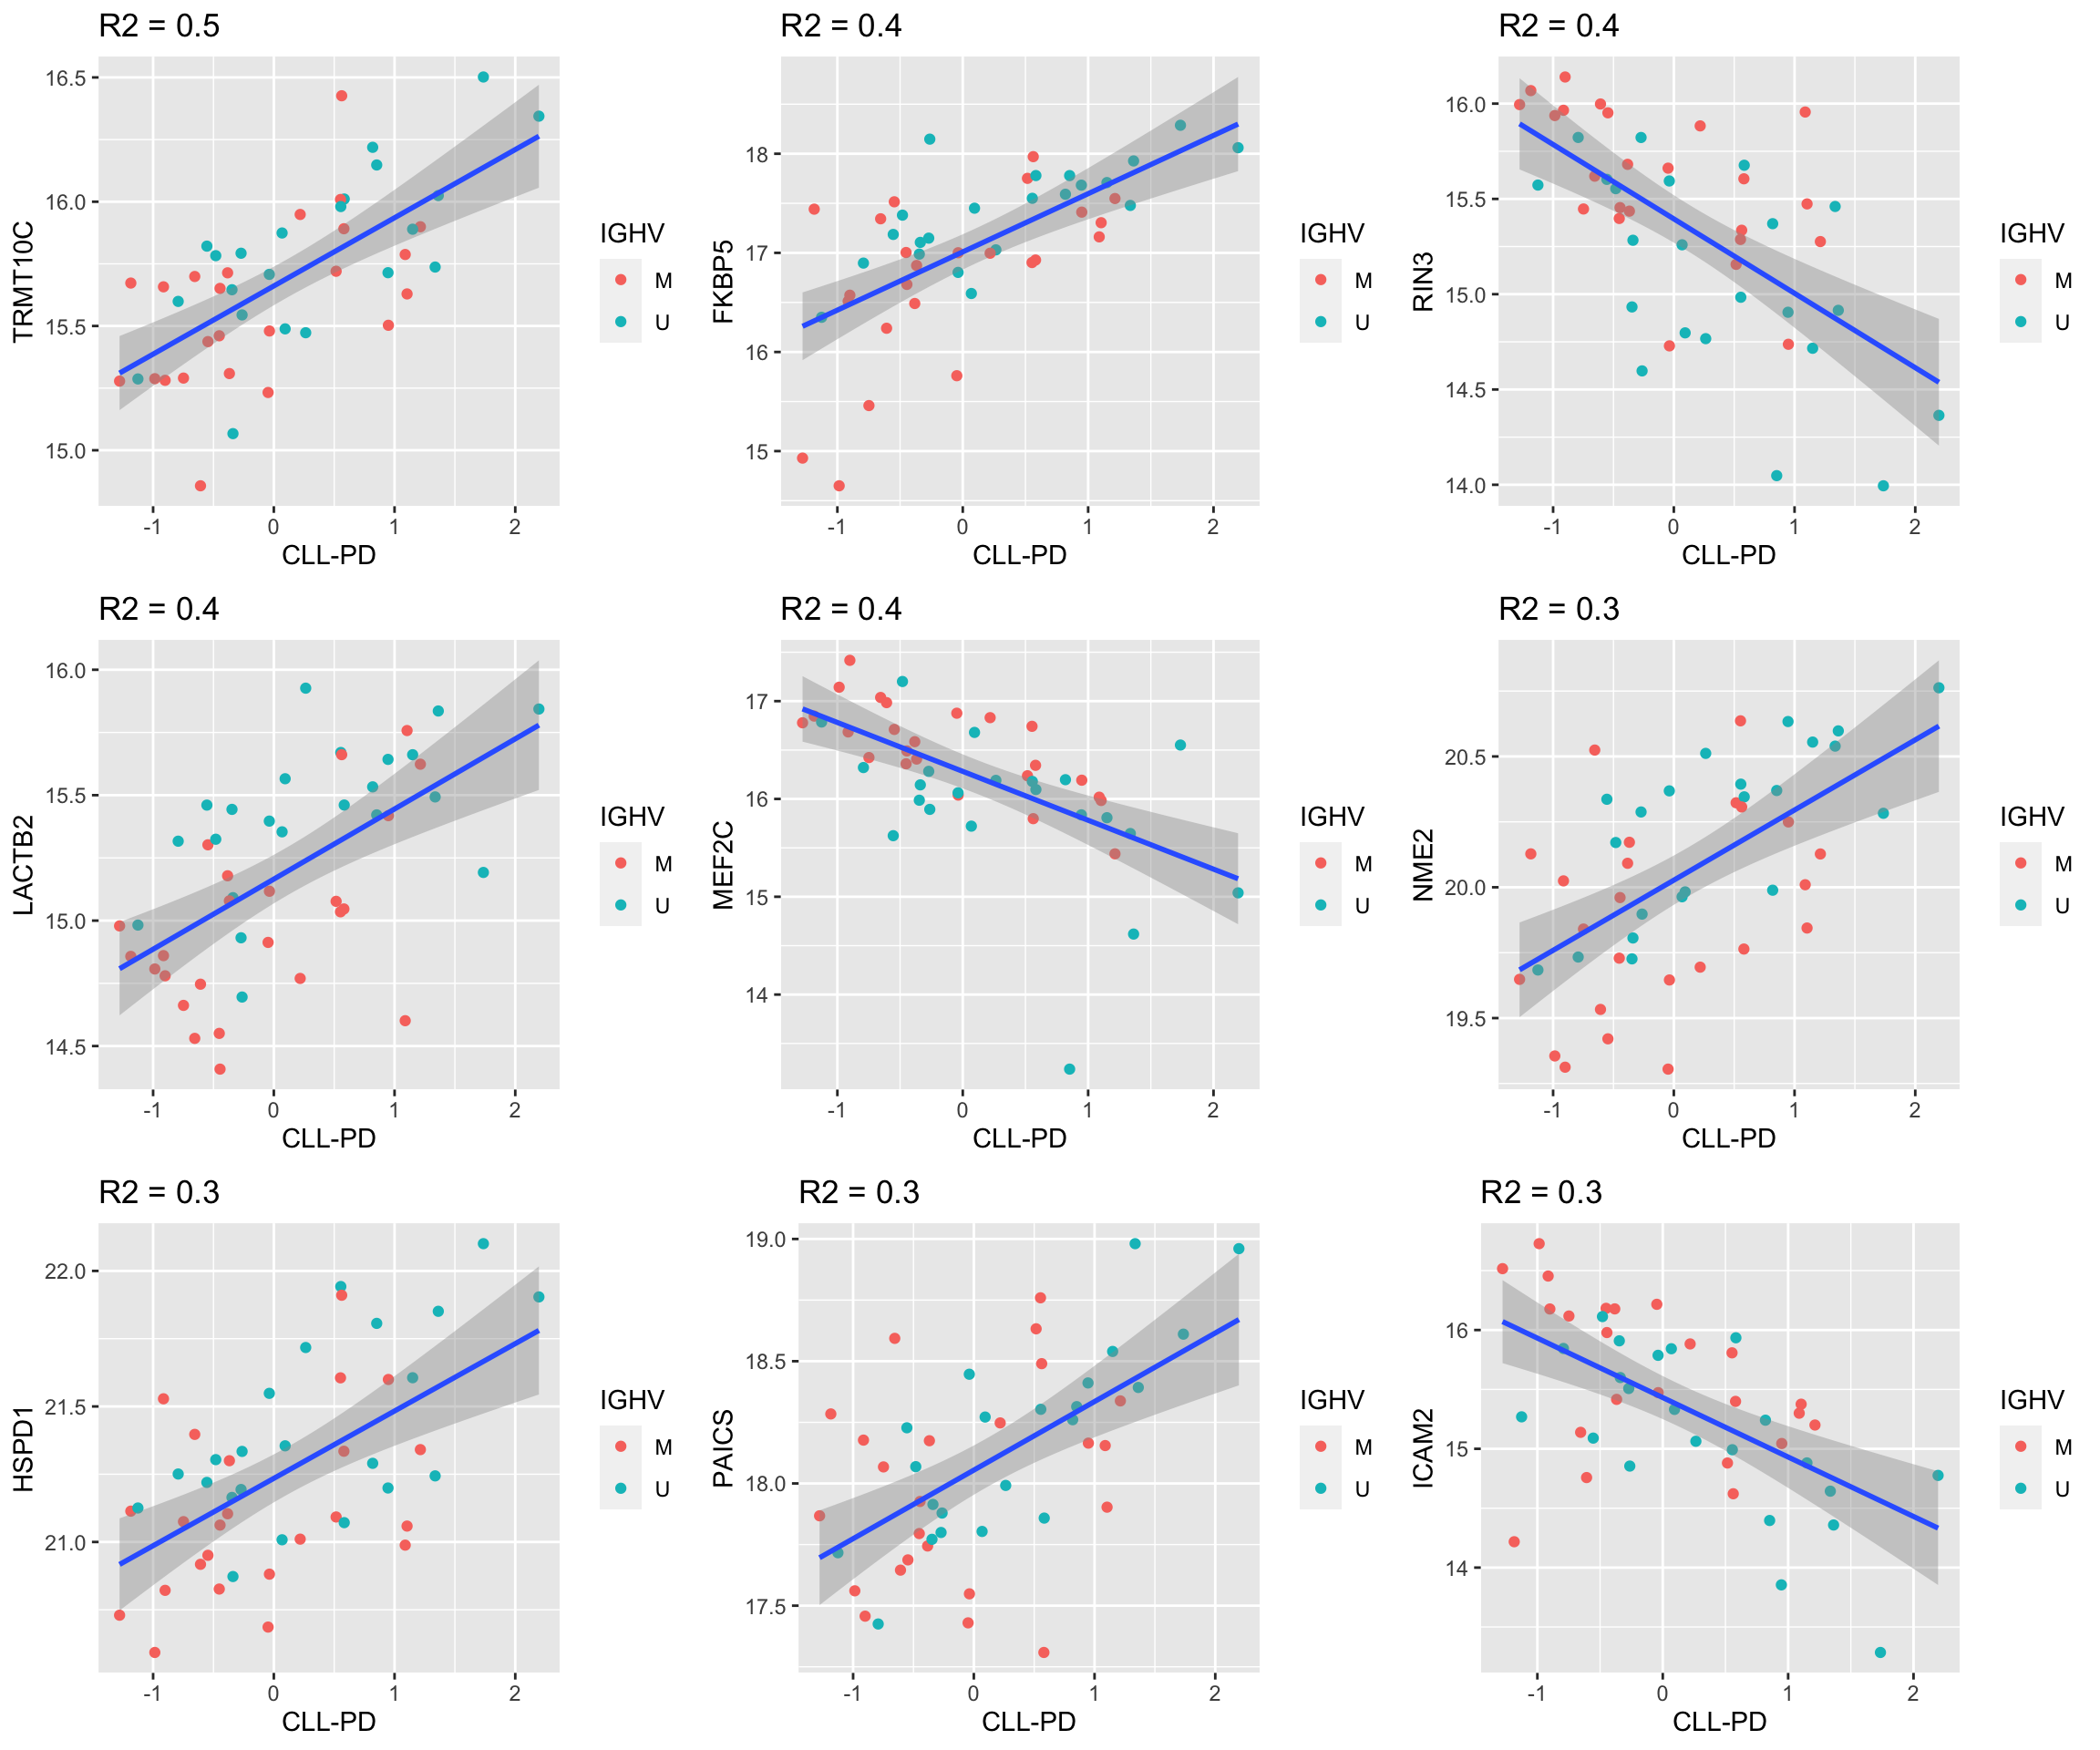
Enrichment analysis
inputTab <- filter(resTab, P.Value < 0.05) %>% select(name, t) %>% arrange(desc(t)) %>%
  filter(!is.na(name)) %>%
  distinct(name,.keep_all = TRUE) %>%
  column_to_rownames("name")

gmts = list(H= "../data/gmts/h.all.v6.2.symbols.gmt",
            KEGG= "../data/gmts/c2.cp.kegg.v6.2.symbols.gmt")
enRes <- list()
enRes[["HALLMARK"]] <- runGSEA(inputTab, gmts$H, "page")
enRes[["KEGG"]] <- runGSEA(inputTab, gmts$KEGG, "page")
p <- plotEnrichmentBar(enRes, pCut =0.05, ifFDR= TRUE)
Coordinate system already present. Adding new coordinate system, which will replace the existing one.
Coordinate system already present. Adding new coordinate system, which will replace the existing one.plot(p)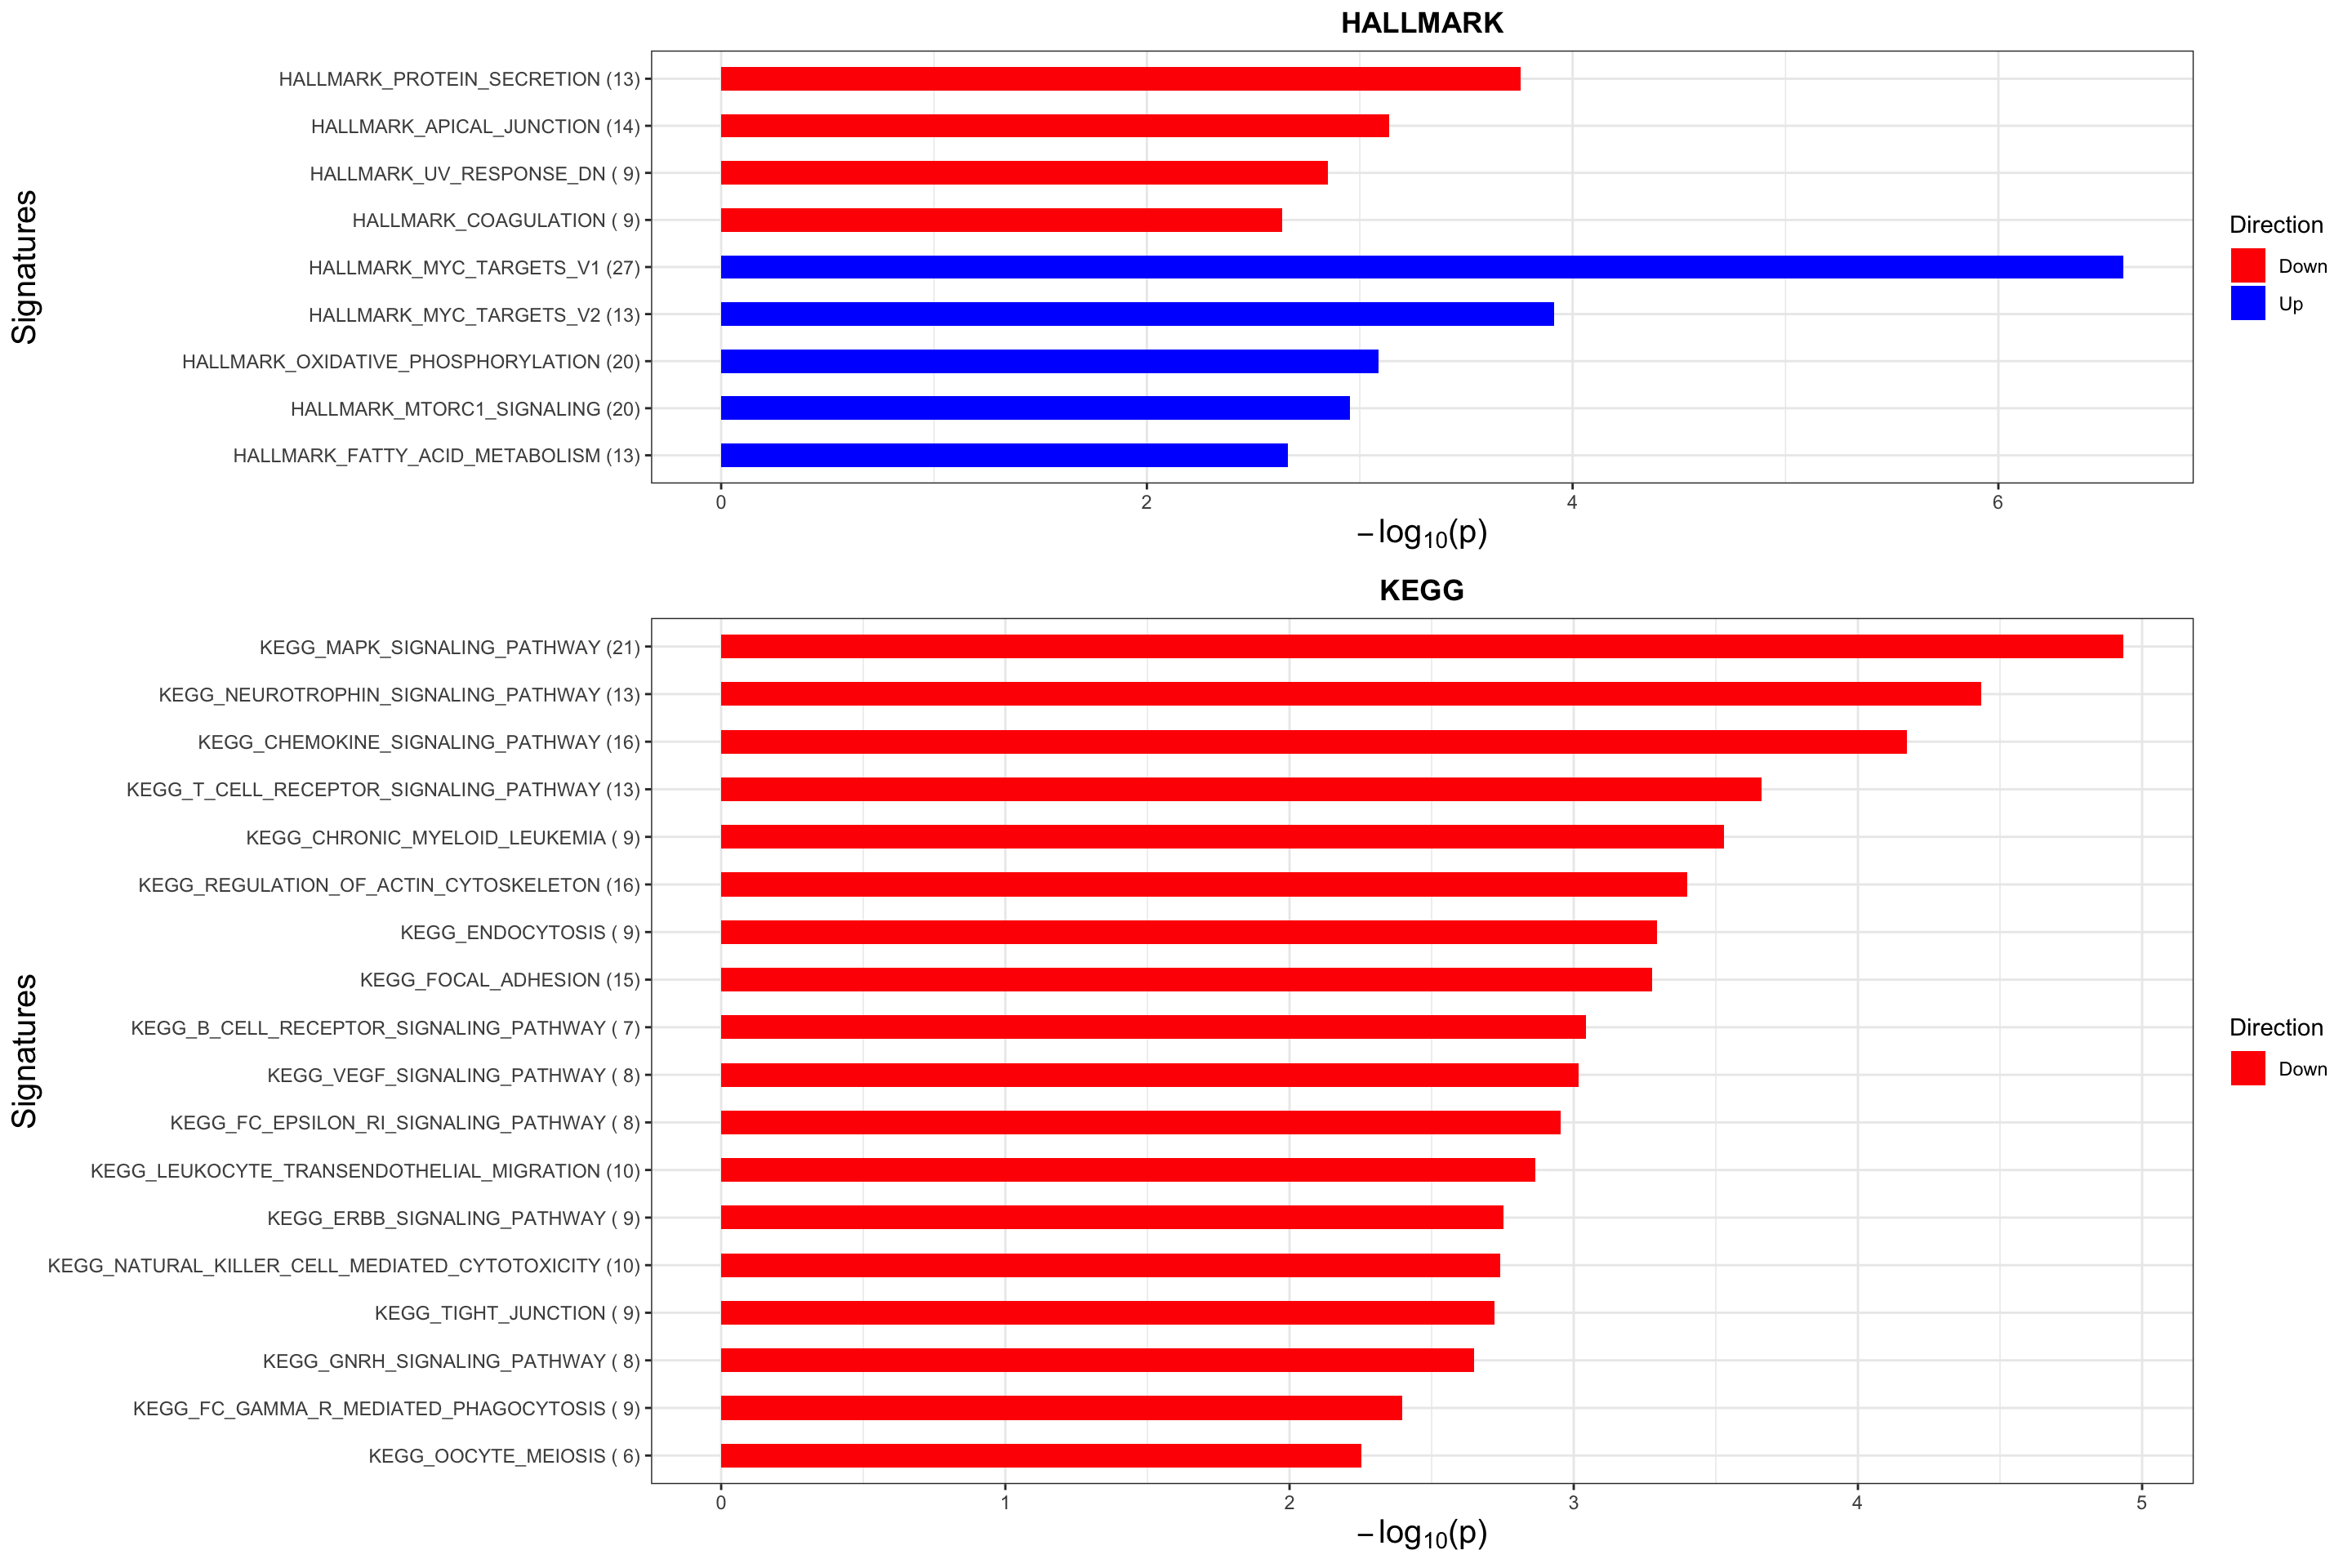
| Version | Author | Date |
|---|---|---|
| b8e0823 | Junyan Lu | 2020-03-10 |
Gene set heatmap
plotSetHeatmap <- function(geneSigTab, setDir, setName, exprMat, colAnno, scale = TRUE) {
  geneList <- loadGSC(setDir)[["gsc"]][[setName]]
  sigGene <- dplyr::filter(geneSigTab, symbol %in% geneList) %>%
    arrange(desc(coef))
  colAnno <- colAnno[order(colAnno[,1]),,drop = FALSE]
  plotMat <- exprMat[sigGene[["id"]],rownames(colAnno)]

  if (scale) {
    #calculate z-score and sensor
    plotMat <- t(scale(t(plotMat)))
    plotMat[plotMat >= 4] <- 4
    plotMat[plotMat <= -4] <- -4
  }

  pheatmap(plotMat, color = colorRampPalette(c("navy","white","firebrick"))(100),
           cluster_cols = FALSE, cluster_rows = FALSE,
           annotation_col = colAnno, labels_row = sigGene$symbol,
           show_colnames = FALSE, fontsize_row = 8, breaks = seq(-5,5, length.out = 101), treeheight_row = 0,
           border_color = NA, main = setName)

}
geneSigTab <- filter(resTab, P.Value <= 0.05) %>% mutate(coef = logFC, symbol = name)
exprMat <- assays(protCLL[,rownames(colAnno)])[["QRILC"]]
plotSetHeatmap(geneSigTab, setDir = gmts$H, setName = "HALLMARK_MYC_TARGETS_V1",exprMat = exprMat,colAnno = colAnno)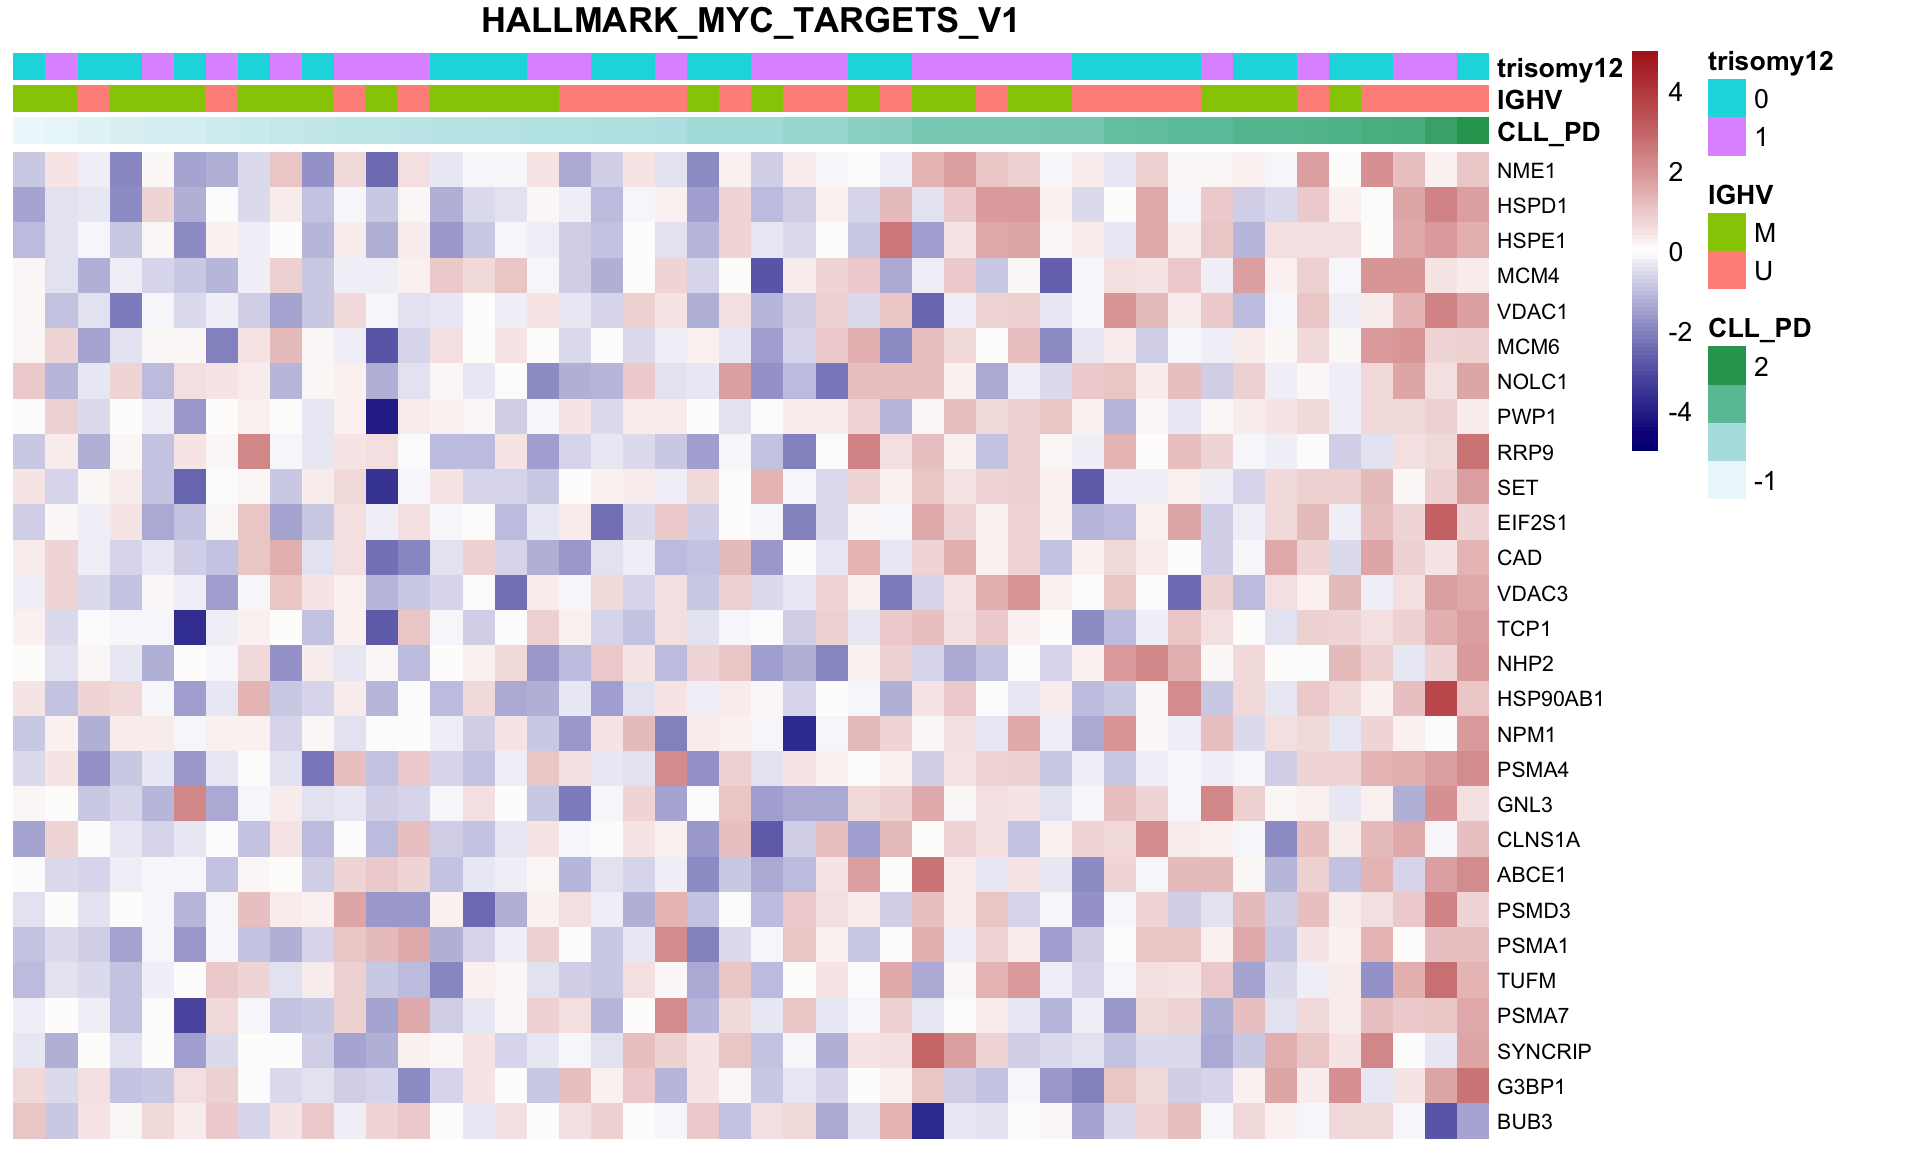
Do those genes also correlate with CLL-PD at RNA expression level?
Only the genes show correlation with CLL-PD at protein level are tested here Process RNAseq data
dds$LF4 <- facTab[match(dds$PatID, facTab$patID),]$factor
ddsSub <- dds[rowSums(counts(dds))>0,!is.na(dds$LF4)]
ddsSub <- ddsSub[rowData(ddsSub)$symbol %in% corRes.sig$name]
Associations test
design(ddsSub) <- ~ LF4
deRes <- results(DESeq(ddsSub),tidy = TRUE) %>%
  mutate(symbol = rowData(ddsSub[row,])$symbol)
using pre-existing size factorsestimating dispersionsgene-wise dispersion estimatesmean-dispersion relationshipfinal dispersion estimatesfitting model and testingSummarise the results
Upset plots
library(UpSetR)
diffList <- list(Protein_UP = filter(corRes.sig, t>0)$name,
                 Protein_DOWN = filter(corRes.sig, t<0)$name,
                 RNA_UP = filter(deRes, log2FoldChange >0, padj < 0.1)$symbol,
                 RNA_DOWN = filter(deRes, log2FoldChange <0, padj<0.1)$symbol)
upset(fromList(diffList))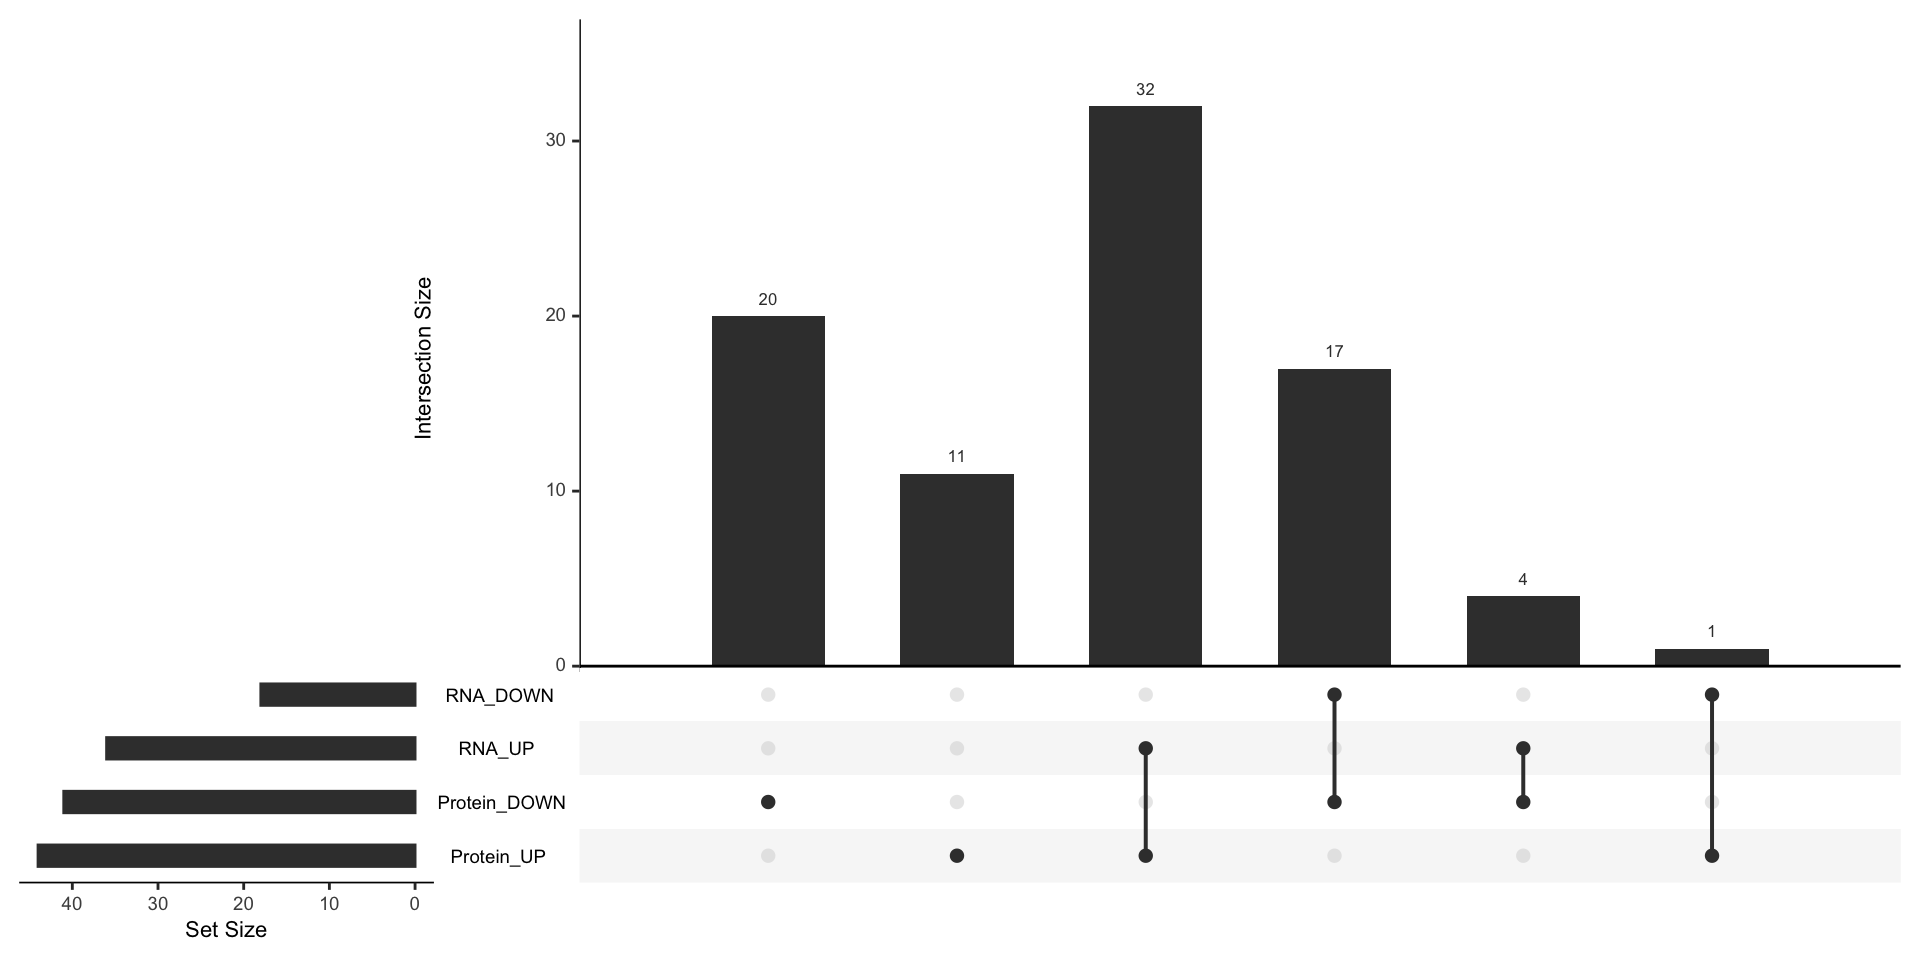
Genes that positively correlated with CLL-PD at both RNA and protein levels
intersect(diffList$Protein_UP, diffList$RNA_UP) [1] "FKBP5" "LACTB2" "NME2" "HSPD1" "PAICS" "ALDH1B1" "FAM136A"
[8] "NME1" "LAP3" "PSMB7" "NSUN4" "RCN1" "PRMT5" "ATIC"
[15] "VDAC1" "MAT2A" "EPS8L2" "PCCB" "NT5C2" "TMLHE" "IRF5"
[22] "MX1" "FASN" "NARS2" "POLDIP2" "ARMCX3" "SLC25A5" "SIRT5"
[29] "PML" "AFG3L2" "FOXRED1" "METTL1" Genes that negatively correlated with CLL-PD at both RNA and protein levels
intersect(diffList$Protein_DOWN, diffList$RNA_DOWN) [1] "RIN3" "MEF2C" "GAK" "VAMP3" "NFATC2" "PHF1" "GRB2"
[8] "PIK3CD" "RPS6KA3" "RRAS2" "FGR" "RABEP1" "FCRL1" "STAT5B"
[15] "AKAP13" "GPX4" "CD247" Genes that positively correlated with CLL-PD only at protein level
setdiff(diffList$Protein_UP, diffList$RNA_UP) [1] "TRMT10C" "HSPE1" "LARP7" "MTX1" "PSMB6" "PMPCA"
[7] "CCDC51" "TRAP1" "SLC25A22" "COX17" "GTF2I" "DTYMK" Genes that negative correlated with CLL-PD only at protein level
setdiff(diffList$Protein_DOWN, diffList$RNA_DOWN) [1] "ICAM2" "TPD52L2" "KYAT1" "PURA" "LTA4H" "RAB31" "RAB22A"
[8] "ATP6V1A" "NAPA" "DOCK11" "FMNL1" "ELMO2" "SEPTIN6" "BLOC1S1"
[15] "ADAM10" "ICAM3" "CBX1" "SMC6" "LMNB2" "KXD1" "CRKL"
[22] "DCTN2" "TMEM109" "CLTB" Detect proteins correlated with CLL-PD (Blocking for IGHV)
Correlate protein expression with CLL-PD using proDA, with IGHV as covariate
Fit the probailistic dropout model
LF4 <- protCLL$LF4
ighv <- protCLL$IGHV.status
fit <- proDA(protMat, design = ~ LF4 + ighv)
Test for differentially expressed proteins
resTab <- test_diff(fit, "LF4") %>%
  dplyr::rename(id = name, logFC = diff, t=t_statistic,
                P.Value = pval, adj.P.Val = adj_pval) %>%
  mutate(name = rowData(protCLL[id,])$hgnc_symbol) %>%
  select(name, id, logFC, t, P.Value, adj.P.Val, n_obs) %>%
  arrange(P.Value) %>%
  as_tibble()
P-value histogram
ggplot(resTab, aes(x=P.Value)) + geom_histogram(fill = "lightblue",col="grey50") + xlim(0,1)`stat_bin()` using `bins = 30`. Pick better value with `binwidth`.Warning: Removed 2 rows containing missing values (geom_bar).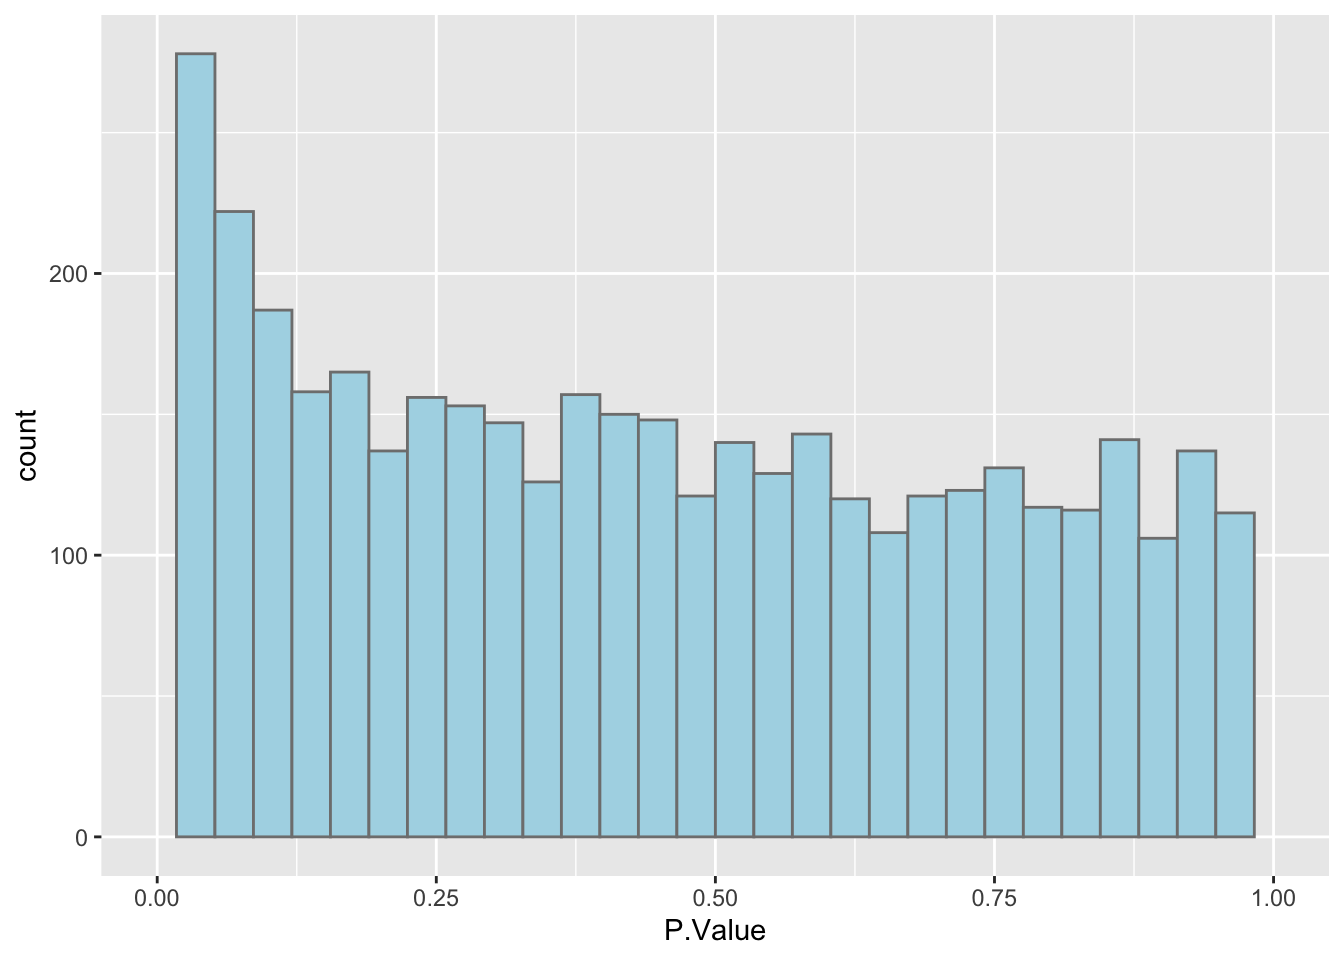 Detection rate is reduced
Heatmap of significantly associated proteins (10% FDR)
colAnno <- tibble(patID = colnames(protMat),
CLL_PD = protCLL$LF4,
IGHV = protCLL$IGHV.status,
trisomy12 = protCLL$trisomy12) %>%
arrange(CLL_PD) %>% data.frame() %>% column_to_rownames("patID")
plotMat <- assays(protCLL[corRes.sig$id,rownames(colAnno)])[["QRILC"]]
plotMat <- jyluMisc::mscale(plotMat, censor = 6)
pheatmap(plotMat, scale = "none", annotation_col = colAnno, clustering_method = "ward.D2",
cluster_cols = FALSE,
labels_row = corRes.sig$name,
color = colorRampPalette(c("navy","white","firebrick"))(100),
breaks = seq(-6,6, length.out = 101))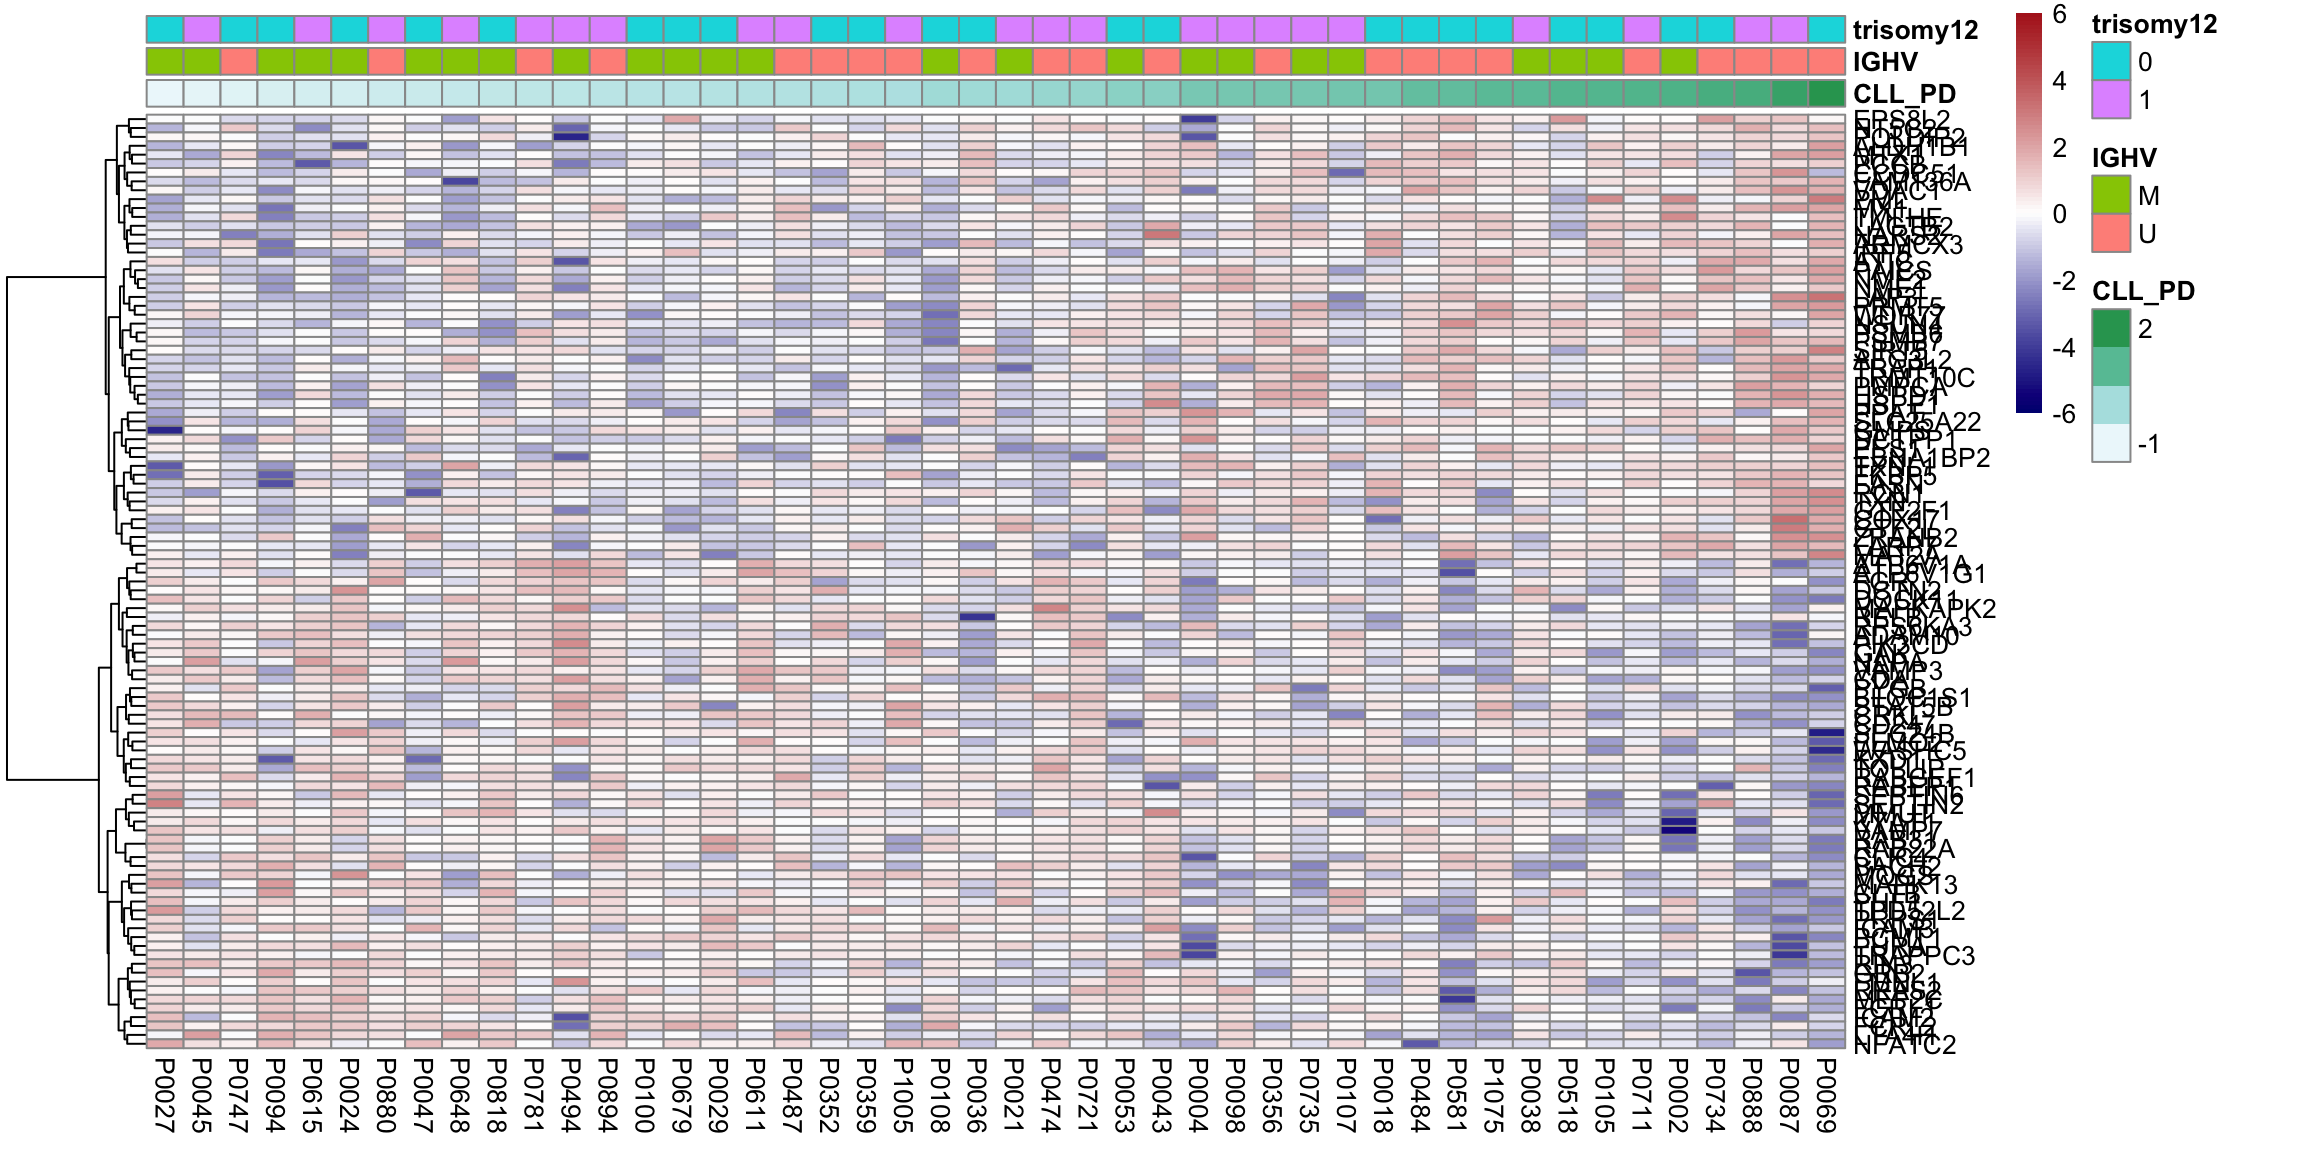 IGHV could be a potential confounder here. As the top six proteomics samples with highest CLL-PD are U-CLLs
Enrichment analysis
inputTab <- filter(resTab, P.Value < 0.05) %>% select(name, t) %>% arrange(desc(t)) %>%
  filter(!is.na(name)) %>%
  distinct(name,.keep_all = TRUE) %>%
  column_to_rownames("name")

gmts = list(H= "../data/gmts/h.all.v6.2.symbols.gmt",
            KEGG= "../data/gmts/c2.cp.kegg.v6.2.symbols.gmt")
enRes <- list()
enRes[["HALLMARK"]] <- runGSEA(inputTab, gmts$H, "page")
enRes[["KEGG"]] <- runGSEA(inputTab, gmts$KEGG, "page")
p <- plotEnrichmentBar(enRes, pCut =0.1, ifFDR= TRUE)
Coordinate system already present. Adding new coordinate system, which will replace the existing one.
Coordinate system already present. Adding new coordinate system, which will replace the existing one.plot(p)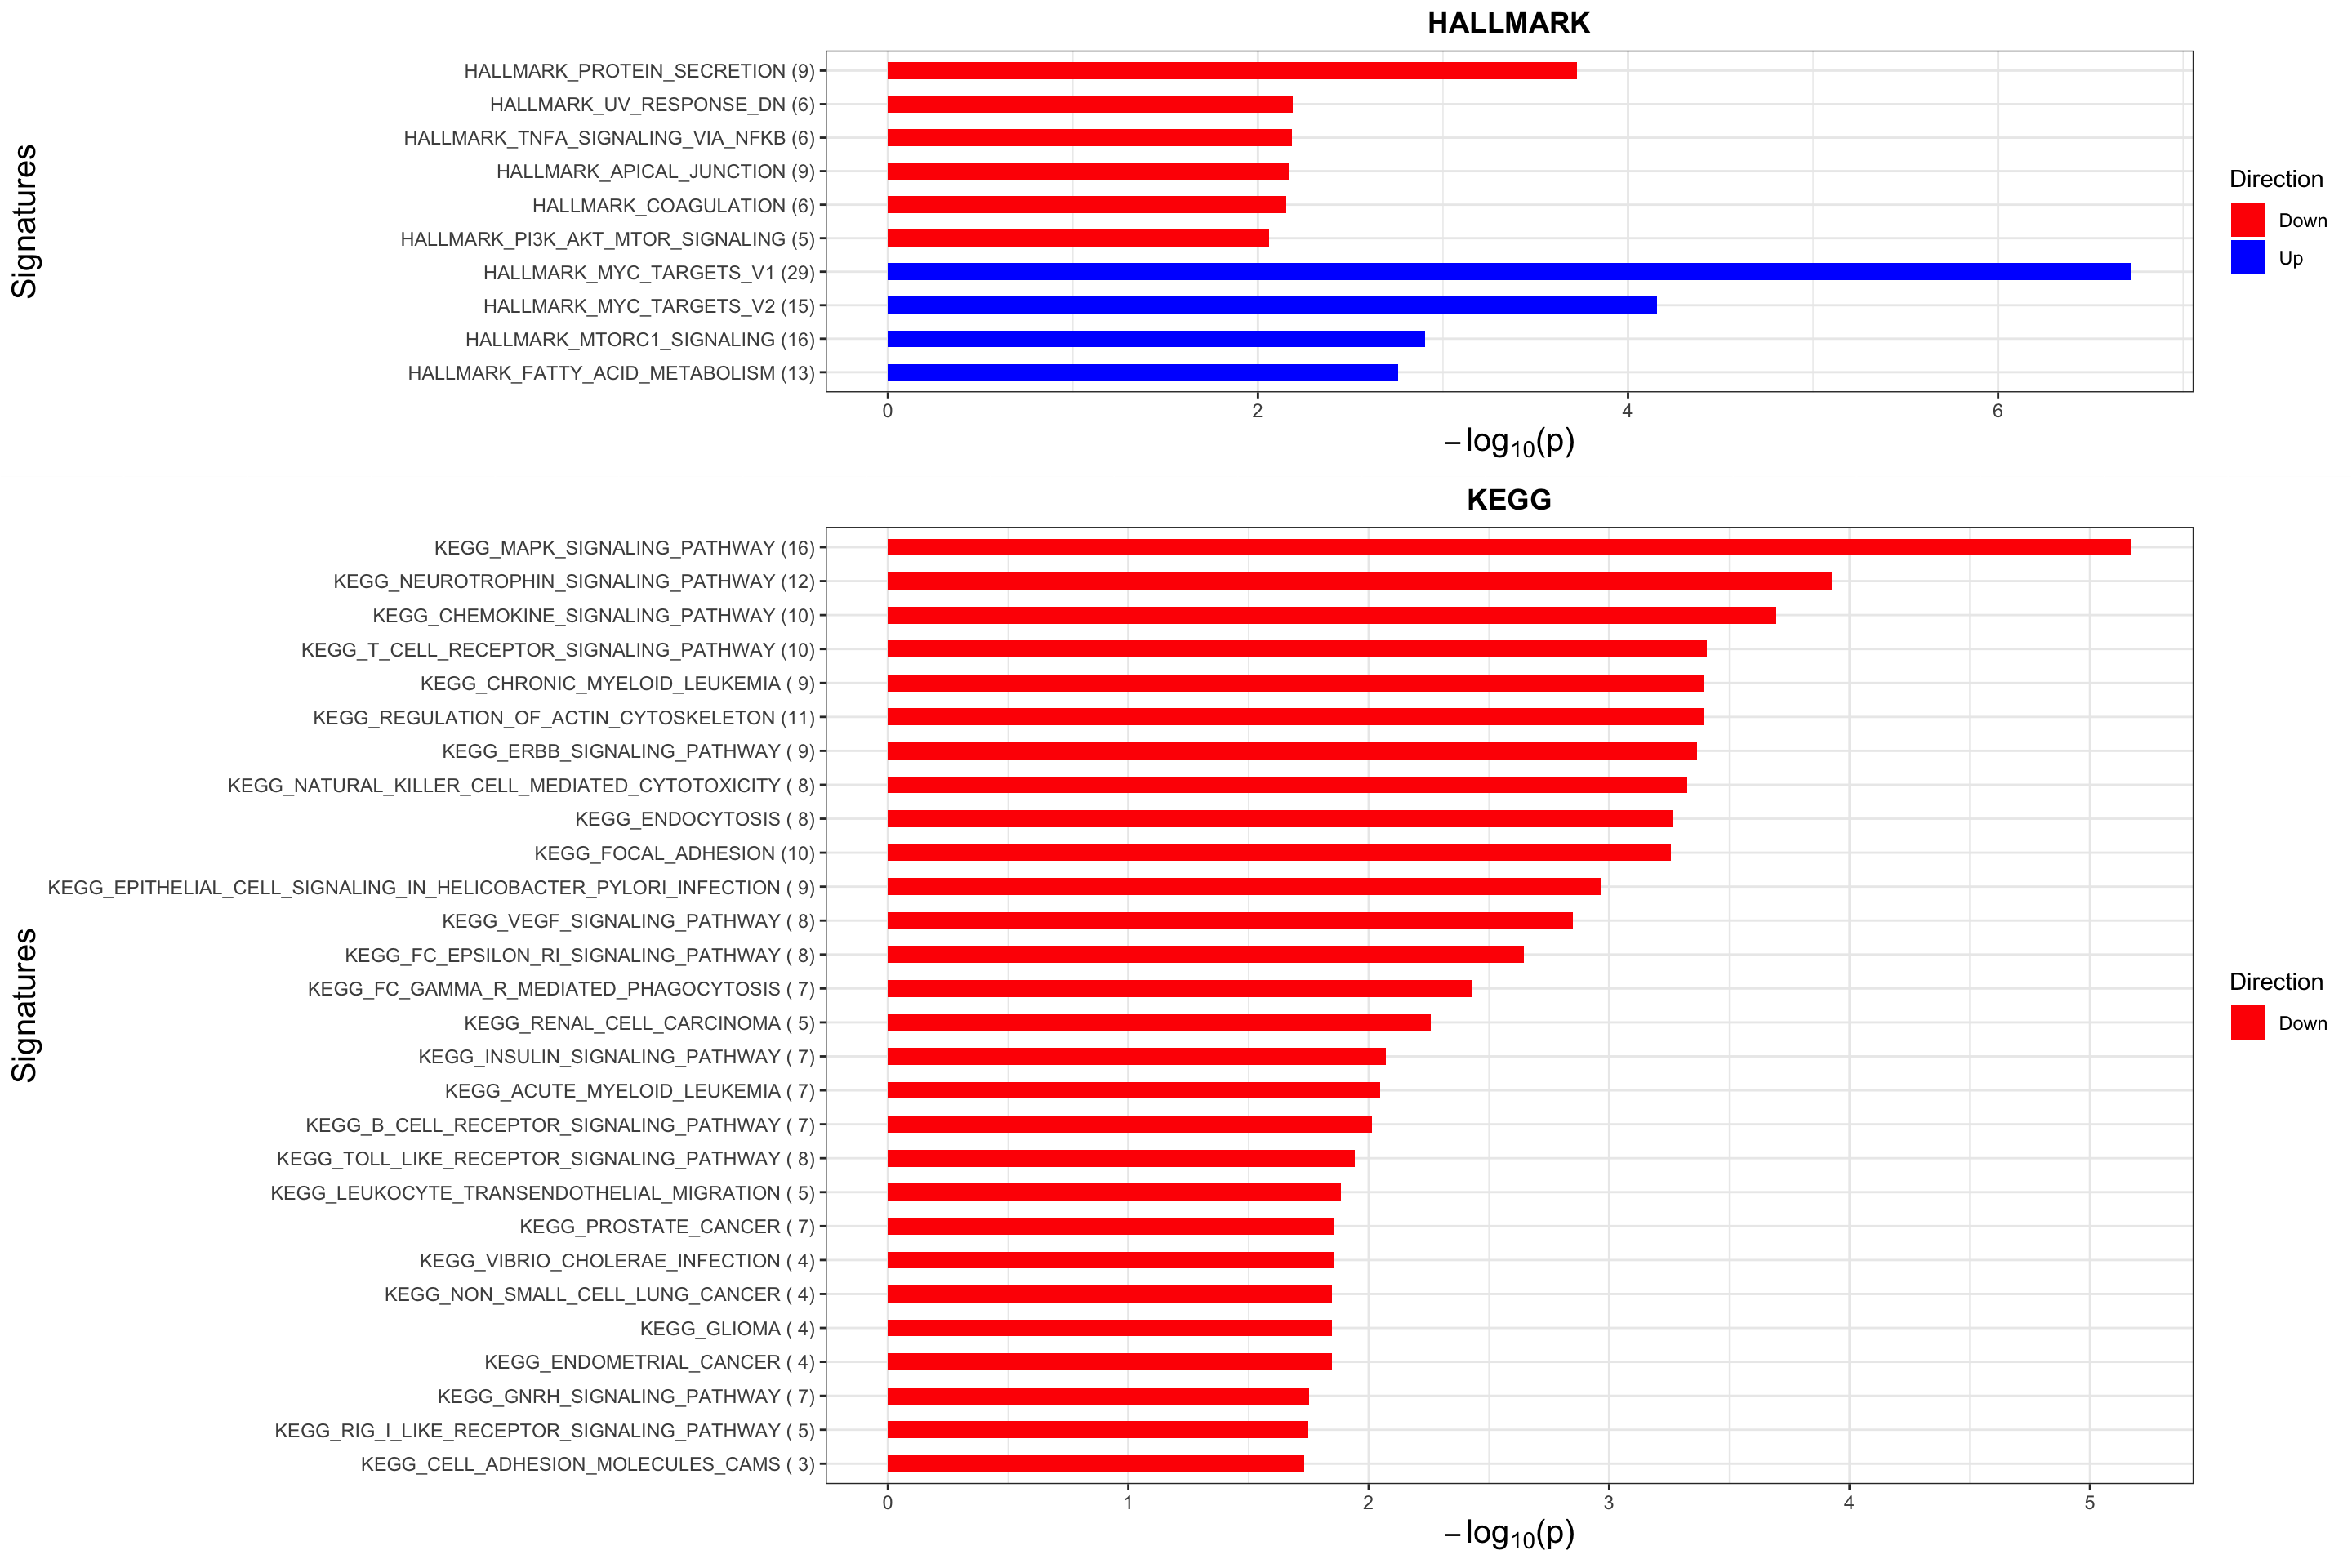
Do those genes also correlate with CLL-PD at RNA expression level?
Only the genes show correlation with CLL-PD at protein level are tested here Process RNAseq data
dds$LF4 <- facTab[match(dds$PatID, facTab$patID),]$factor
ddsSub <- dds[rowSums(counts(dds))>0,!is.na(dds$LF4)]
ddsSub <- ddsSub[rowData(ddsSub)$symbol %in% corRes.sig$name]
Associations test
design(ddsSub) <- ~ LF4
deRes <- results(DESeq(ddsSub),tidy = TRUE) %>%
  mutate(symbol = rowData(ddsSub[row,])$symbol)
using pre-existing size factorsestimating dispersionsgene-wise dispersion estimatesmean-dispersion relationshipfinal dispersion estimatesfitting model and testingSummarise the results
Upset plots
library(UpSetR)
diffList <- list(Protein_UP = filter(corRes.sig, t>0)$name,
                 Protein_DOWN = filter(corRes.sig, t<0)$name,
                 RNA_UP = filter(deRes, log2FoldChange >0, padj < 0.1)$symbol,
                 RNA_DOWN = filter(deRes, log2FoldChange <0, padj<0.1)$symbol)
upset(fromList(diffList))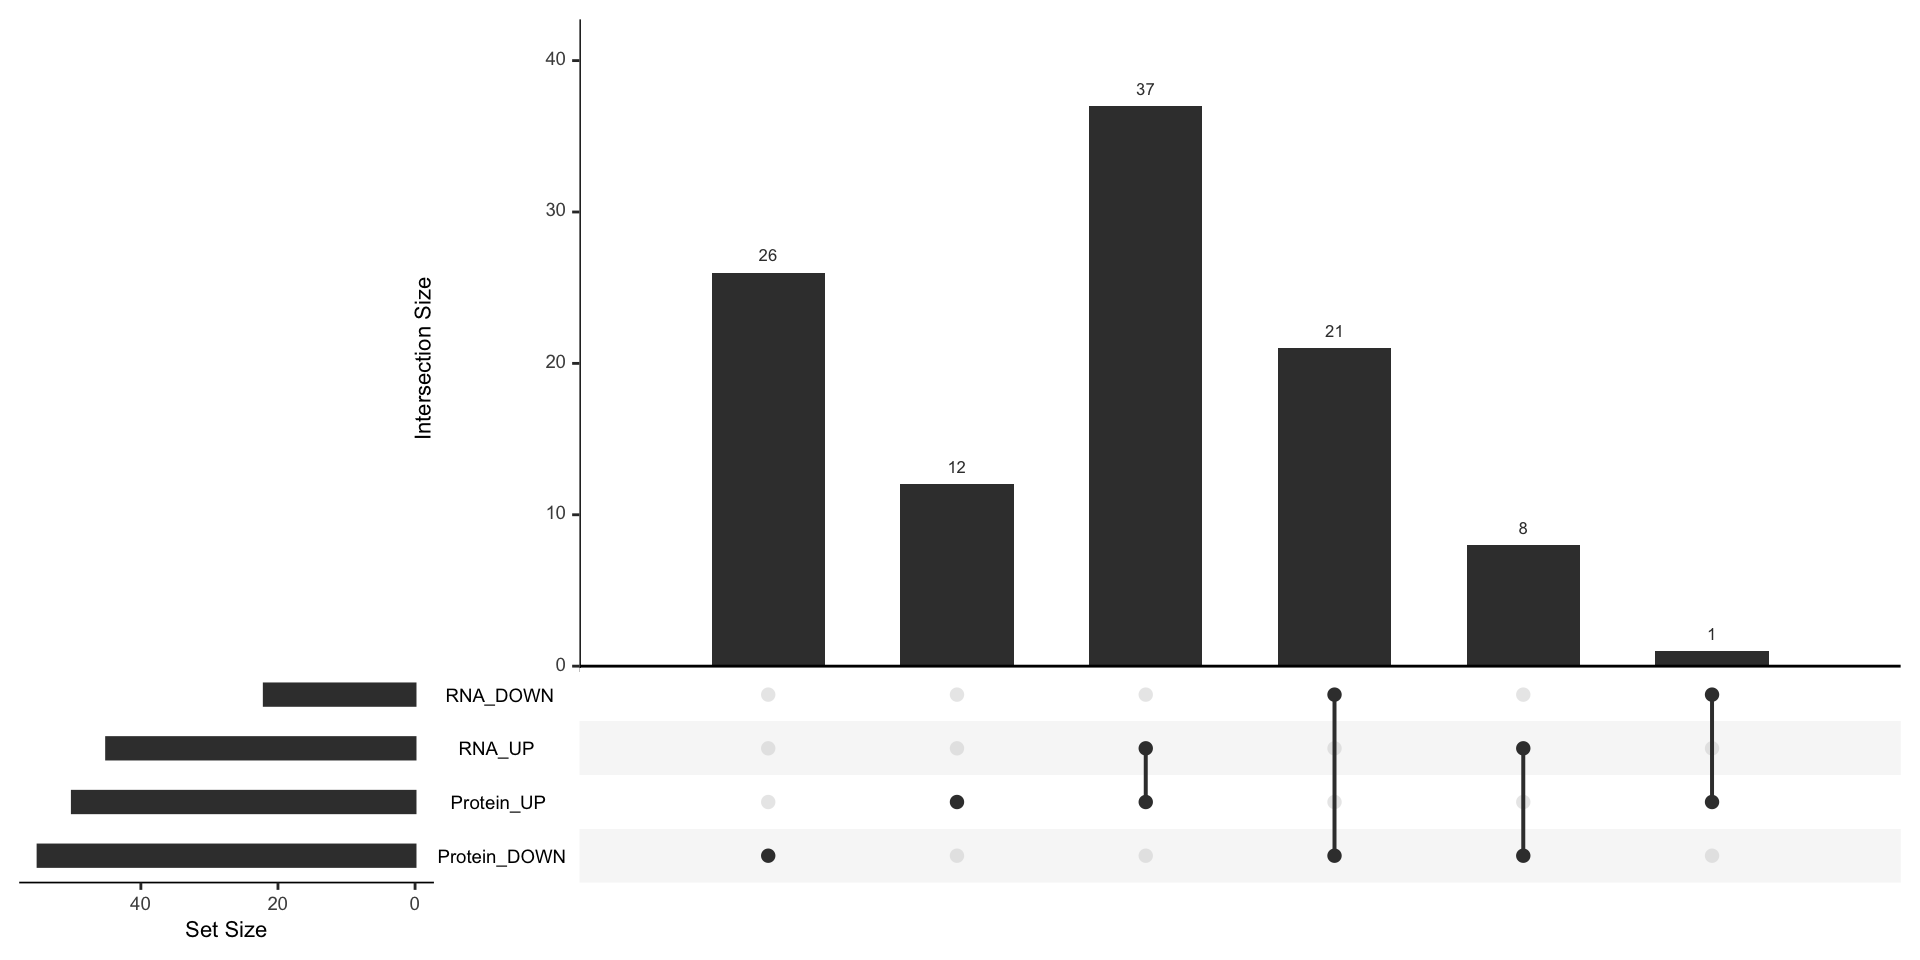
Genes that positively correlated with CLL-PD at both RNA and protein levels
intersect(diffList$Protein_UP, diffList$RNA_UP) [1] "FKBP5" "PAICS" "LACTB2" "NME2" "HSPD1" "FAM136A"
[7] "ALDH1B1" "PRMT5" "RCN1" "NME1" "NSUN4" "PSMB7"
[13] "LAP3" "ATIC" "MAT2A" "FASN" "EPS8L2" "ARMCX3"
[19] "DCTPP1" "TXN" "PCCB" "MX1" "VDAC1" "NARS2"
[25] "TXNL1" "SIRT5" "TMLHE" "ZRANB2" "PPAT" "IRF5"
[31] "NT5C2" "WDR77" "POLDIP2" "AFG3L2" "PML" "EBNA1BP2"
[37] "GMPS" Genes that negatively correlated with CLL-PD at both RNA and protein levels
intersect(diffList$Protein_DOWN, diffList$RNA_DOWN) [1] "RIN3" "MEF2C" "GAK" "STAT5B" "VAMP3" "FGR" "NFATC2"
[8] "PHF1" "PIK3CD" "CLIC4" "RABEP1" "GRB2" "FCRL2" "RPS6KA3"
[15] "CD247" "MAPK13" "FCRL1" "SEC24B" "RRAS2" "BACH2" "RELB" Genes that positively correlated with CLL-PD only at protein level
setdiff(diffList$Protein_UP, diffList$RNA_UP) [1] "TRMT10C" "LARP7" "HSPE1" "MTX1" "SLC25A22" "PSMB6"
[7] "CCDC51" "PMPCA" "TRAP1" "COX17" "PES1" "GTF2I"
[13] "GTF2F1" Genes that negative correlated with CLL-PD only at protein level
setdiff(diffList$Protein_DOWN, diffList$RNA_DOWN) [1] "RAB31" "RAB22A" "ICAM2" "BLOC1S1" "PURA" "TPD52L2"
[7] "ATP6V1A" "LTA4H" "KYAT1" "SEPTIN6" "SEPTIN2" "ELMO2"
[13] "PYGB" "DCTN2" "CRKL" "NAPA" "KXD1" "RABGEF1"
[19] "DOCK11" "WASHC5" "VAMP7" "ICAM3" "TRAPPC3" "MMUT"
[25] "CDA" "ATP6V1G1" "FMNL1" "MAPKAPK2" "MOGS" "PCMT1"
[31] "ADAM10" "TOLLIP" "CLTB" "PRPS1"
sessionInfo()R version 4.0.2 (2020-06-22)
Platform: x86_64-apple-darwin17.0 (64-bit)
Running under: macOS Catalina 10.15.6
Matrix products: default
BLAS: /Library/Frameworks/R.framework/Versions/4.0/Resources/lib/libRblas.dylib
LAPACK: /Library/Frameworks/R.framework/Versions/4.0/Resources/lib/libRlapack.dylib
locale:
[1] en_US.UTF-8/en_US.UTF-8/en_US.UTF-8/C/en_US.UTF-8/en_US.UTF-8
attached base packages:
[1] parallel stats4 stats graphics grDevices utils datasets
[8] methods base
other attached packages:
[1] UpSetR_1.4.0 forcats_0.5.0
[3] stringr_1.4.0 dplyr_1.0.0
[5] purrr_0.3.4 readr_1.3.1
[7] tidyr_1.1.0 tibble_3.0.2
[9] ggplot2_3.3.2 tidyverse_1.3.0
[11] jyluMisc_0.1.5 pheatmap_1.0.12
[13] DESeq2_1.28.1 SummarizedExperiment_1.18.1
[15] DelayedArray_0.14.0 matrixStats_0.56.0
[17] Biobase_2.48.0 GenomicRanges_1.40.0
[19] GenomeInfoDb_1.24.2 IRanges_2.22.2
[21] S4Vectors_0.26.1 BiocGenerics_0.34.0
[23] piano_2.4.0 proDA_1.2.0
[25] cowplot_1.0.0
loaded via a namespace (and not attached):
[1] readxl_1.3.1 backports_1.1.8 fastmatch_1.1-0
[4] drc_3.0-1 workflowr_1.6.2 plyr_1.8.6
[7] igraph_1.2.5 shinydashboard_0.7.1 splines_4.0.2
[10] crosstalk_1.1.0.1 BiocParallel_1.22.0 TH.data_1.0-10
[13] digest_0.6.25 htmltools_0.5.0 fansi_0.4.1
[16] gdata_2.18.0 magrittr_1.5 memoise_1.1.0
[19] cluster_2.1.0 openxlsx_4.1.5 limma_3.44.3
[22] annotate_1.66.0 modelr_0.1.8 sandwich_2.5-1
[25] colorspace_1.4-1 rvest_0.3.5 blob_1.2.1
[28] haven_2.3.1 xfun_0.15 crayon_1.3.4
[31] RCurl_1.98-1.2 jsonlite_1.7.0 genefilter_1.70.0
[34] survival_3.2-3 zoo_1.8-8 glue_1.4.1
[37] survminer_0.4.7 gtable_0.3.0 zlibbioc_1.34.0
[40] XVector_0.28.0 car_3.0-8 abind_1.4-5
[43] scales_1.1.1 mvtnorm_1.1-1 DBI_1.1.0
[46] relations_0.6-9 rstatix_0.6.0 Rcpp_1.0.5
[49] plotrix_3.7-8 xtable_1.8-4 foreign_0.8-80
[52] bit_1.1-15.2 km.ci_0.5-2 DT_0.14
[55] httr_1.4.1 htmlwidgets_1.5.1 fgsea_1.14.0
[58] gplots_3.0.4 RColorBrewer_1.1-2 ellipsis_0.3.1
[61] farver_2.0.3 pkgconfig_2.0.3 XML_3.99-0.4
[64] dbplyr_1.4.4 locfit_1.5-9.4 labeling_0.3
[67] tidyselect_1.1.0 rlang_0.4.6 later_1.1.0.1
[70] AnnotationDbi_1.50.1 munsell_0.5.0 cellranger_1.1.0
[73] tools_4.0.2 visNetwork_2.0.9 cli_2.0.2
[76] generics_0.0.2 RSQLite_2.2.0 broom_0.5.6
[79] evaluate_0.14 fastmap_1.0.1 yaml_2.2.1
[82] knitr_1.29 bit64_0.9-7 fs_1.4.2
[85] zip_2.0.4 survMisc_0.5.5 caTools_1.18.0
[88] nlme_3.1-148 whisker_0.4 mime_0.9
[91] slam_0.1-47 xml2_1.3.2 compiler_4.0.2
[94] rstudioapi_0.11 curl_4.3 ggsignif_0.6.0
[97] marray_1.66.0 reprex_0.3.0 geneplotter_1.66.0
[100] stringi_1.4.6 lattice_0.20-41 Matrix_1.2-18
[103] KMsurv_0.1-5 shinyjs_1.1 vctrs_0.3.1
[106] pillar_1.4.4 lifecycle_0.2.0 data.table_1.12.8
[109] bitops_1.0-6 httpuv_1.5.4 R6_2.4.1
[112] promises_1.1.1 KernSmooth_2.23-17 gridExtra_2.3
[115] rio_0.5.16 codetools_0.2-16 assertthat_0.2.1
[118] MASS_7.3-51.6 gtools_3.8.2 exactRankTests_0.8-31
[121] rprojroot_1.3-2 withr_2.2.0 multcomp_1.4-13
[124] GenomeInfoDbData_1.2.3 mgcv_1.8-31 hms_0.5.3
[127] grid_4.0.2 rmarkdown_2.3 carData_3.0-4
[130] git2r_0.27.1 maxstat_0.7-25 ggpubr_0.4.0
[133] sets_1.0-18 lubridate_1.7.9 shiny_1.5.0