Overview of differentially expressed proteins
A table of associations with 10% FDR
resList <- filter(resList, Gene == "IGHV.status") %>%
  mutate(adj.P.Val = adj.P.IHW) %>% #use IHW corrected P-value
  mutate(Chr = rowData(protCLL[id,])$chromosome_name)
resList %>% filter(adj.P.Val <= 0.1) %>%
  select(name, Chr,logFC, P.Value, adj.P.Val) %>%
  mutate_if(is.numeric, formatC, digits=2) %>%
  DT::datatable()
Number of differentially expressed proteins
sumTab <- filter(resList, adj.P.Val < 0.1) %>%
  mutate(dir = ifelse(t>0, "up","down"))
table(sumTab$dir)
down   up
 280  232
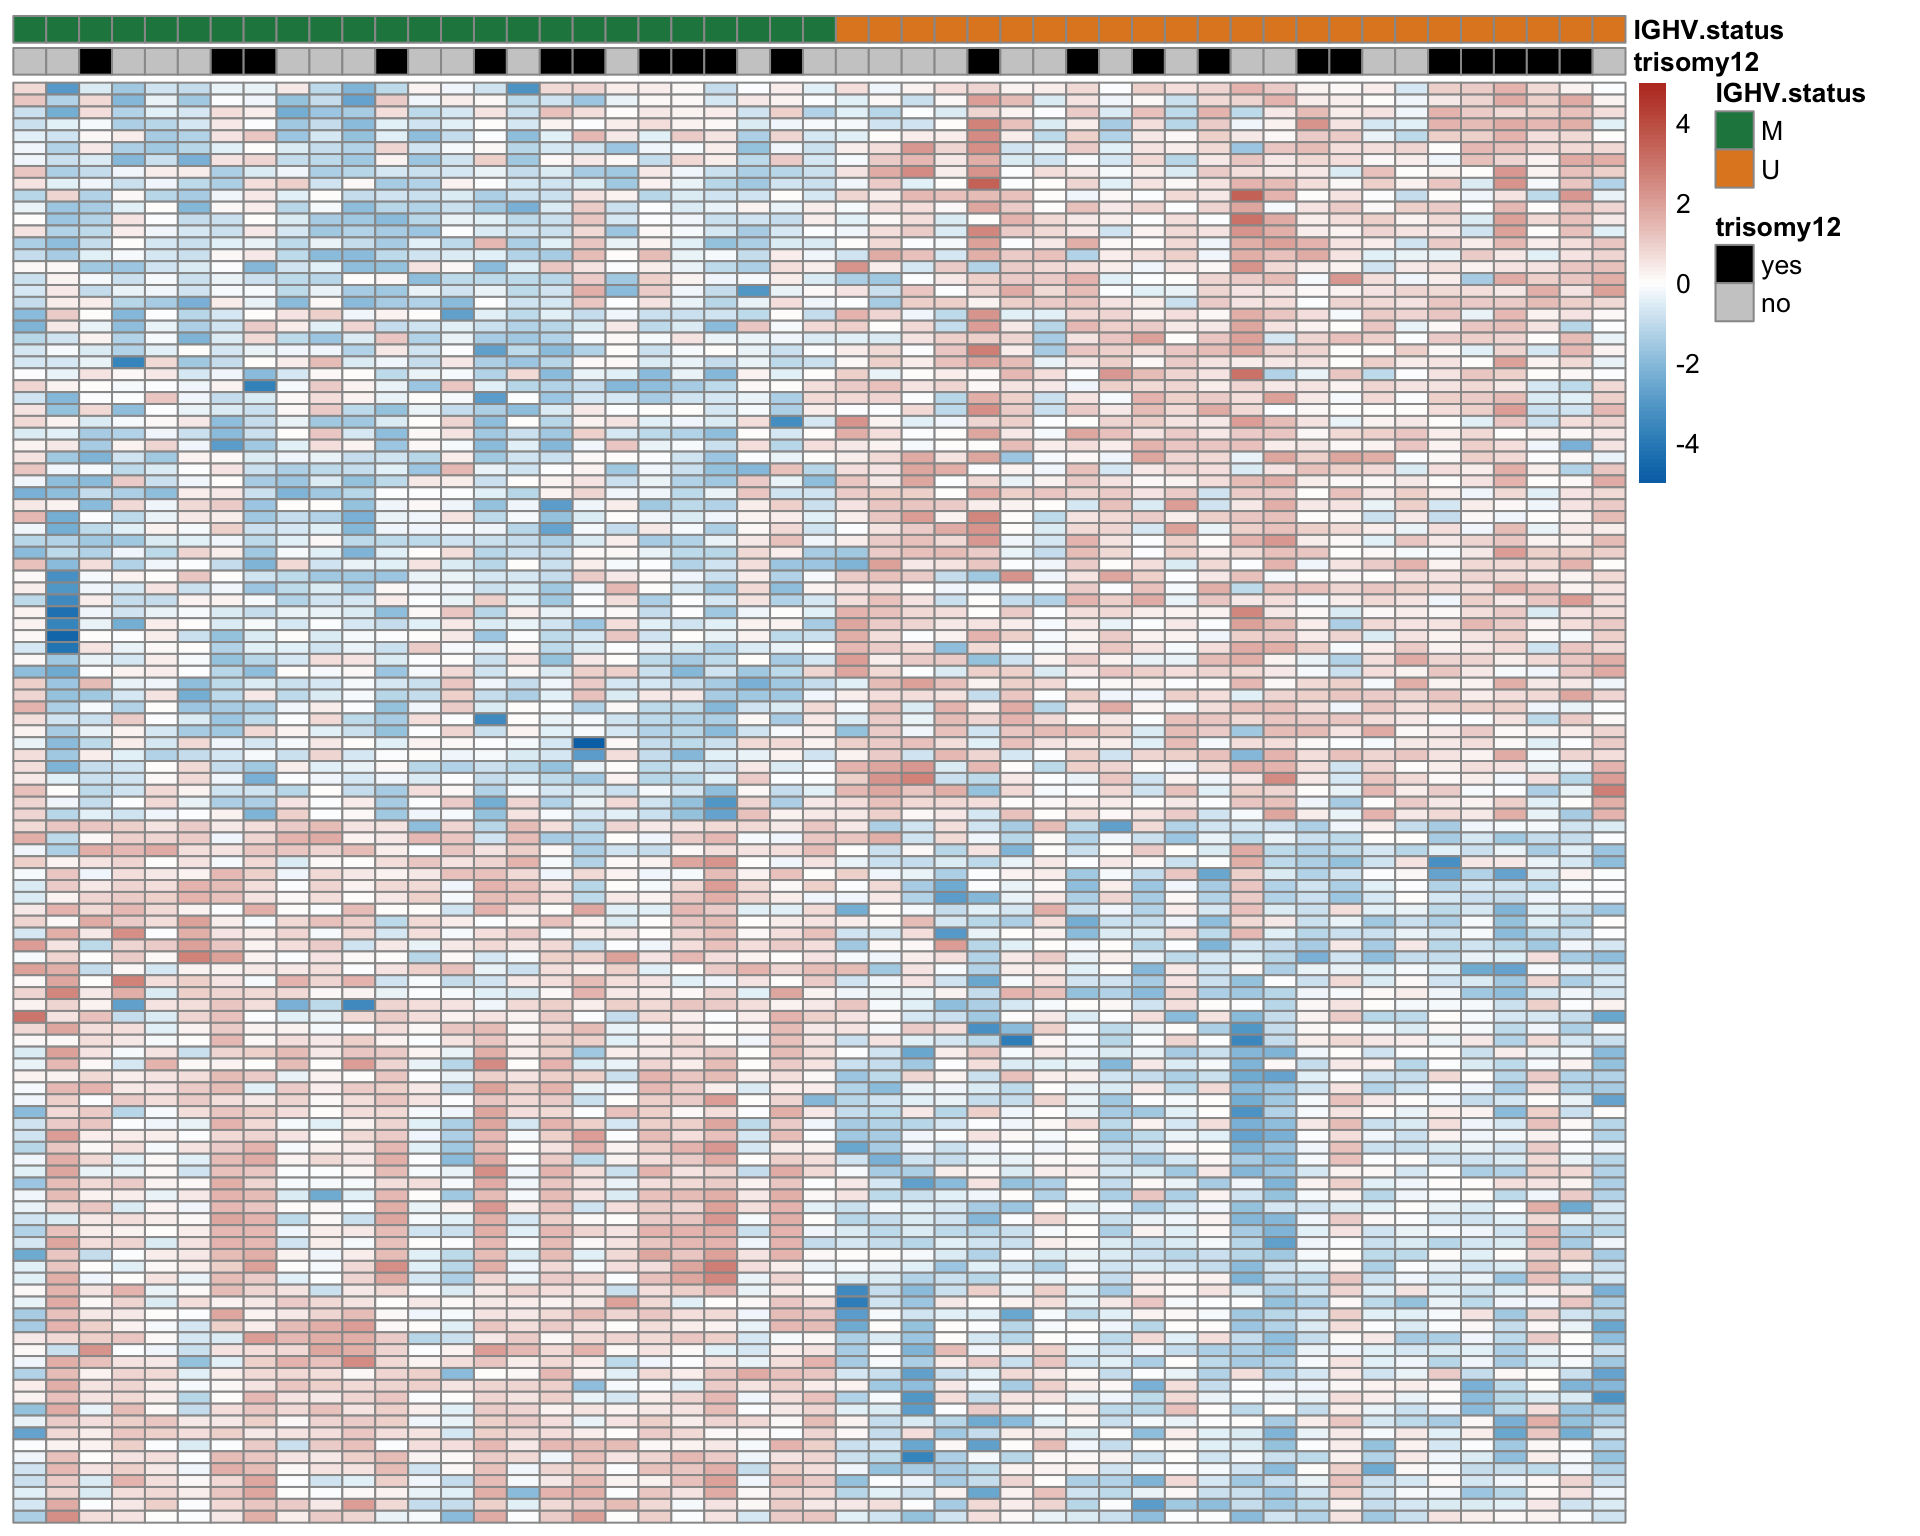
Heatmap of differentially expressed proteins (1% FDR)
proList <- filter(resList, !is.na(name), adj.P.Val < 0.01) %>% distinct(name, .keep_all = TRUE) %>% pull(id)
plotMat <- assays(protCLL)[["QRILC"]][proList,]
rownames(plotMat) <- rowData(protCLL[proList,])$hgnc_symbol

colAnno <- filter(patMeta, Patient.ID %in% colnames(protCLL)) %>%
  select(Patient.ID, trisomy12, IGHV.status) %>%
  arrange(IGHV.status) %>%
  data.frame() %>% column_to_rownames("Patient.ID")
colAnno$trisomy12 <- ifelse(colAnno$trisomy12 %in% 1, "yes","no")

plotMat <- jyluMisc::mscale(plotMat, censor = 5)
plotMat <- plotMat[,rownames(colAnno)]
annoCol <- list(trisomy12 = c(yes = "black",no = "grey80"),
                IGHV.status = c(M = colList[4], U = colList[3]),
                onChr12 = c(yes = colList[1],no = "white"))

pheatmap::pheatmap(plotMat, annotation_col = colAnno, scale = "none", cluster_cols = FALSE,
                   clustering_method = "ward.D2",
                   color = colorRampPalette(c(colList[2],"white",colList[1]))(100),
                   breaks = seq(-5,5, length.out = 101), annotation_colors = annoCol,
                   show_rownames = FALSE, show_colnames = FALSE,
                   treeheight_row = 0)
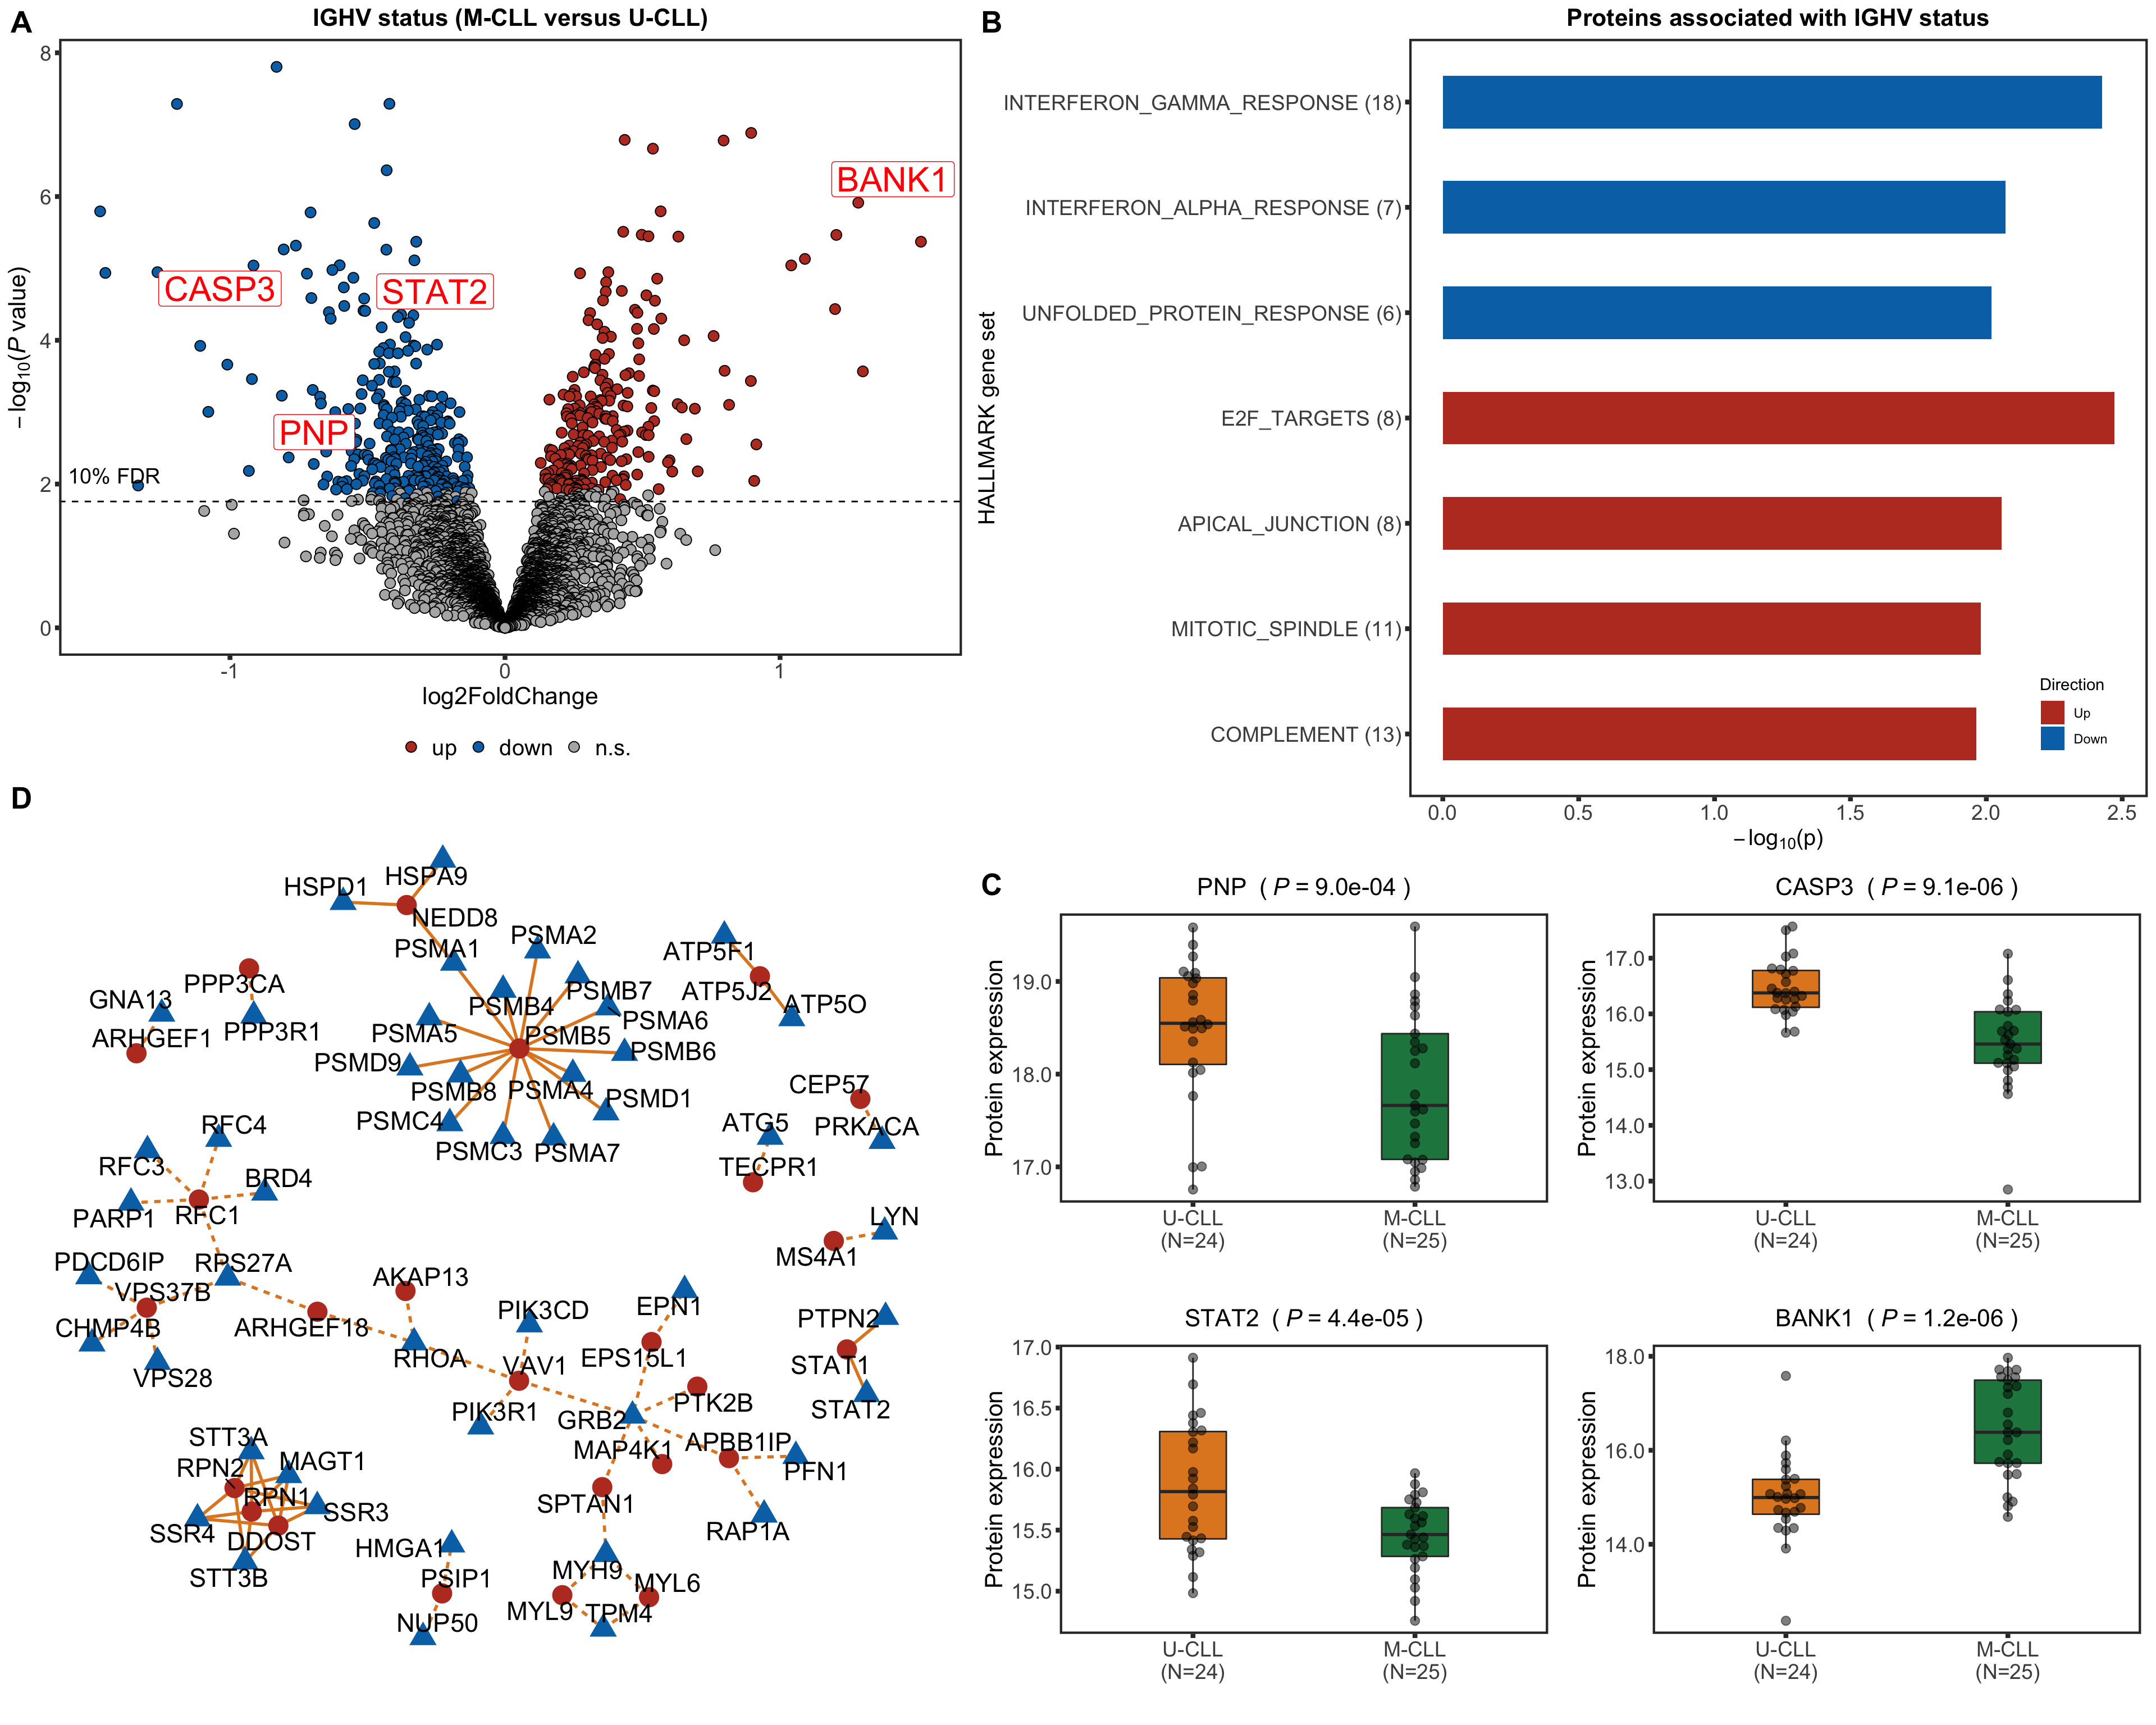
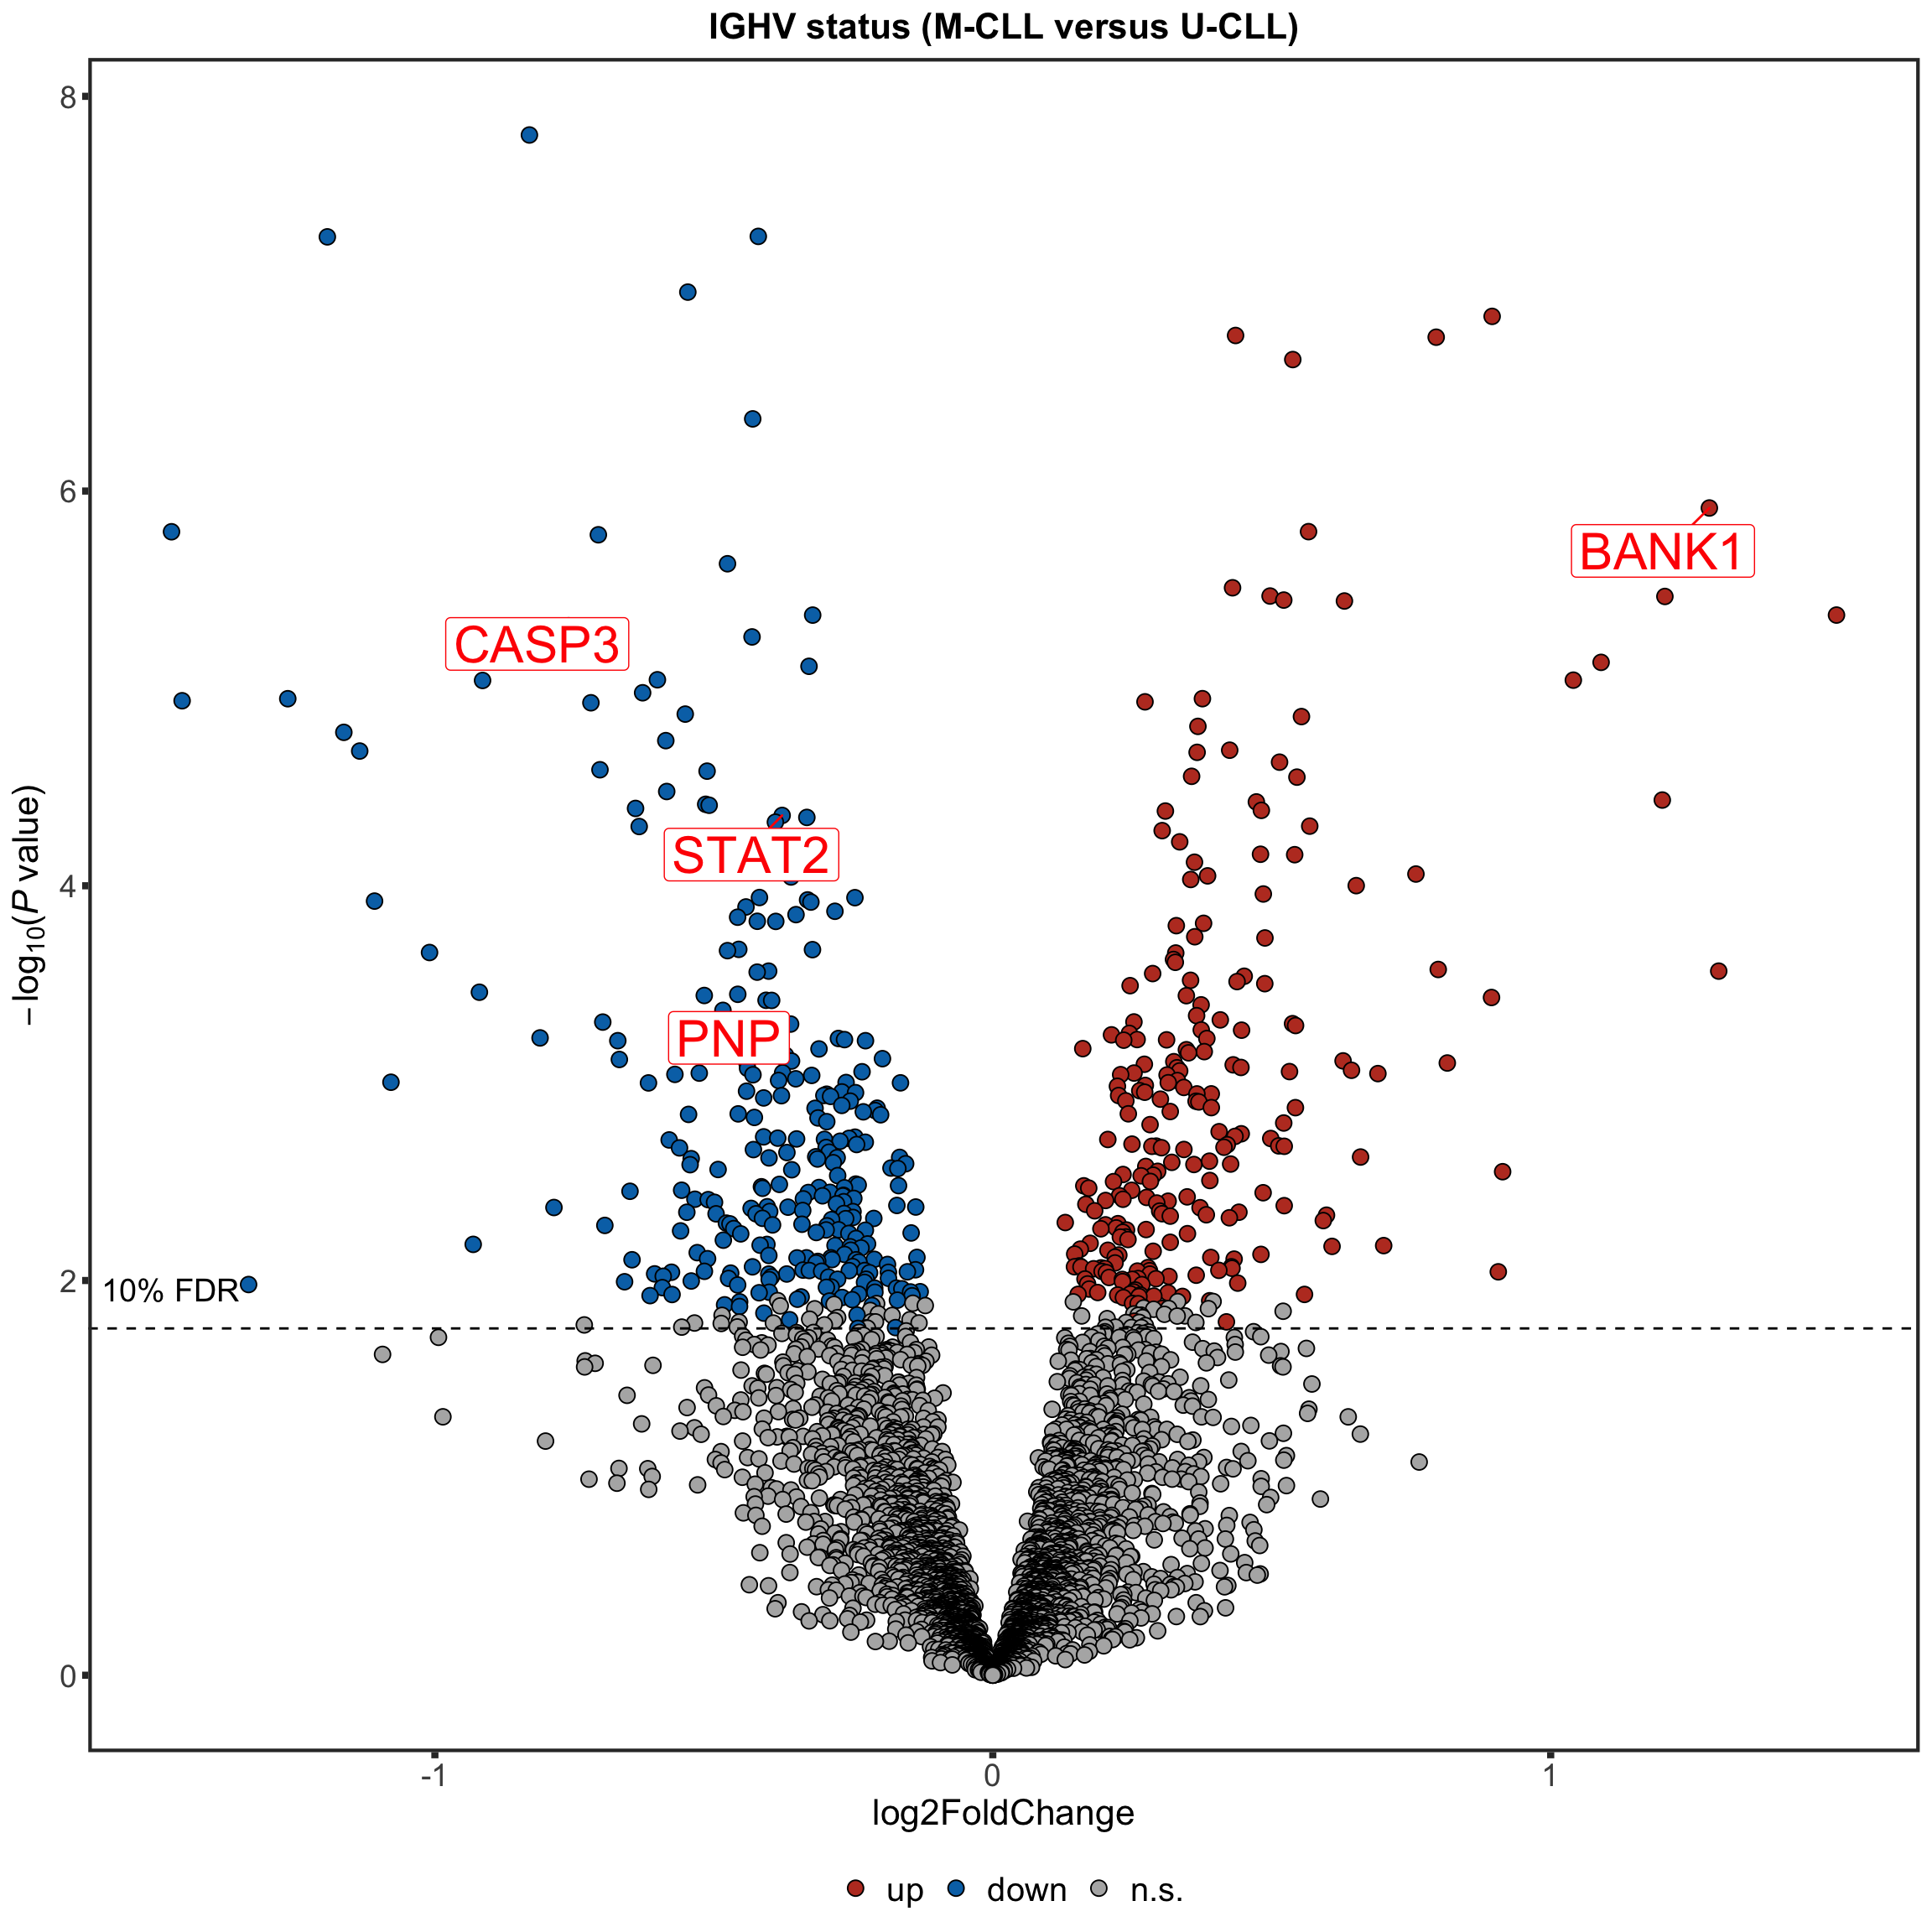
Volcano plot
plotTab <- resList
nameList <- c("BANK1", "CASP3", "STAT2", "PNP")
ighvVolcano <- plotVolcano(plotTab, fdrCut =0.1, x_lab="log2FoldChange", posCol = colList[1], negCol = colList[2],
            plotTitle = "IGHV status (M-CLL versus U-CLL)", ifLabel = TRUE, labelList = nameList)
ighvVolcano
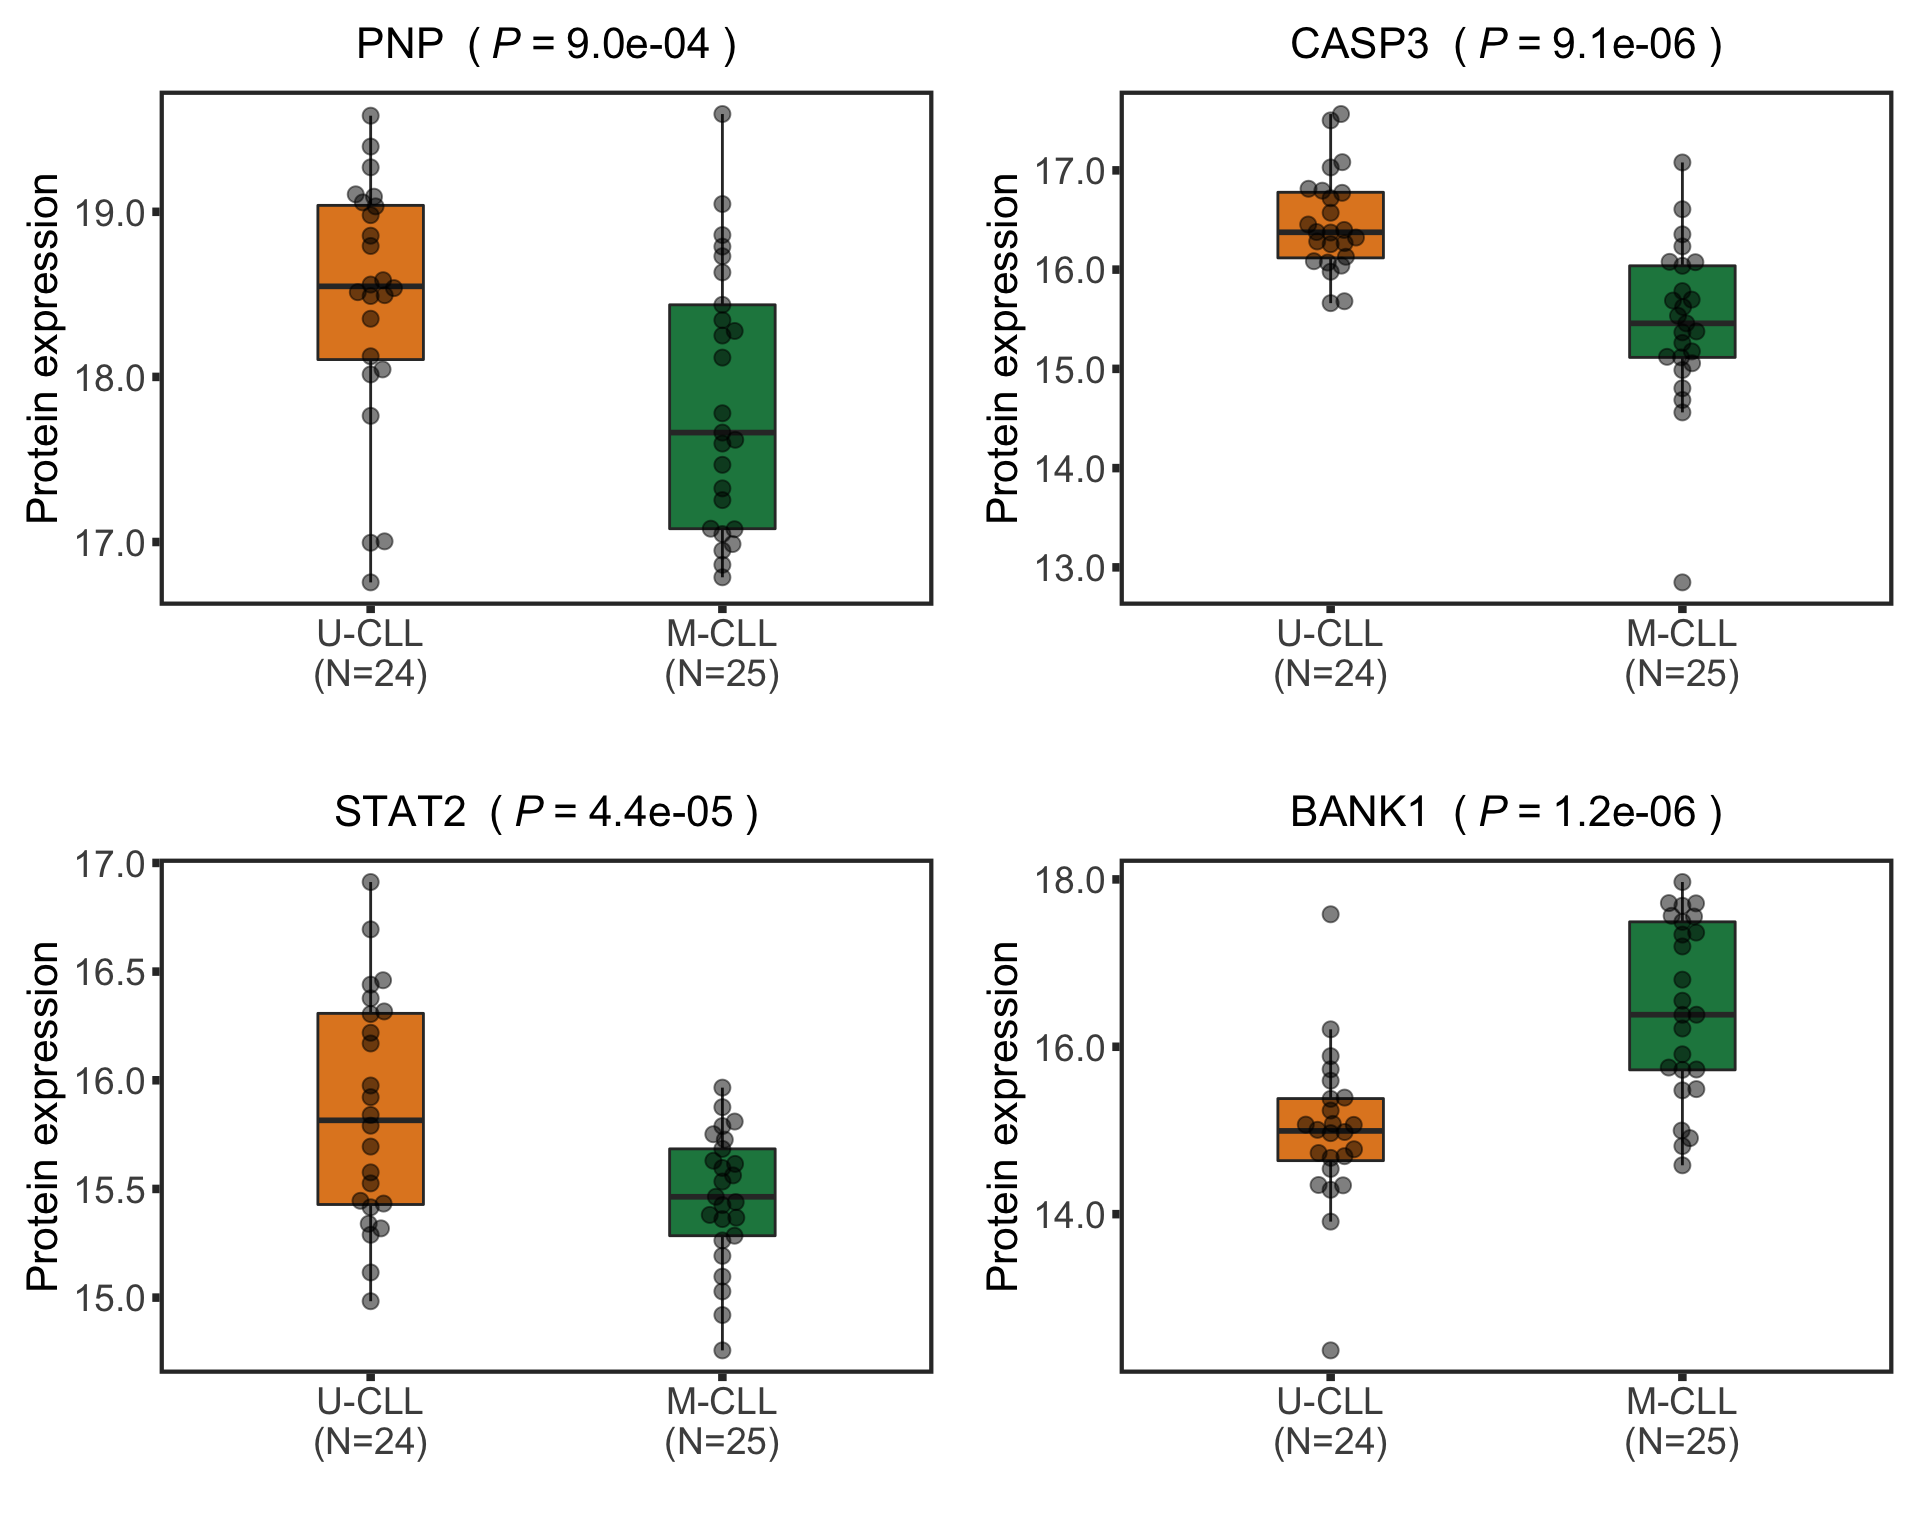
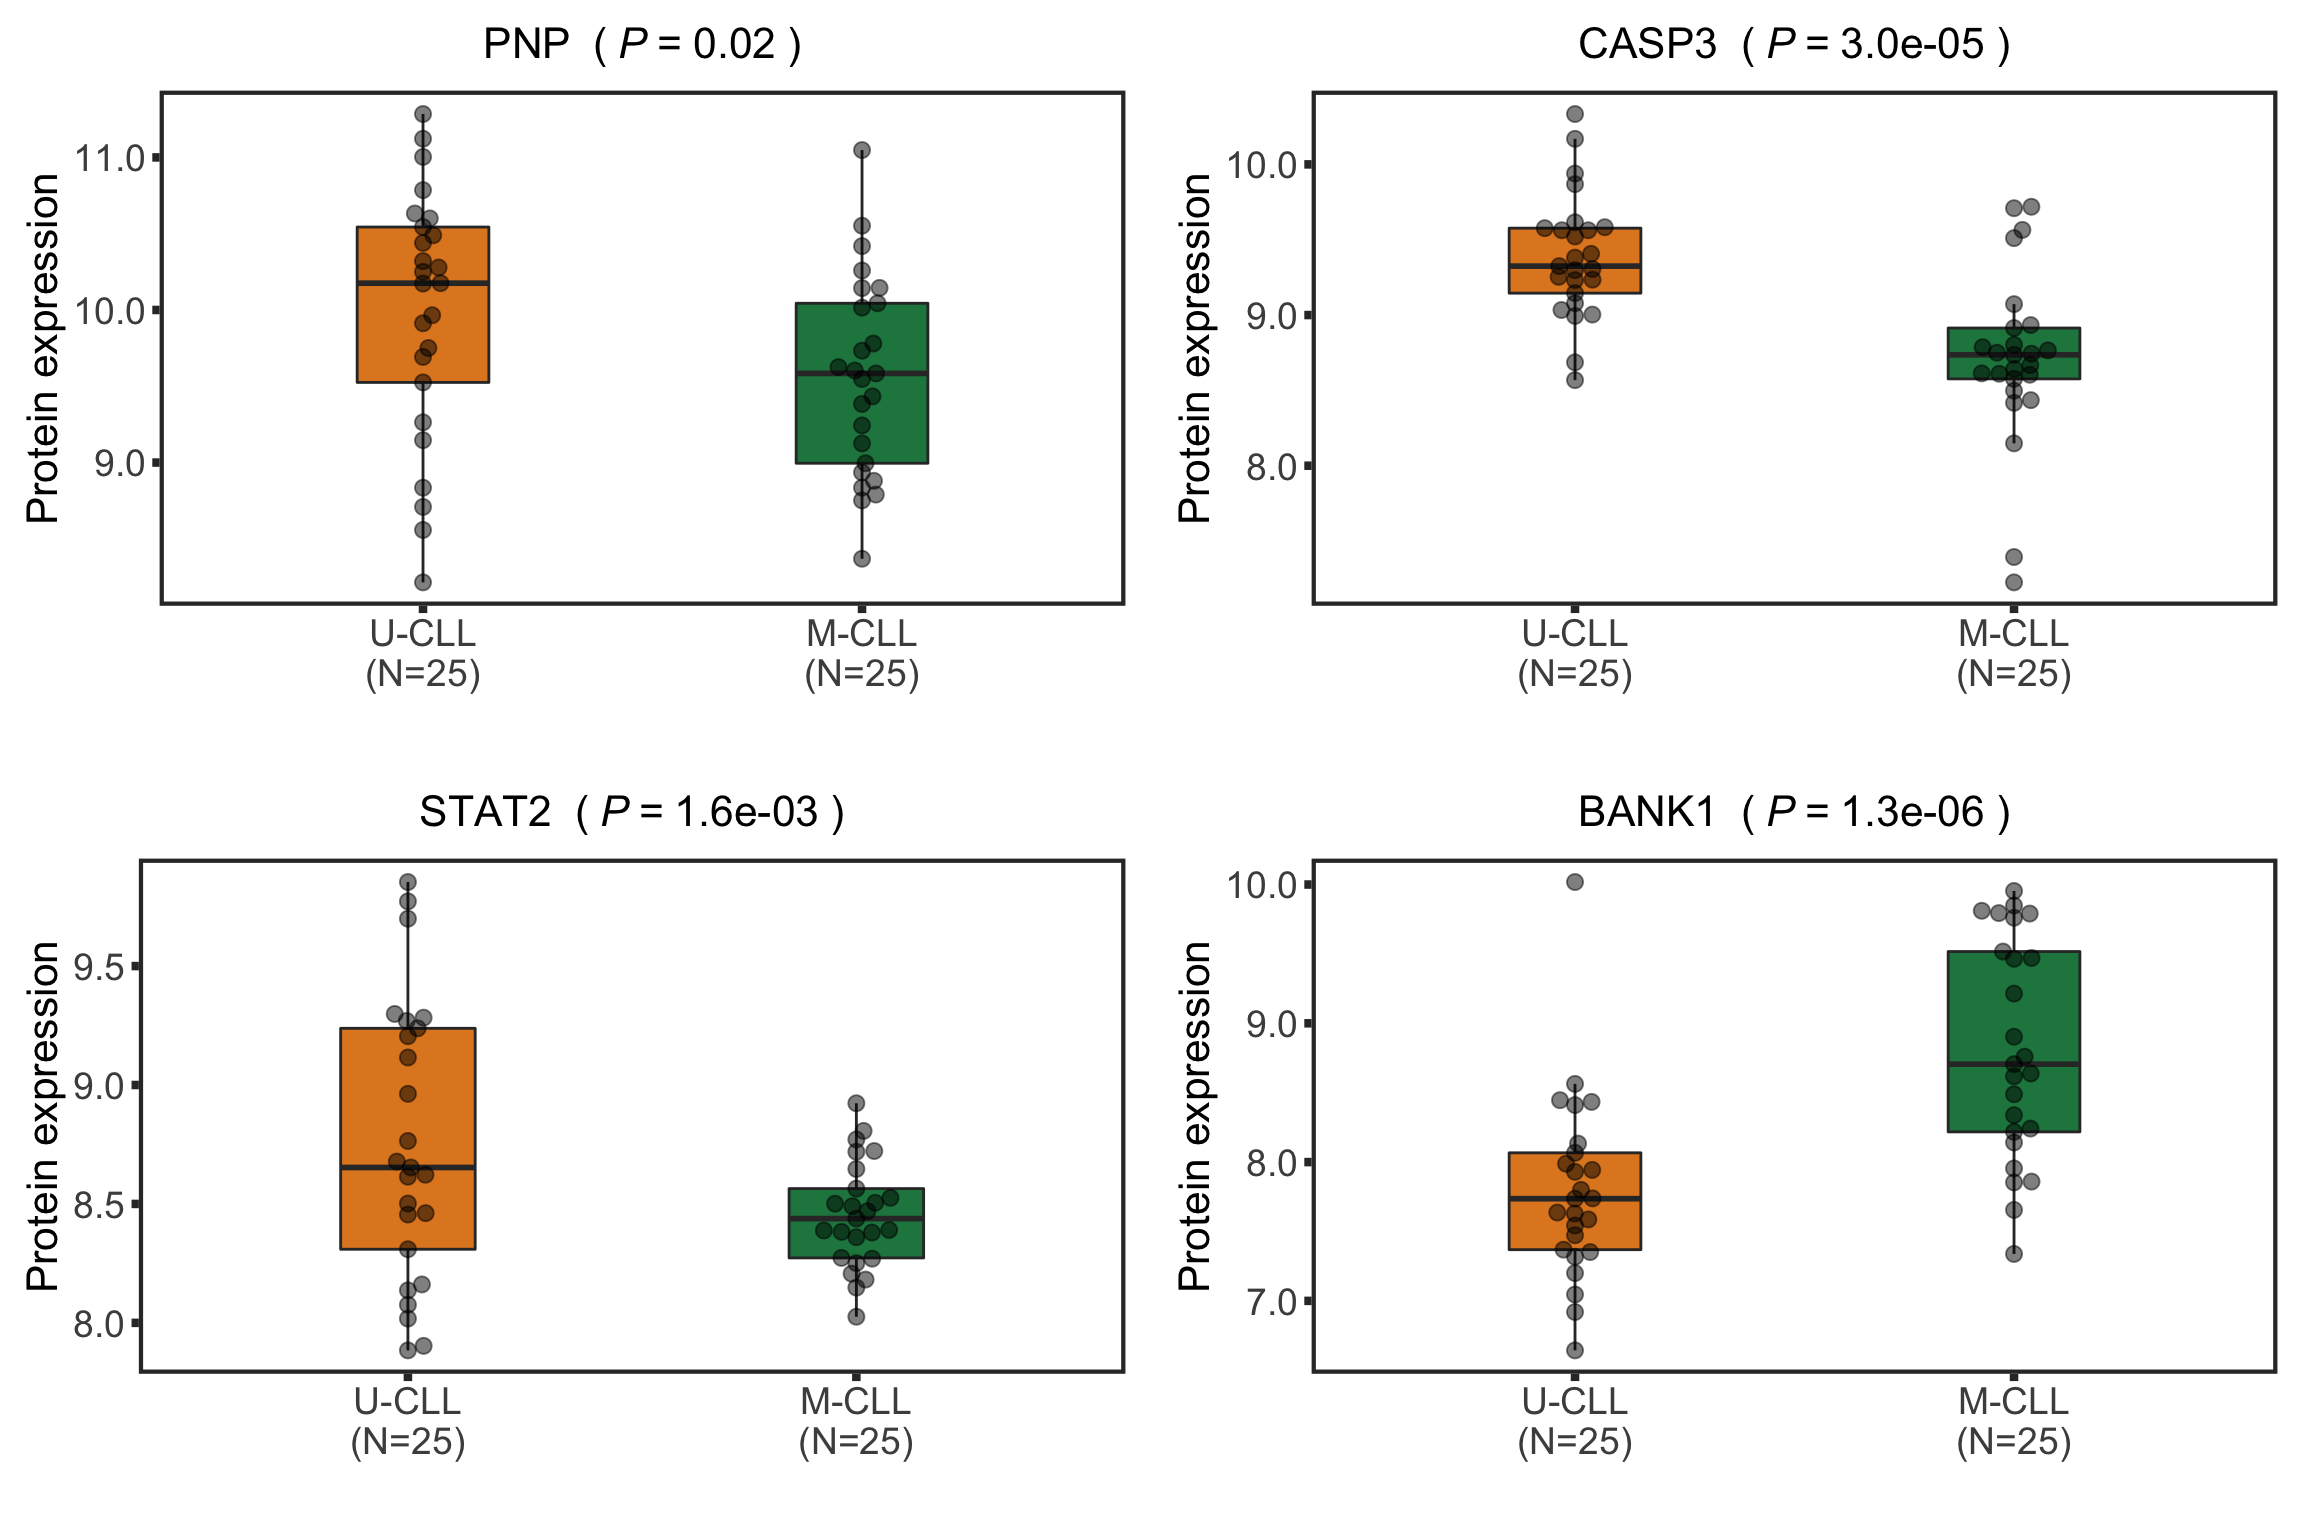
Boxplot plot of selected genes
protTab <- sumToTidy(protCLL, rowID = "uniprotID", colID = "patID")
plotTab <- protTab %>% filter(hgnc_symbol %in% nameList) %>%
  mutate(IGHV = patMeta[match(patID, patMeta$Patient.ID),]$IGHV.status) %>%
  mutate(status = ifelse(IGHV %in% "M","M-CLL","U-CLL"),
         name = hgnc_symbol) %>%
  mutate(status = factor(status, levels = c("U-CLL","M-CLL")))
pList <- plotBox(plotTab, pValTabel = resList, y_lab = "Protein expression")
protBox <- cowplot::plot_grid(plotlist= pList, ncol=2)
protBox
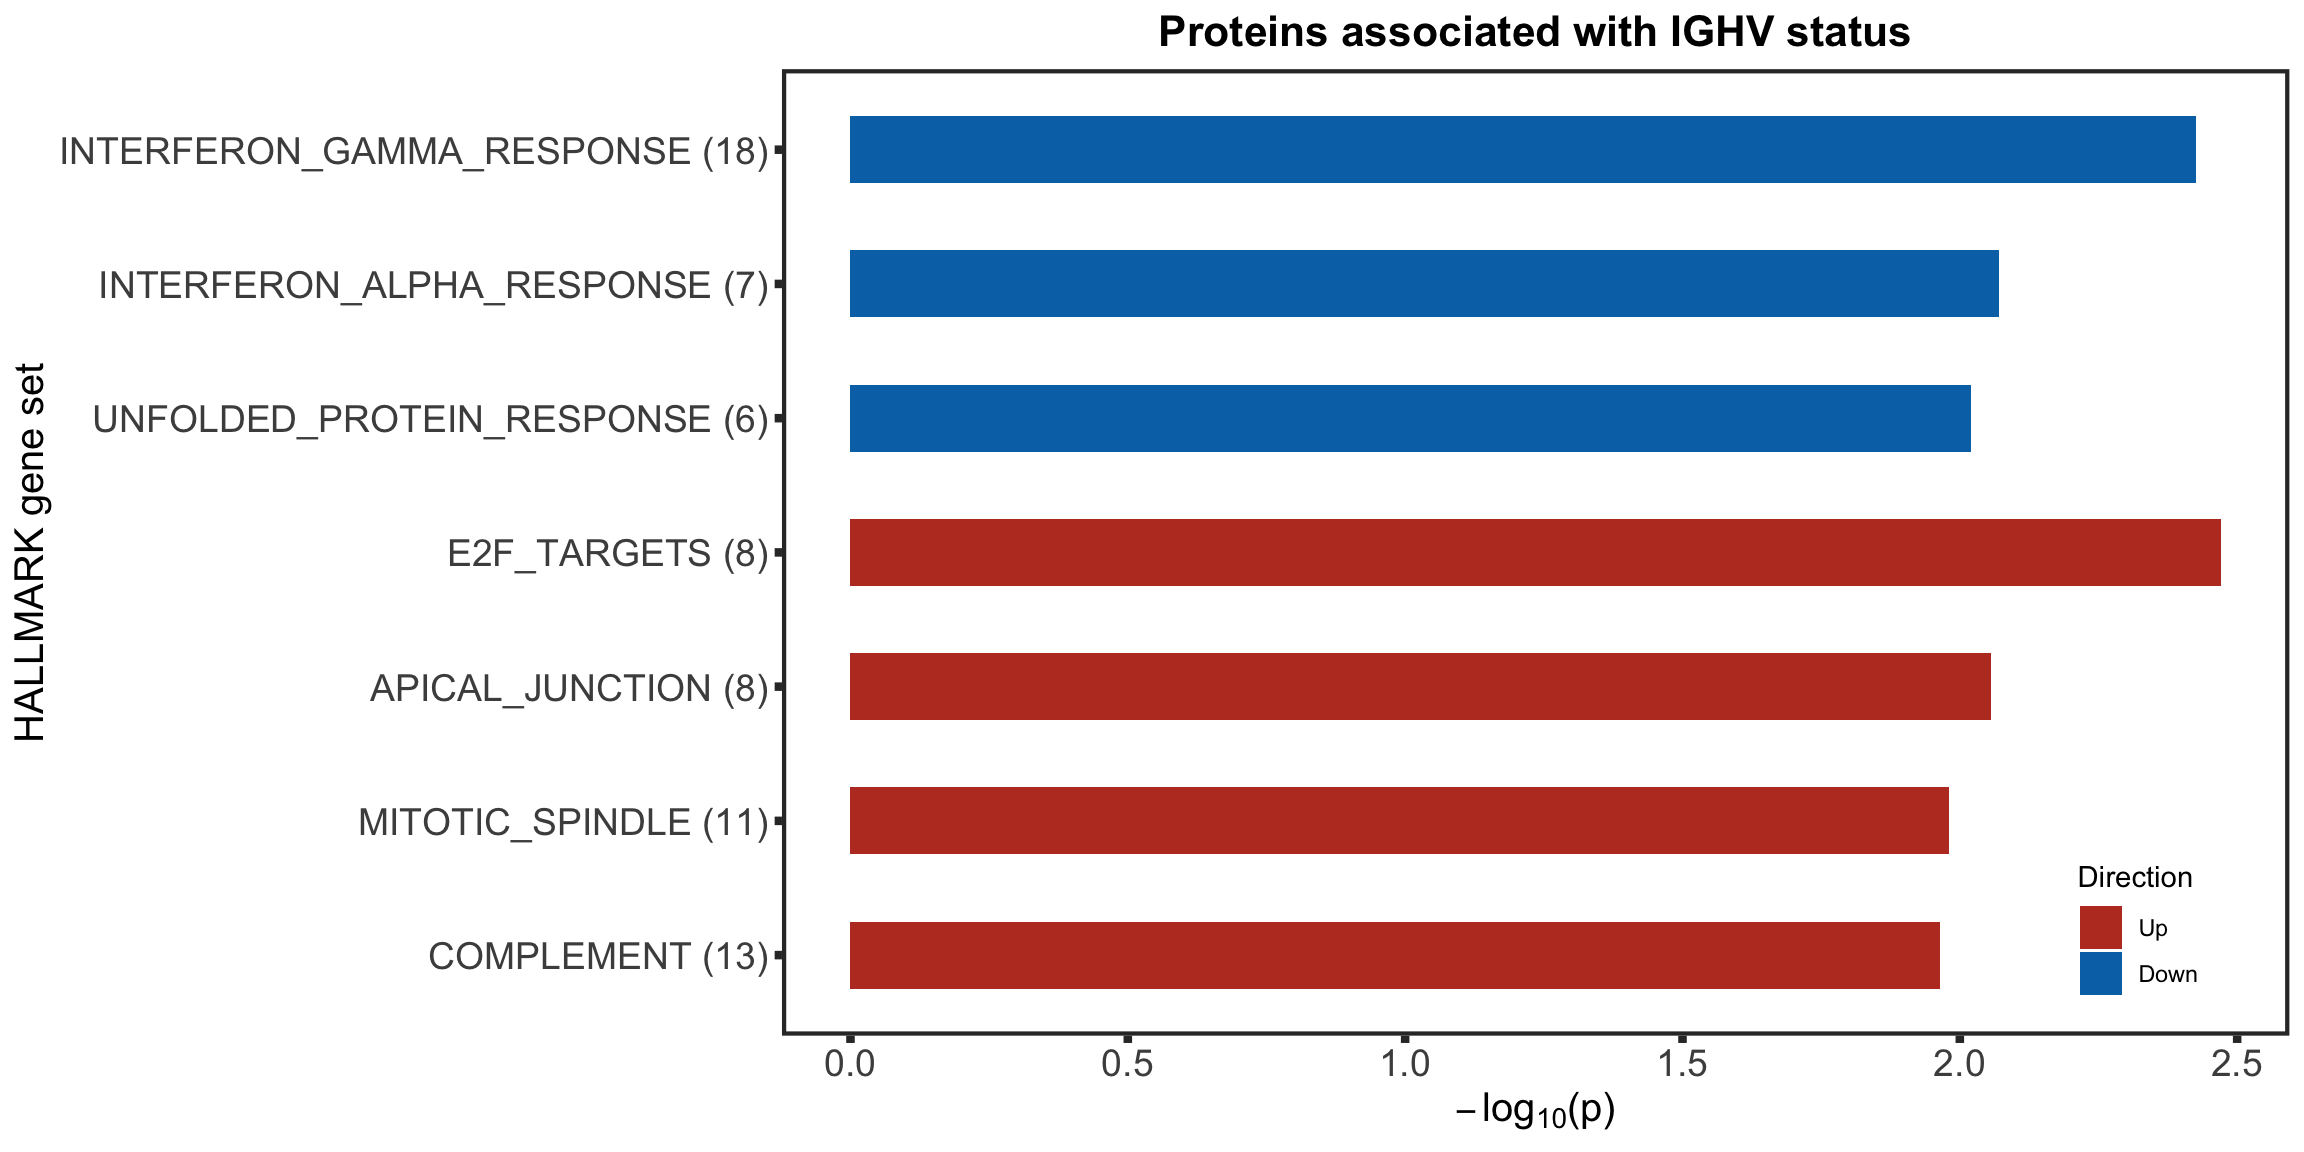
Enrichment analysis
Barplot of enriched pathways
gmts = list(H= "../data/gmts/h.all.v6.2.symbols.gmt",
            KEGG = "../data/gmts/c2.cp.kegg.v6.2.symbols.gmt")
inputTab <- resList %>% filter(adj.P.Val < 0.1, Gene == "IGHV.status") %>%
  mutate(name = rowData(protCLL[id,])$hgnc_symbol) %>% filter(!is.na(name)) %>%
  distinct(name, .keep_all = TRUE) %>%
  select(name, t) %>% data.frame() %>% column_to_rownames("name")
enRes <- list()
enRes[["Proteins associated with IGHV status"]] <- runGSEA(inputTab, gmts$H, "page")

ighvEnrich <- plotEnrichmentBar(enRes[[1]], pCut =0.15, ifFDR= TRUE, setName = "HALLMARK gene set",
                       title = names(enRes)[1], removePrefix = "HALLMARK_", insideLegend=TRUE) +
  theme(legend.position = c(0.9,0.11))
ighvEnrich
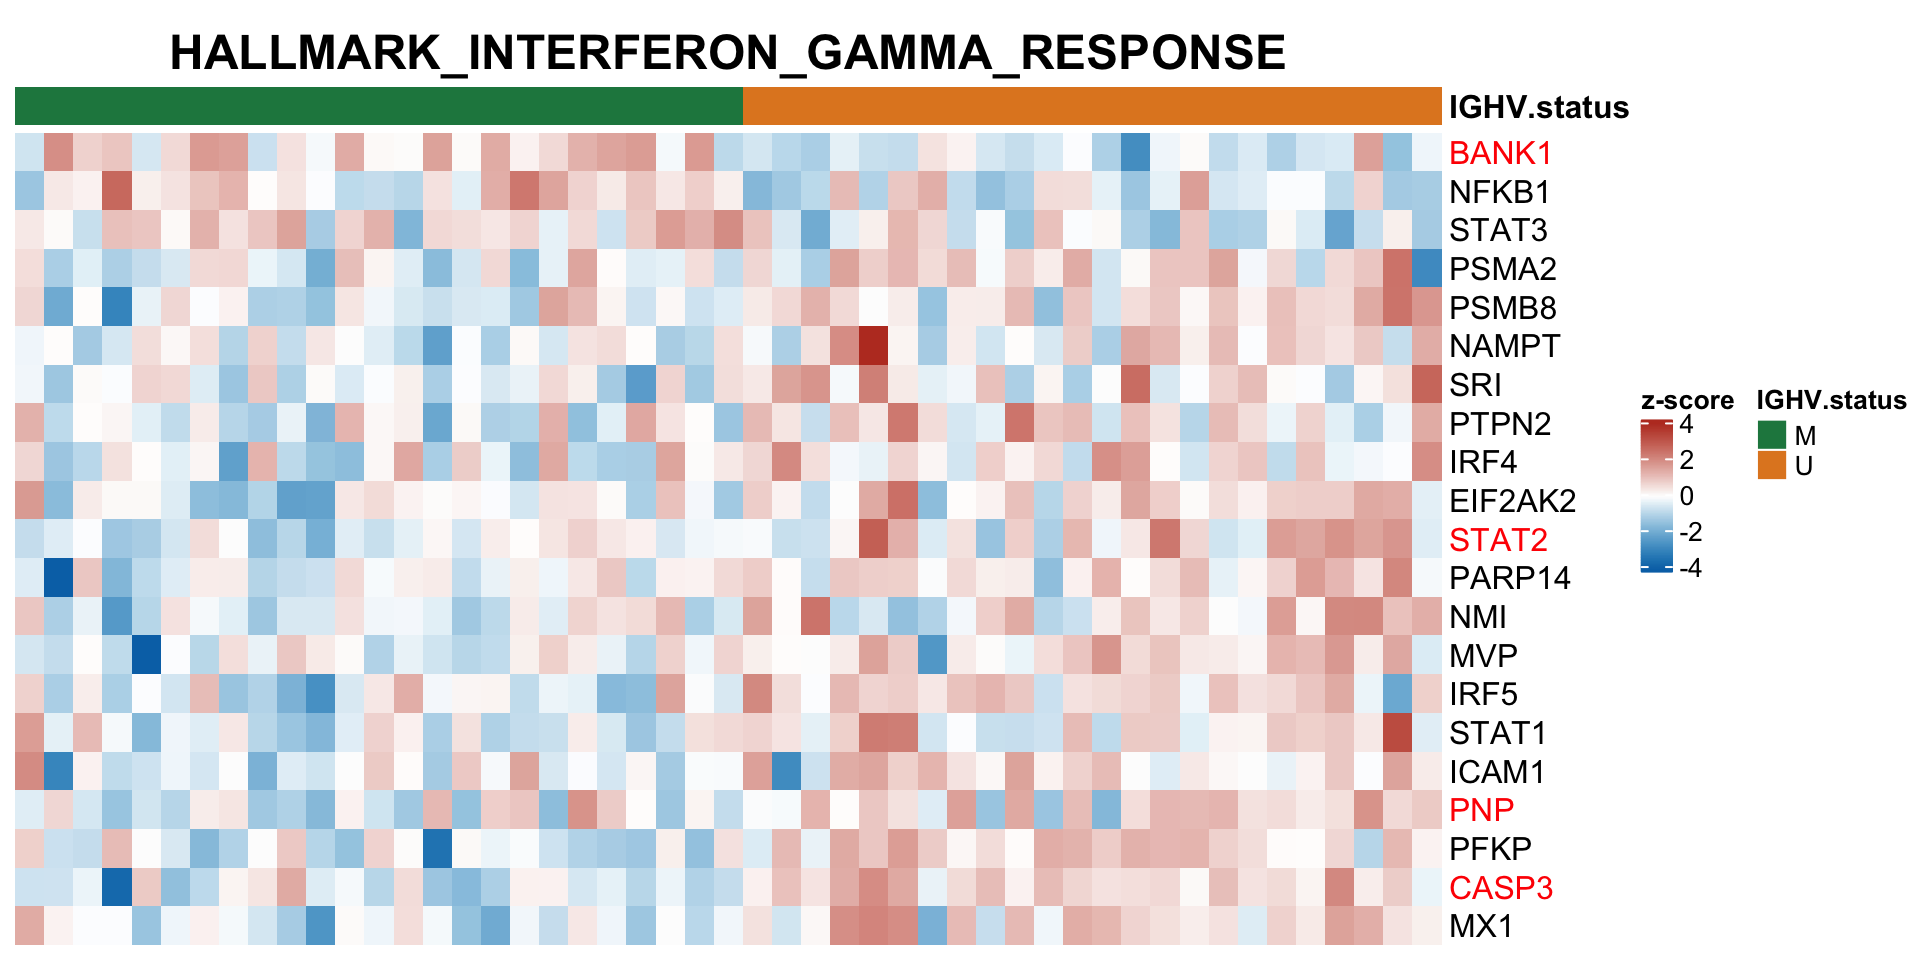
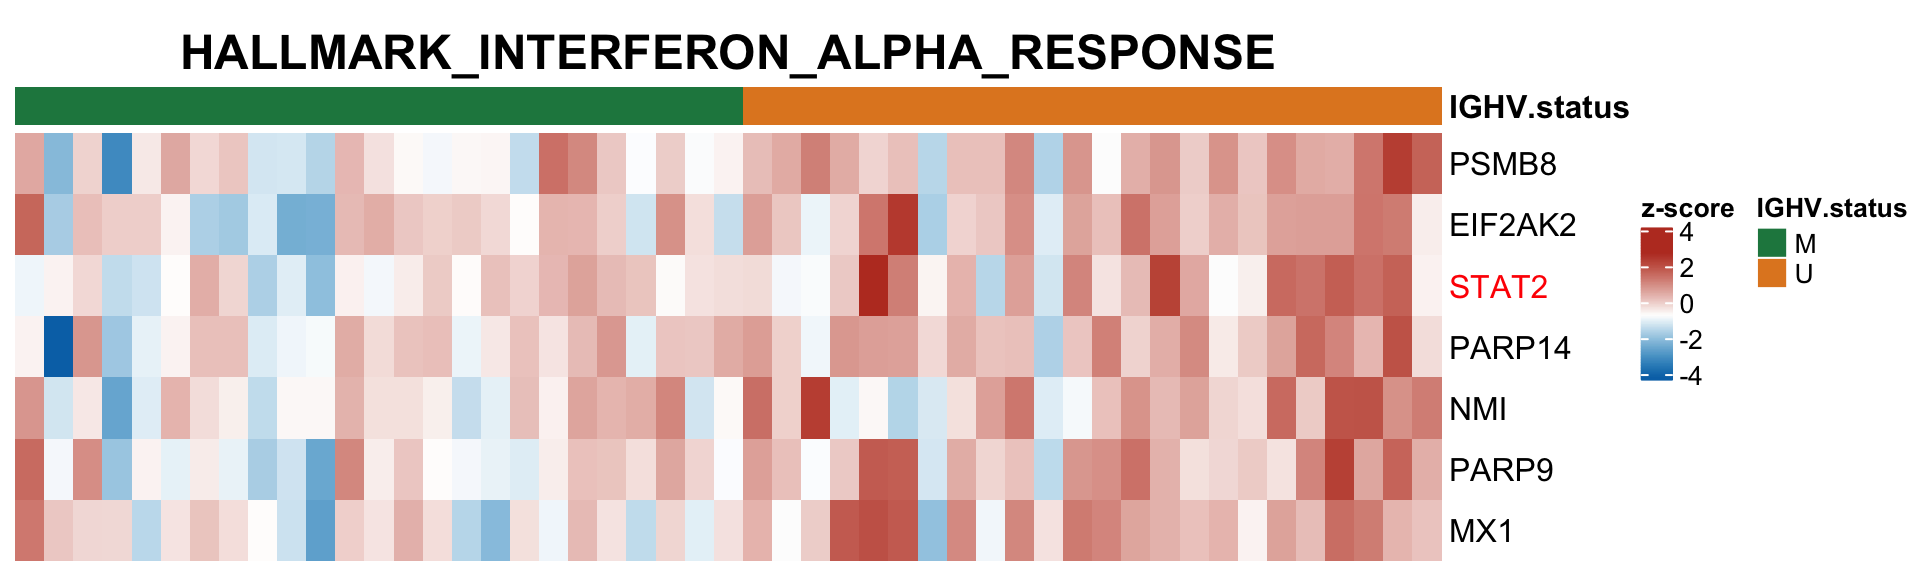
Heatmaps of protein expression in enriched pathways
resList.sig <- filter(resList, !is.na(name), adj.P.Val < 0.1) %>% distinct(name, .keep_all = TRUE)
plotMat <- assays(protCLL)[["QRILC"]][resList.sig$id,]
rownames(plotMat) <- rowData(protCLL[rownames(plotMat),])$hgnc_symbol
colAnno <- filter(patMeta, Patient.ID %in% colnames(protCLL)) %>%
  select(Patient.ID, IGHV.status) %>%
  data.frame() %>% column_to_rownames("Patient.ID")
#colAnno$IGHV.status <- ifelse(colAnno$trisomy12 %in% 1, "yes","no")

plotMat <- jyluMisc::mscale(plotMat, censor = 5)

annoCol <- list(trisomy12 = c(yes = "black",no = "grey80"),
                IGHV.status = c(M = colList[4], U = colList[3]),
                onChr12 = c(yes = colList[1],no = "white"))
plotSetHeatmap(resList.sig, gmts$H, "HALLMARK_INTERFERON_GAMMA_RESPONSE", plotMat, colAnno, annoCol = annoCol, highLight = nameList)
plotSetHeatmap(resList.sig, gmts$H, "HALLMARK_INTERFERON_ALPHA_RESPONSE", plotMat, colAnno, annoCol = annoCol, highLight = nameList)
Compare with RNA sequencing data
Differentially expressed genes related to IGHV
Prepare RNA sequencing data
dds$diag <- patMeta[match(dds$PatID, patMeta$Patient.ID),]$diagnosis
dds$trisomy12 <- patMeta[match(dds$PatID, patMeta$Patient.ID),]$trisomy12
dds$IGHV <- patMeta[match(dds$PatID, patMeta$Patient.ID),]$IGHV.status

ddsCLL <- dds[rownames(dds) %in% rowData(protCLL)$ensembl_gene_id, dds$diag %in% "CLL" & !is.na(dds$IGHV) & !is.na(dds$trisomy12)]
ddsCLL.vst <- varianceStabilizingTransformation(ddsCLL)
Differential expression
design(ddsCLL) <- ~ trisomy12 + IGHV
deRes <- DESeq(ddsCLL)
resTab <- results(deRes, contrast = c("IGHV","M","U"), tidy = TRUE) %>%
  mutate(name = rowData(ddsCLL[row,])$symbol) %>%
  dplyr::rename(P.Value = pvalue)
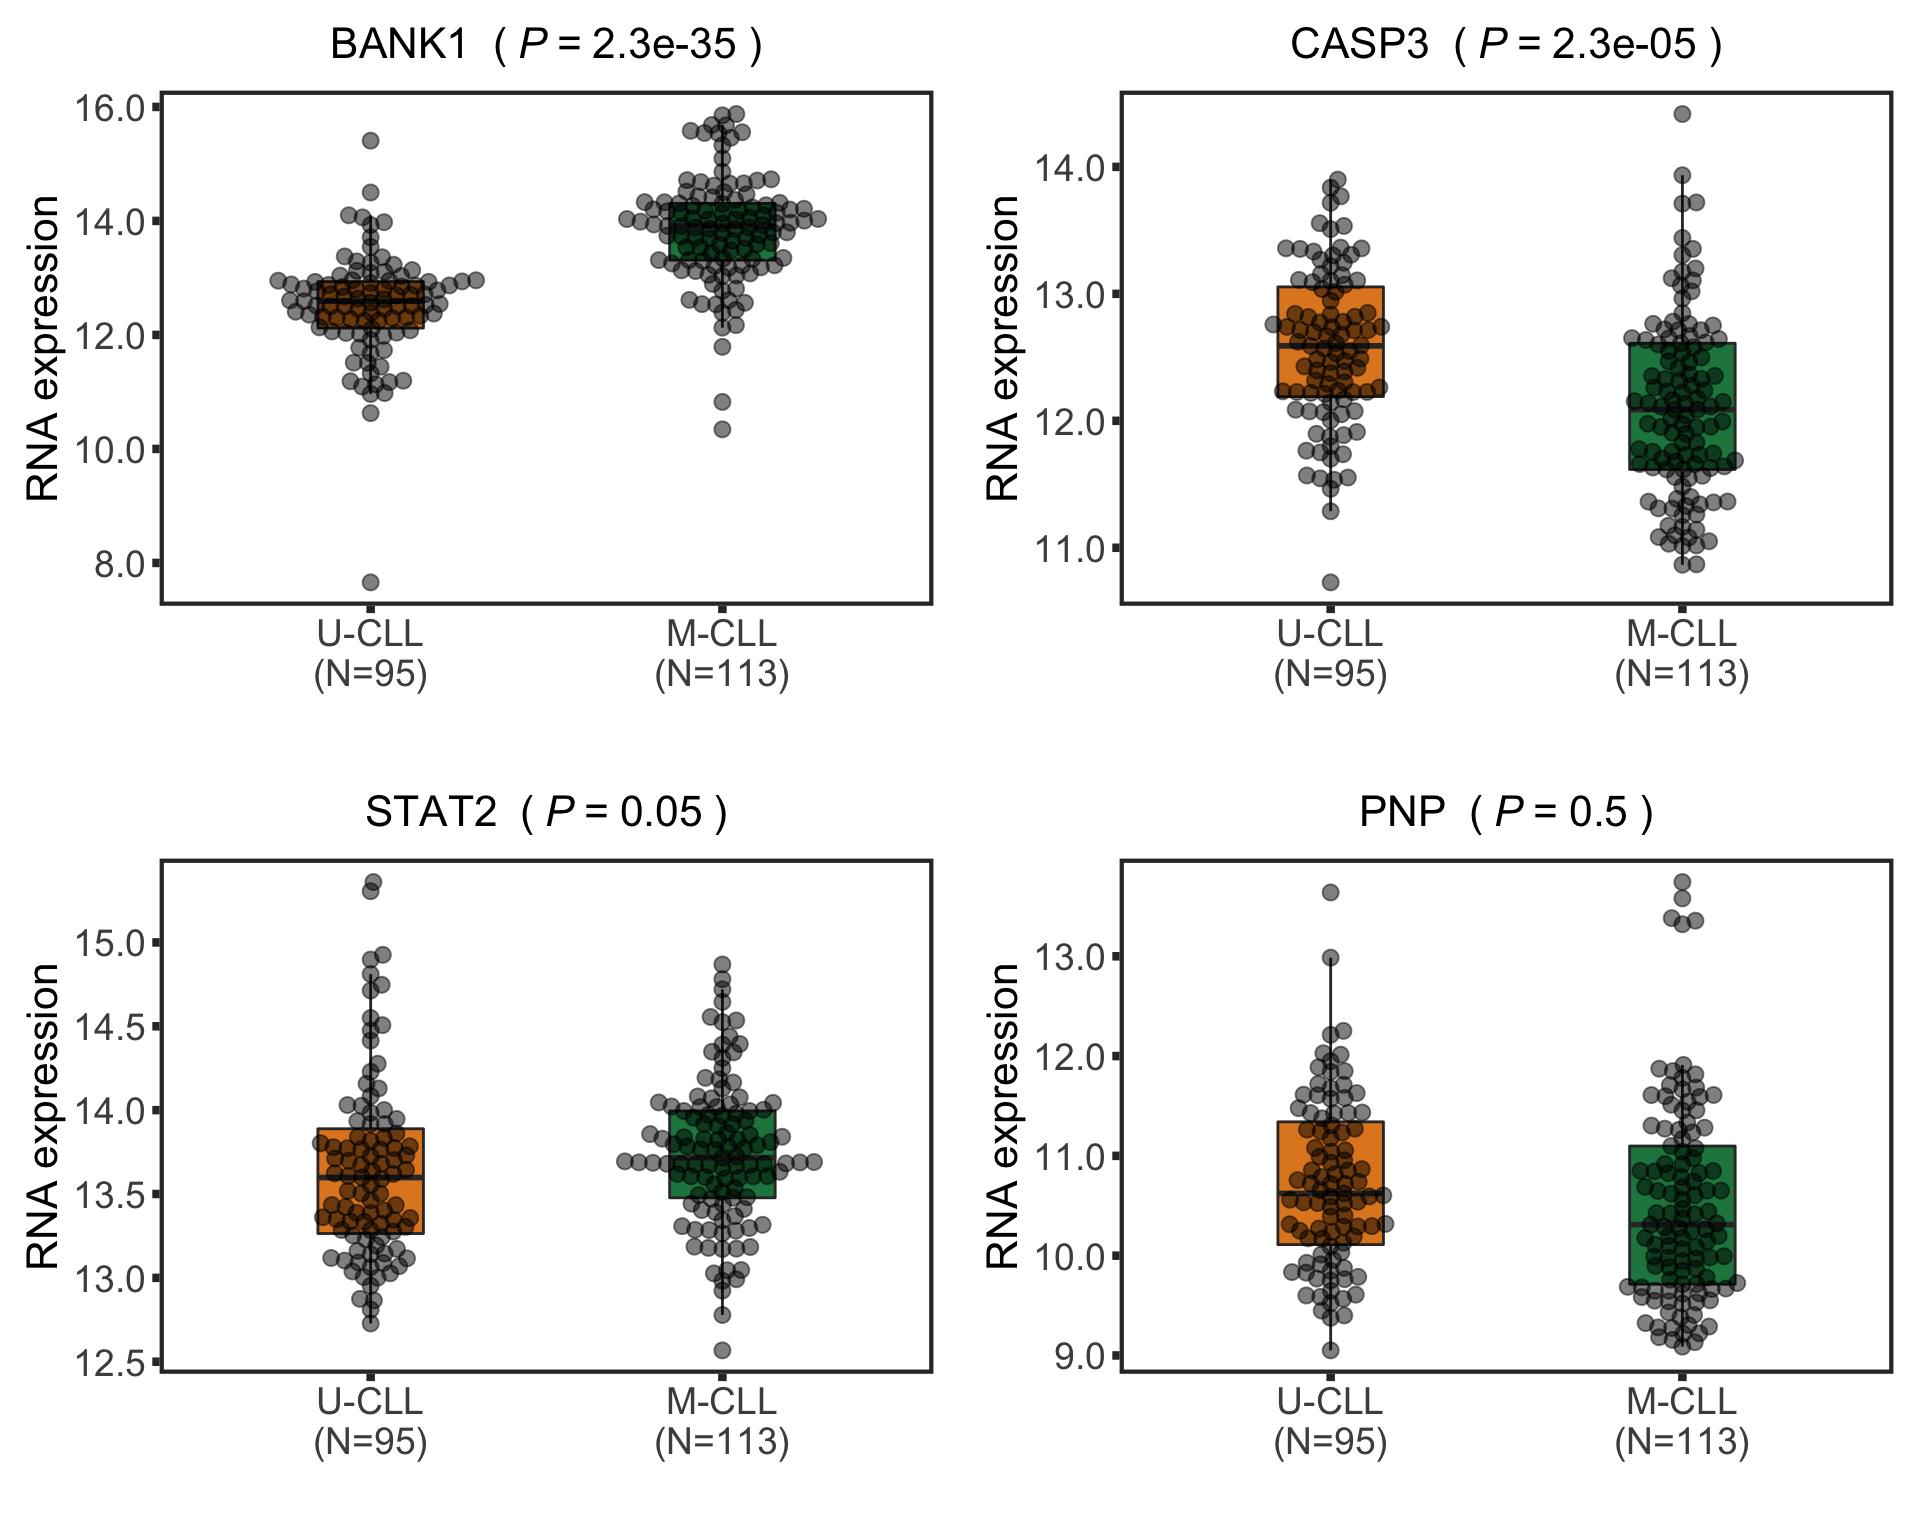
Boxplot of selected genes
plotTab <- assay(ddsCLL.vst[match(nameList, rowData(ddsCLL.vst)$symbol),]) %>%
  data.frame() %>% rownames_to_column("id") %>%
  mutate(name = rowData(ddsCLL.vst[id,])$symbol) %>%
  gather(key = "patID", value = "count", -id, -name) %>%
  mutate(IGHV = patMeta[match(patID, patMeta$Patient.ID),]$IGHV.status) %>%
  mutate(status = ifelse(IGHV %in% "M","M-CLL","U-CLL"))%>%
  mutate(status = factor(status, levels = c("U-CLL","M-CLL")))

pList <- plotBox(plotTab, pValTabel = resTab, y_lab = "RNA expression")
cowplot::plot_grid(plotlist= pList, ncol=2)
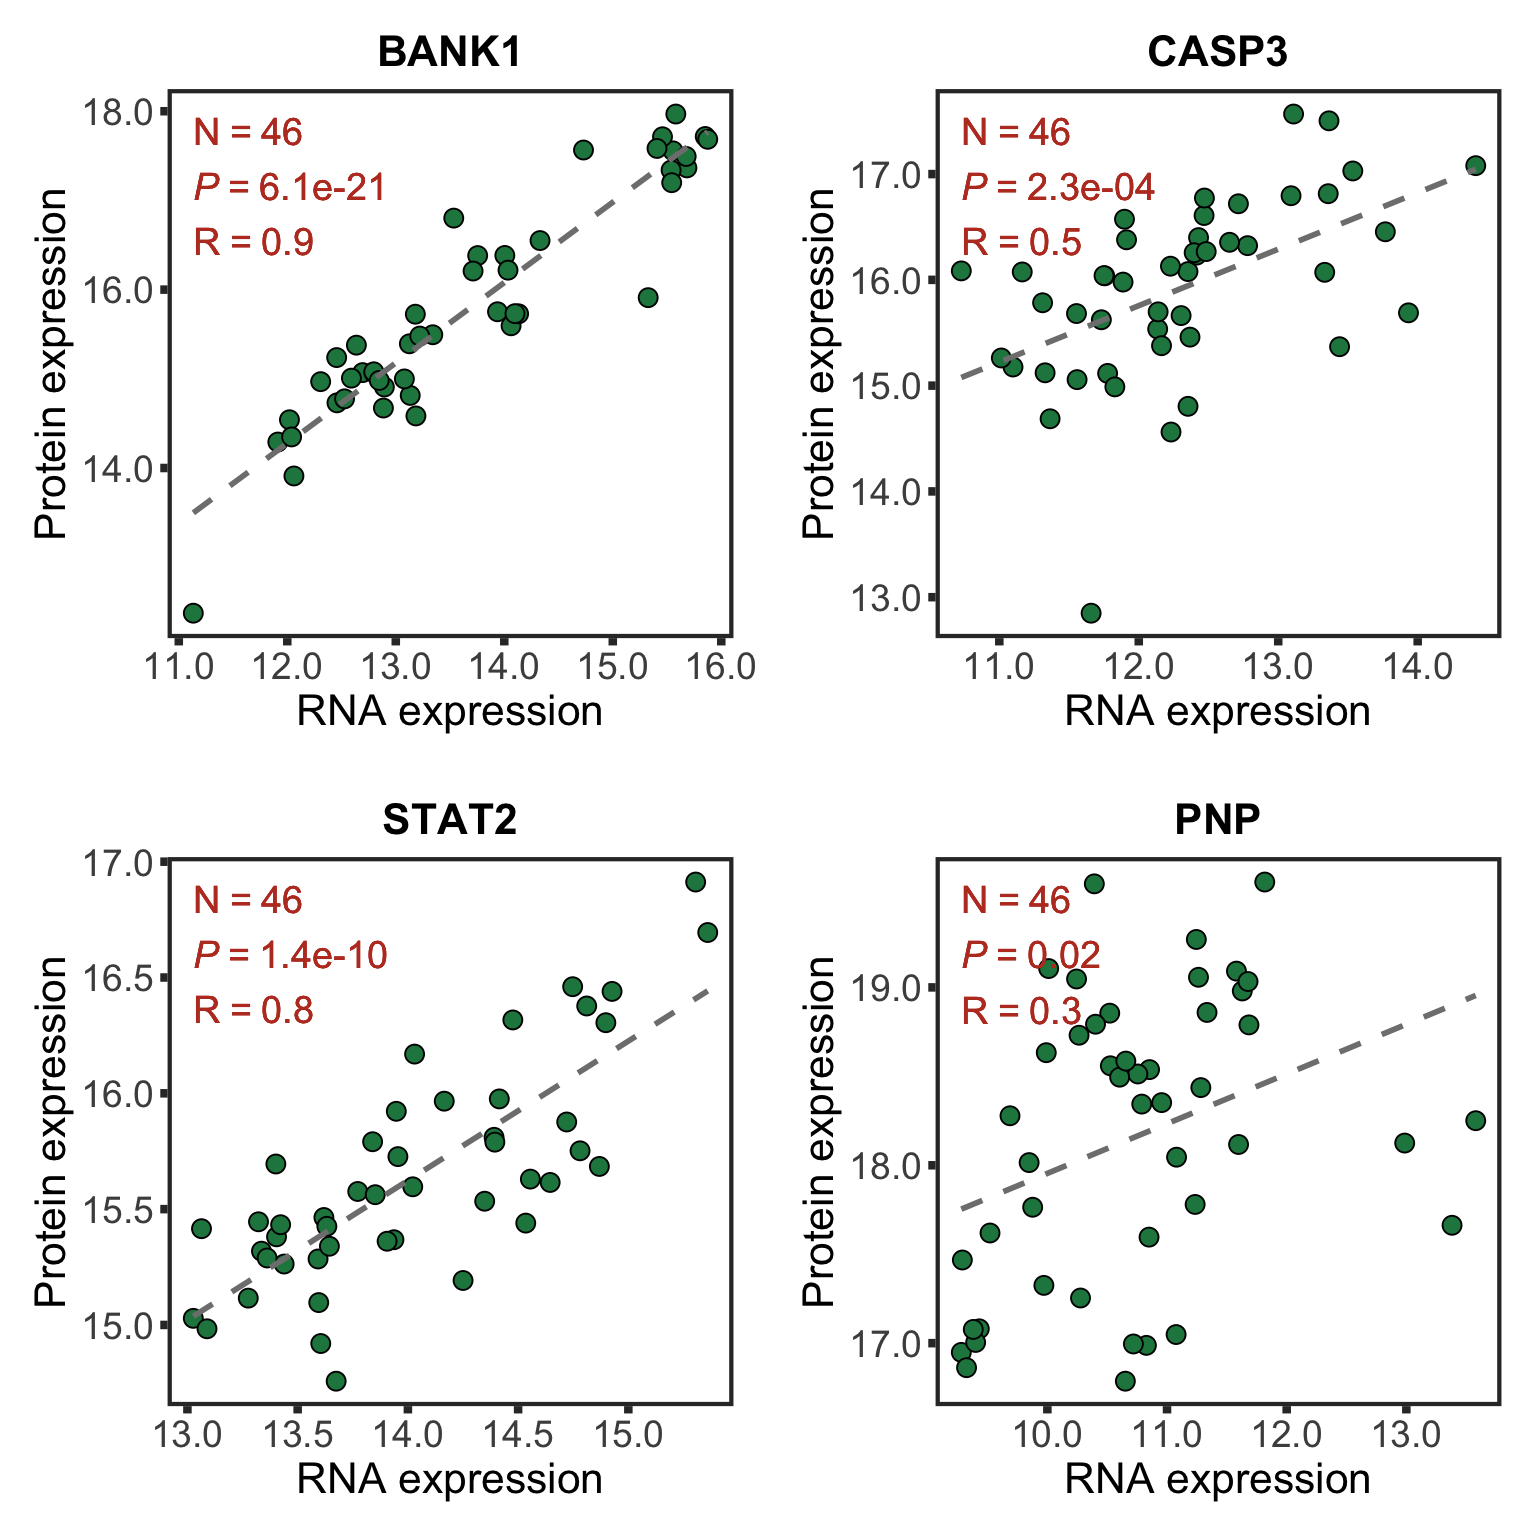
Correlations between RNA and protein expression
rnaMat <- assay(ddsCLL.vst)
protMat <- assays(protCLL)[["count"]]
rownames(protMat) <- rowData(protCLL)$ensembl_gene_id
overSample <- intersect(colnames(rnaMat), colnames(protMat))
rnaMat <- rnaMat[,overSample]
protMat <- protMat[,overSample]

plotList <- lapply(nameList, function(n) {
  geneId <- rownames(ddsCLL.vst)[match(n, rowData(ddsCLL.vst)$symbol)]
  stopifnot(length(geneId) ==1)
  plotTab <- tibble(x=rnaMat[geneId,],y=protMat[geneId,])
  coef <- cor(plotTab$x, plotTab$y, use="pairwise.complete")
  annoPos <- ifelse (coef > 0, "left","right")
  plotCorScatter(plotTab, "x","y", showR2 = FALSE, annoPos = annoPos, x_lab = "RNA expression",
                 y_lab ="Protein expression", title = n,dotCol = colList[4], textCol = colList[1])
})
cowplot::plot_grid(plotlist = plotList, ncol =2)
Protein complex analysis
Preprocessing
Preprocessing protein and RNA data
#subset samples and genes
overSampe <- intersect(colnames(ddsCLL), colnames(protCLL))
overGene <- intersect(rownames(ddsCLL), rowData(protCLL)$ensembl_gene_id)
ddsSub <- ddsCLL[overGene, overSampe]
protSub <- protCLL[match(overGene, rowData(protCLL)$ensembl_gene_id),overSampe]
rowData(ddsSub)$uniprotID <- rownames(protSub)[match(rownames(ddsSub),rowData(protSub)$ensembl_gene_id)]

#vst
ddsSub.vst <- varianceStabilizingTransformation(ddsSub)
Processing protein complex data
int_pairs <- read_delim("../data/proteins_in_complexes", delim = "\t") %>%
  mutate(Reactome = grepl("Reactome",Evidence_supporting_the_interaction),
         Corum = grepl("Corum",Evidence_supporting_the_interaction)) %>%
  filter(ProtA %in% rownames(protSub) & ProtB %in% rownames(protSub)) %>%
  mutate(pair=map2_chr(ProtA, ProtB, ~paste0(sort(c(.x,.y)), collapse = "-"))) %>%
  mutate(database = case_when(
    Reactome & Corum ~ "both",
    Reactome & !Corum ~ "Reactome",
    !Reactome & Corum ~ "Corum",
    TRUE ~ "other"
  )) %>% mutate(inComplex = "yes")
Differential RNA/protein expression analysis related to IGHV
The differential expression is restricted to samples with proteomic data, in order to have similar statistical power
ddsSub$trisomy12 <- patMeta[match(ddsSub$PatID,patMeta$Patient.ID),]$trisomy12
ddsSub$IGHV <- patMeta[match(ddsSub$PatID, patMeta$Patient.ID),]$IGHV.status
levels(ddsSub$IGHV) <- c("U","M")
design(ddsSub) <- ~ trisomy12 + IGHV
deRes <- DESeq(ddsSub, betaPrior = TRUE)
rnaRes <- results(deRes, name = "IGHVM", tidy = TRUE) %>%
  dplyr::rename(geneID = row, log2FC.rna = log2FoldChange,
                pvalue.rna = pvalue, padj.rna = padj) %>%
  select(geneID, log2FC.rna, pvalue.rna, padj.rna)
Number of differentially expressed RNA (10% FDR)
nrow(filter(rnaRes, padj.rna <0.1))
[1] 624
Protein abundance changes related to IGHV
fdrCut <- 0.1
protRes <- resList %>% filter(Gene == "IGHV.status") %>%
    dplyr::rename(uniprotID = id,
                  pvalue = P.Value, padj = adj.P.IHW,
                  chrom = Chr) %>%
    mutate(geneID = rowData(protCLL[uniprotID,])$ensembl_gene_id) %>%
    select(name, uniprotID, geneID, chrom, logFC, pvalue, padj) %>%
    arrange(pvalue) %>% as_tibble()
Combine
allRes <- left_join(protRes, rnaRes, by = "geneID")
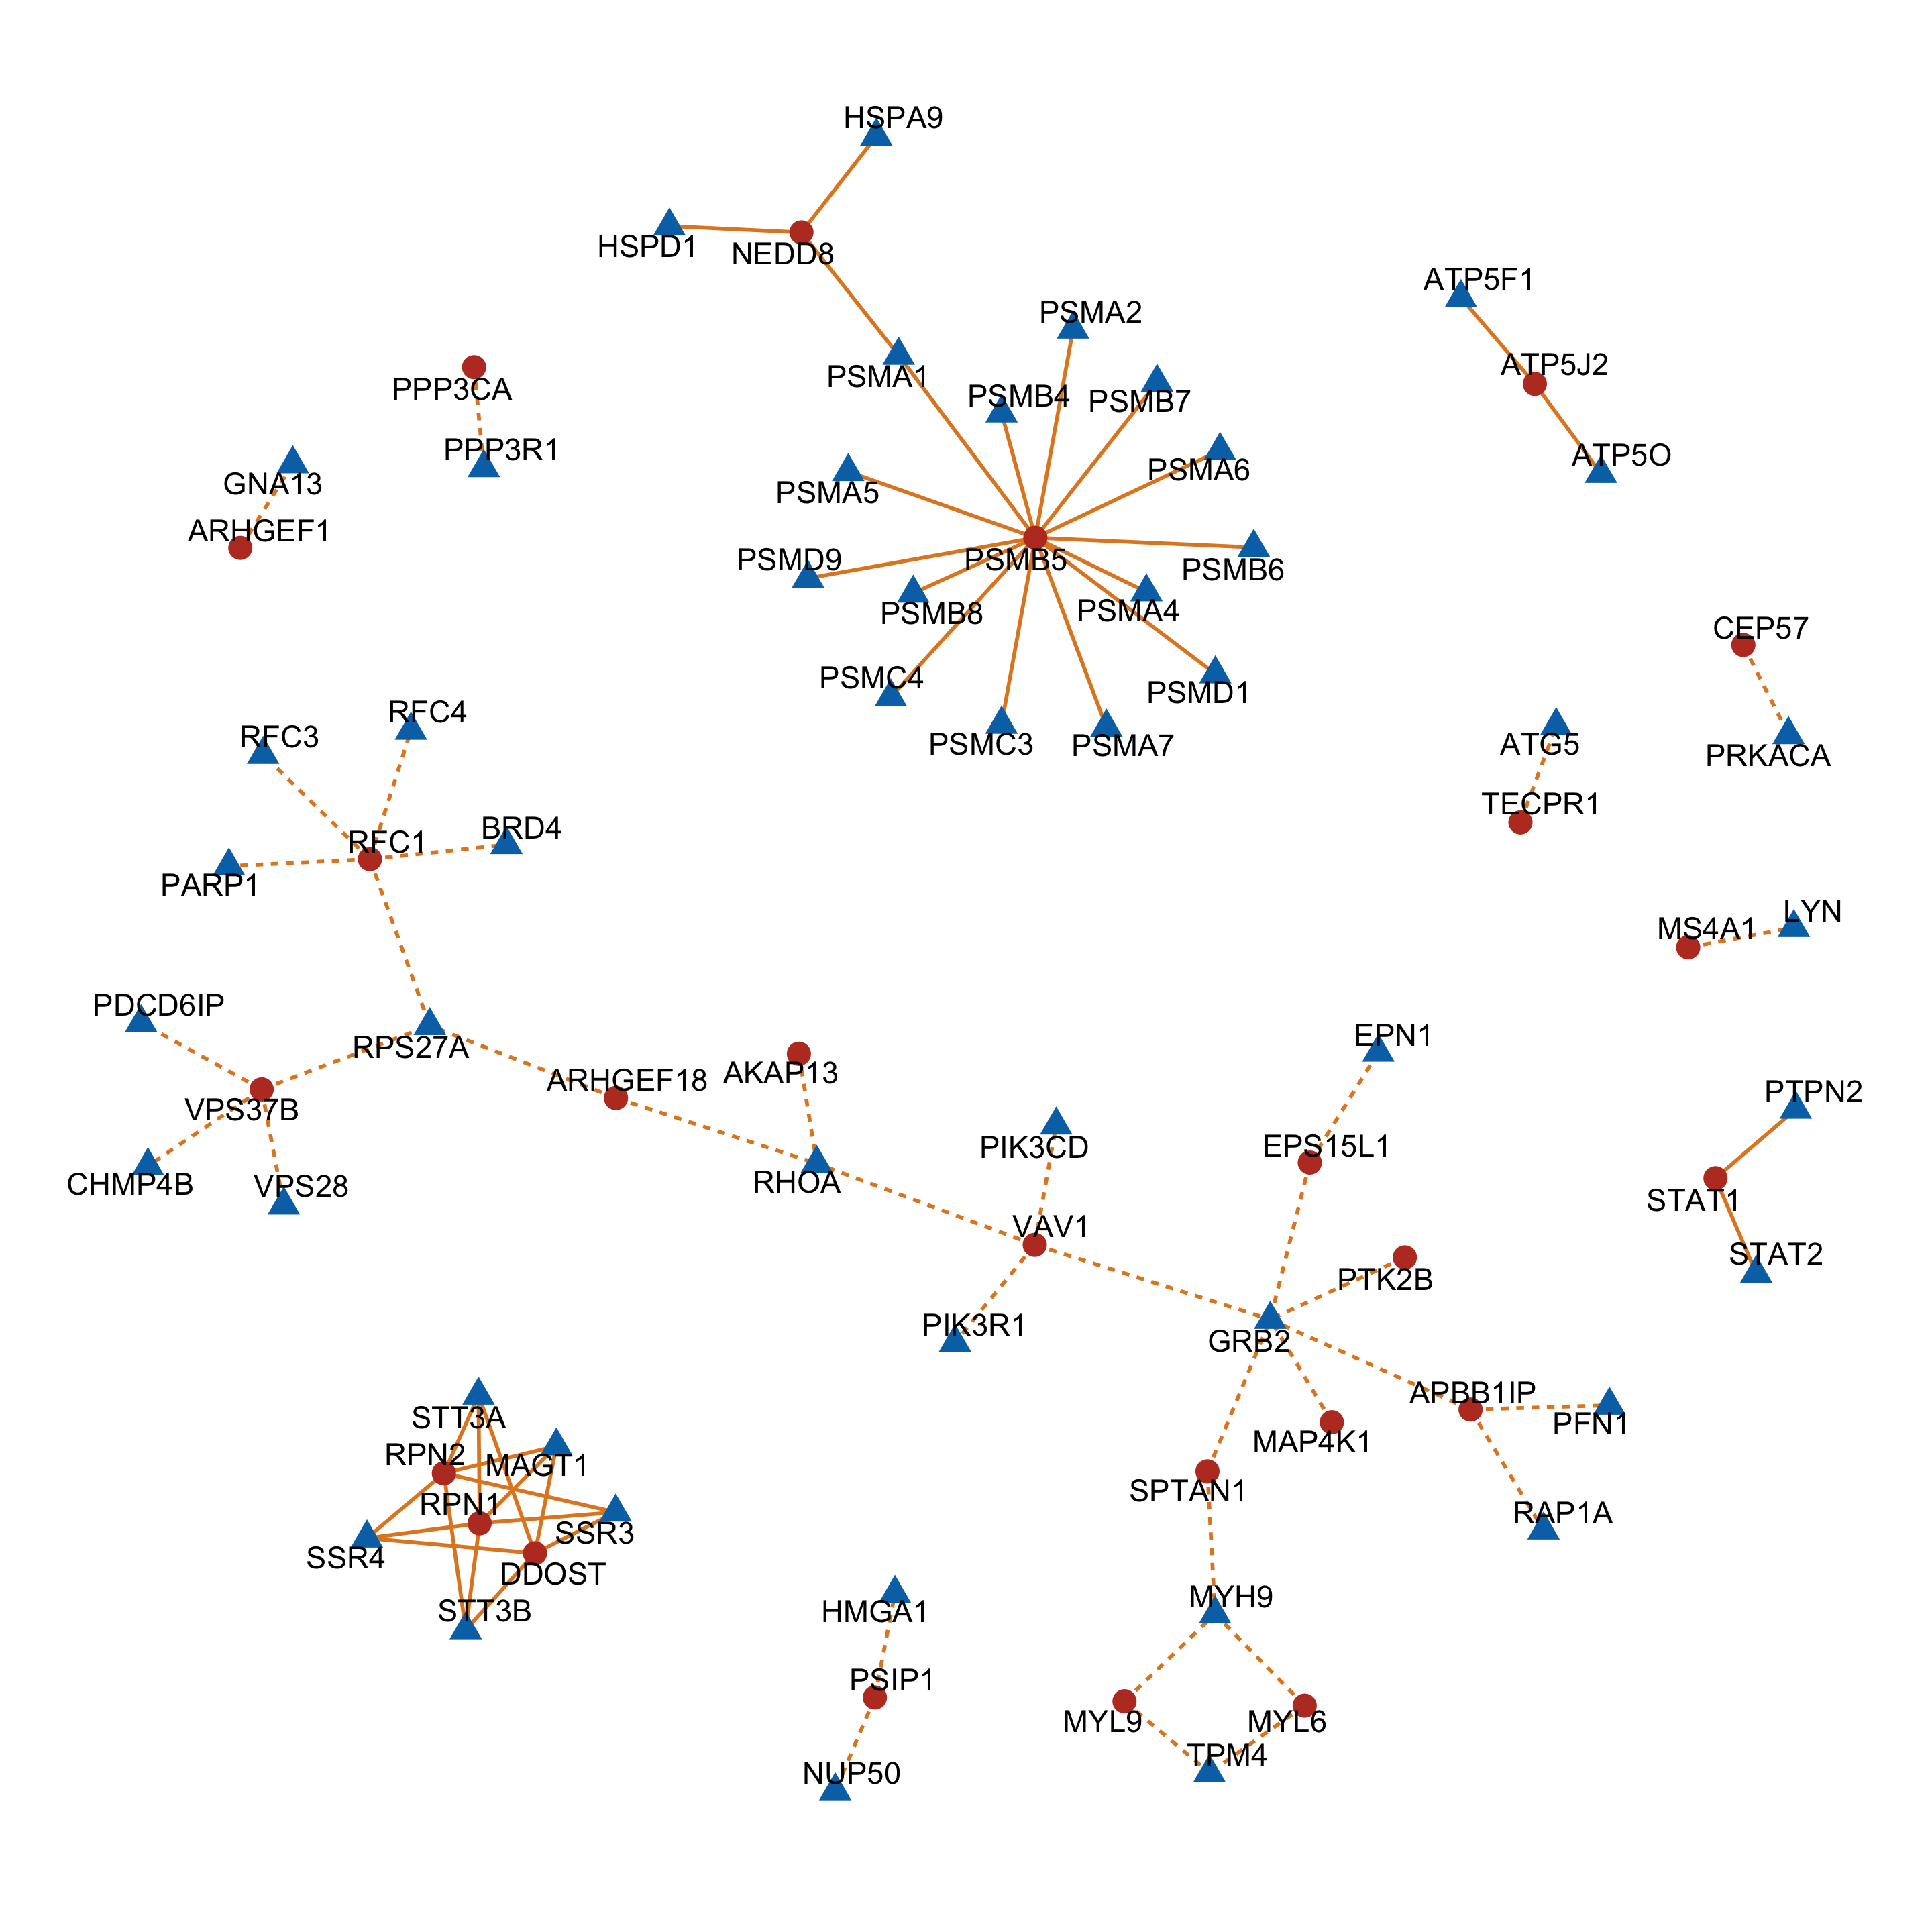
Construct protein-protein interaction network by "cause" proteins and "effect" proteins
fdrCut <- 0.1
resTab <- select(allRes, name, uniprotID, chrom, padj, padj.rna, logFC, log2FC.rna) %>%
  mutate(sigProt = padj <= fdrCut,
         sigRna = padj.rna <=fdrCut,
         upProt = logFC > 0,
         upRna = log2FC.rna >0)
comTab <- int_pairs %>% select(ProtA, ProtB, database) %>%
  left_join(resTab, by = c(ProtA = "uniprotID")) %>%
  left_join(resTab, by = c(ProtB = "uniprotID"))

comTab.filter <- comTab %>%
  filter(sigProt.x, sigProt.y, logFC.x*logFC.y >0) %>%
  mutate(direct = ifelse(logFC.x >0, "stabilizing", "destabilizing")) %>%
  mutate(source = case_when(
    sigProt.x & sigRna.x & sigProt.y & !sigRna.y ~ name.x,
    sigProt.y & sigRna.y & sigProt.x & !sigRna.x ~ name.y)) %>%
  filter(!is.na(source)) %>%
  mutate(target = ifelse(name.x == source, name.y, name.x)) %>%
  select(source, target, direct)
#get node list
allNodes <- union(comTab.filter$source, comTab.filter$target)

nodeList <- data.frame(id = seq(length(allNodes))-1, name = allNodes, stringsAsFactors = FALSE) %>%
  mutate(causal = ifelse(name %in% comTab.filter$source, "cause", "effect"))

#get edge list
edgeList <- select(comTab.filter, source, target, direct) %>%
  dplyr::rename(Source = source, Target = target) %>%
  mutate(Source = nodeList[match(Source,nodeList$name),]$id,
         Target = nodeList[match(Target, nodeList$name),]$id) %>%
  data.frame(stringsAsFactors = FALSE)

net <- graph_from_data_frame(vertices = nodeList, d=edgeList, directed = FALSE)
tidyNet <- as_tbl_graph(net)
complexNet <- ggraph(tidyNet, layout = "igraph", algorithm = "nicely") +
  geom_edge_link(aes(linetype = direct),color = colList[3], width=1) +
  geom_node_point(aes(color =causal, shape = causal), size=6) +
  geom_node_text(aes(label = name), repel = TRUE, size=6) +
  scale_color_manual(values = c(cause = colList[1],effect = colList[2])) +
  scale_linetype_manual(values = c(stabilizing = "solid", destabilizing = "dashed"))+
  scale_edge_color_brewer(palette = "Set2") +
  theme_graph(base_family = "sans") + theme(legend.position = "none")
complexNet
Proteins associated with methylation clusters
Identify proteins associated with methylation clusters
Process proteomics data
protMat <- assays(protCLL)[["count"]] #without imputation
Get methylation cluster information
designMat <- data.frame(row.names = colnames(protMat),
                        Mclust = factor(patMeta[match(colnames(protMat),patMeta$Patient.ID),]$Methylation_Cluster,
                                        levels = c("LP","IP","HP")))
designMat <- designMat[!is.na(designMat$Mclust),,drop=FALSE]
protMat <- protMat[,rownames(designMat)]
How many sample have methylation cluster information
nrow(designMat)
[1] 44
Numbers of samples in each cluster
table(designMat$Mclust)
LP IP HP
21  8 15
Fit the probailistic dropout model
fit <- proDA(protMat, design = designMat$Mclust)
Proteins differentially expressed between HP and LP group
resTab <- test_diff(fit, HP - LP) %>%
  dplyr::rename(id = name, logFC = diff, t=t_statistic,
                  P.Value = pval, adj.P.Val = adj_pval) %>%
    mutate(name = rowData(protCLL[id,])$hgnc_symbol) %>%
    select(name, id, logFC, t, P.Value, adj.P.Val) %>%
    arrange(P.Value) %>%
    as_tibble()
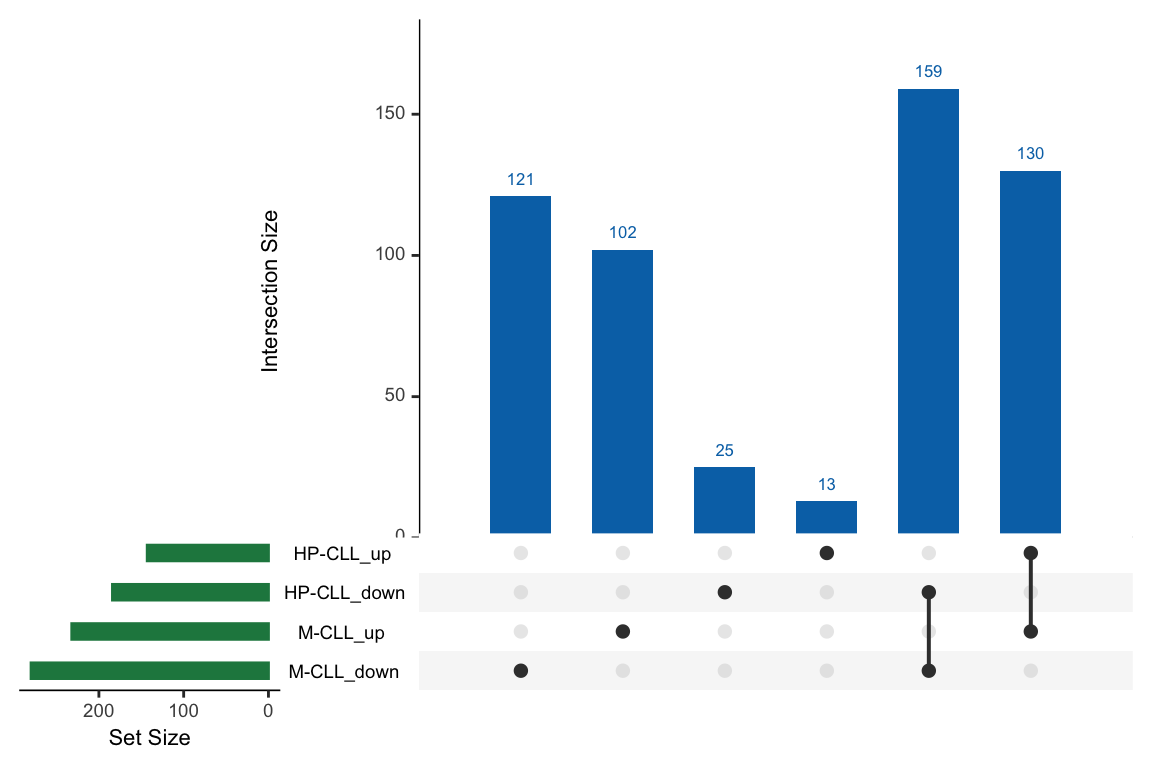
Compare with proteins associated with IGHV status
comList <- list()
comList[["M-CLL_up"]] <- filter(resList, Gene == "IGHV.status", logFC>0,adj.P.Val < 0.1)$name
comList[["M-CLL_down"]] <- filter(resList, Gene == "IGHV.status", logFC<0,adj.P.Val < 0.1)$name
comList[["HP-CLL_up"]] <- filter(resTab,logFC > 0,adj.P.Val < 0.1)$name
comList[["HP-CLL_down"]] <- filter(resTab,logFC < 0,adj.P.Val < 0.1)$name

UpSetR::upset(UpSetR::fromList(comList), main.bar.color = colList[2], sets.bar.color = colList[4])
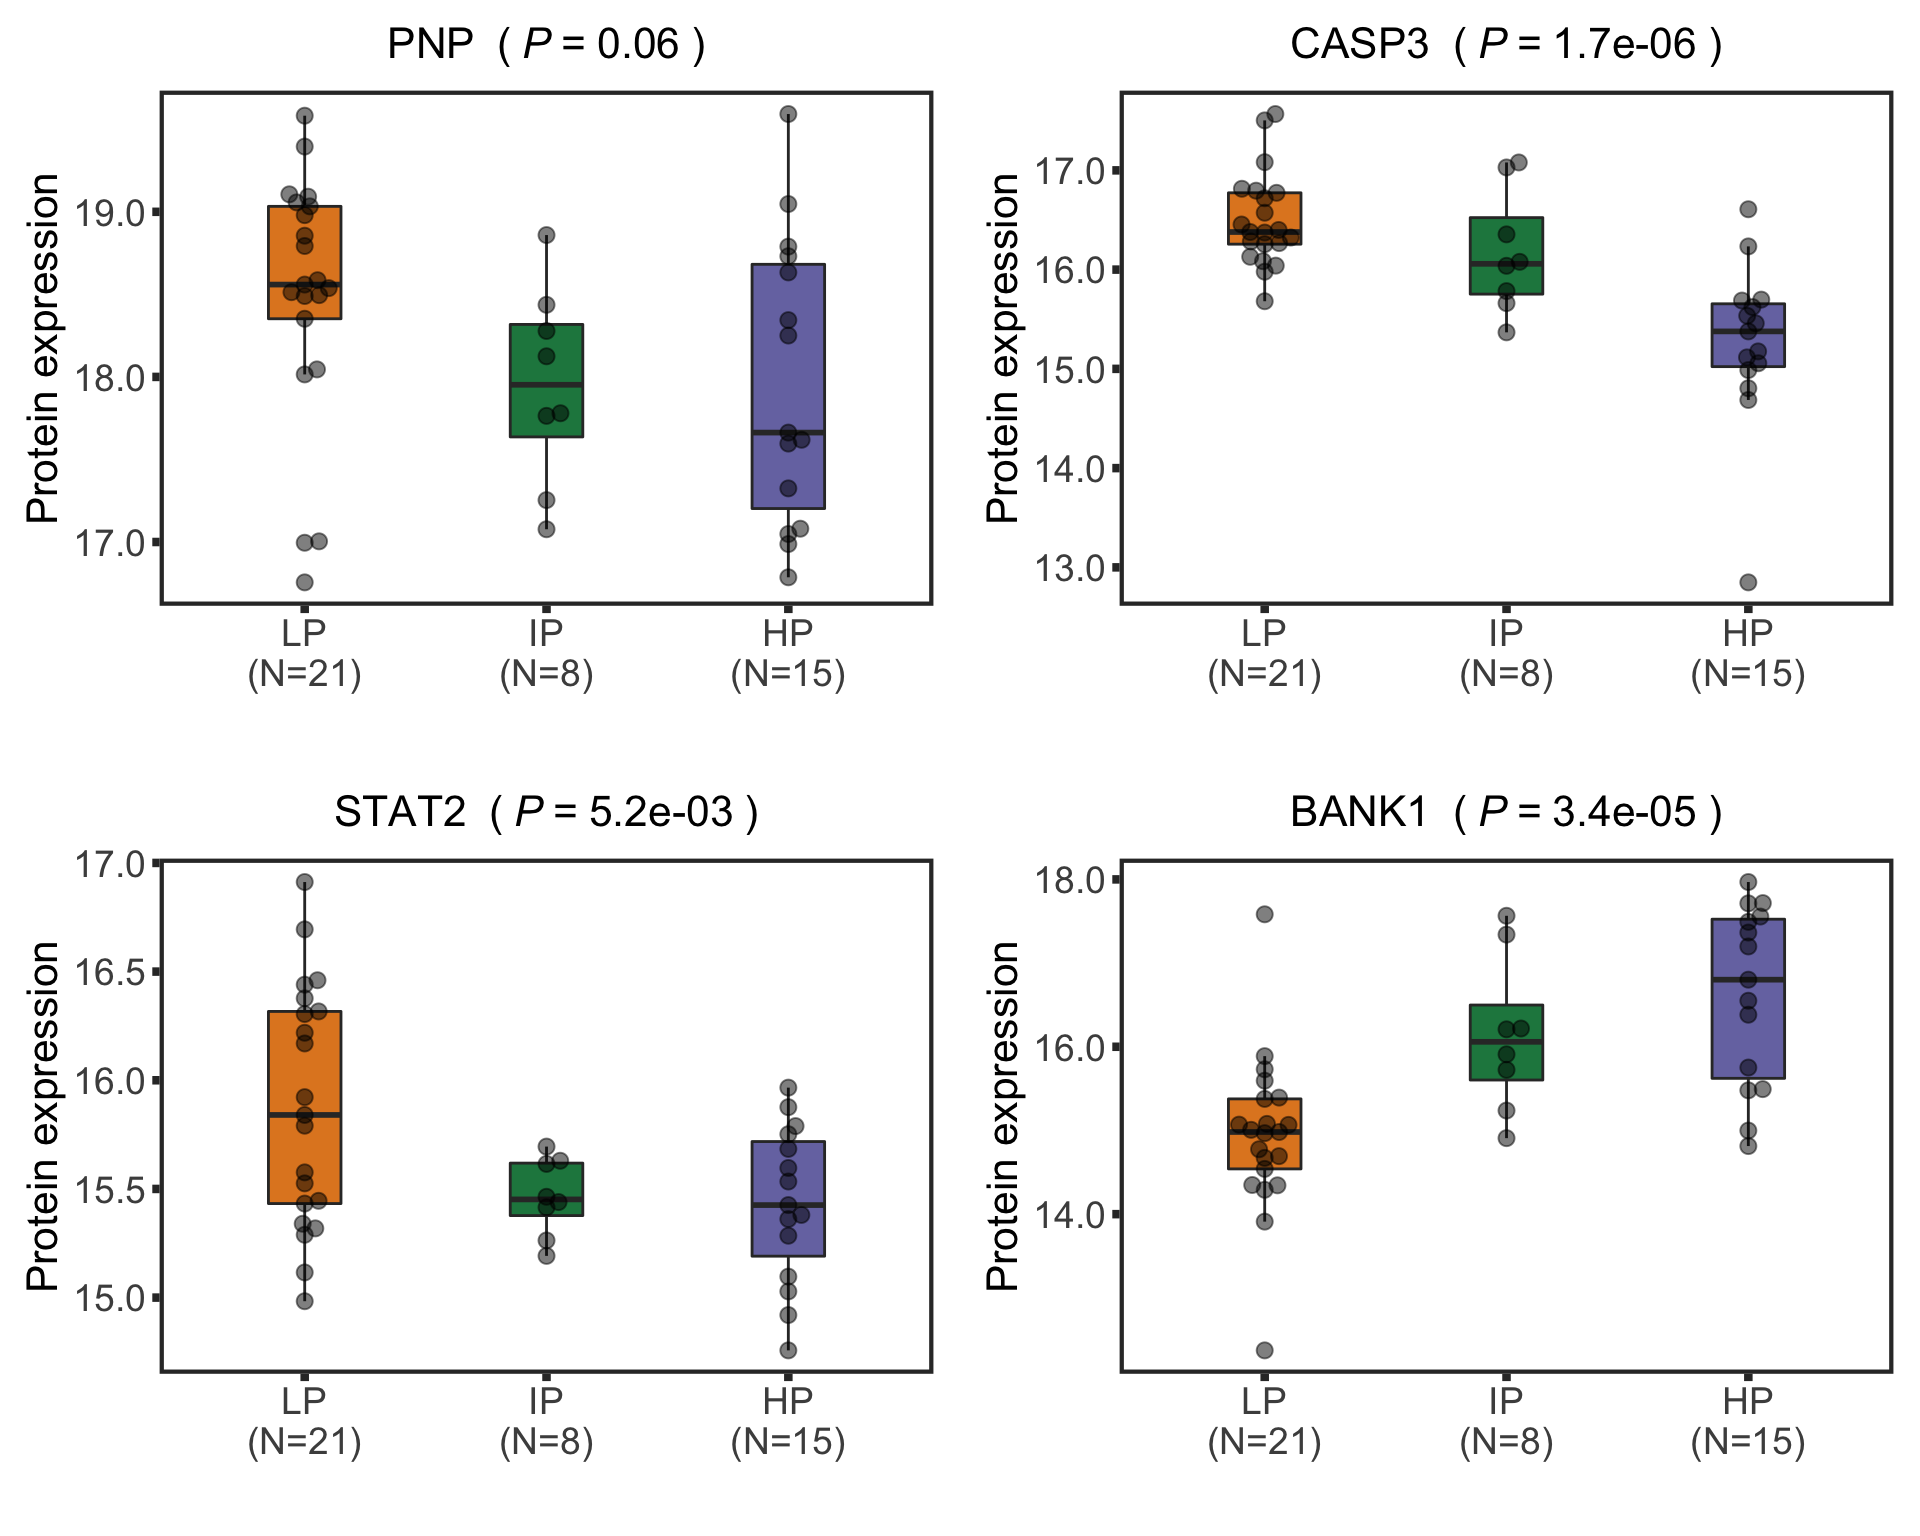
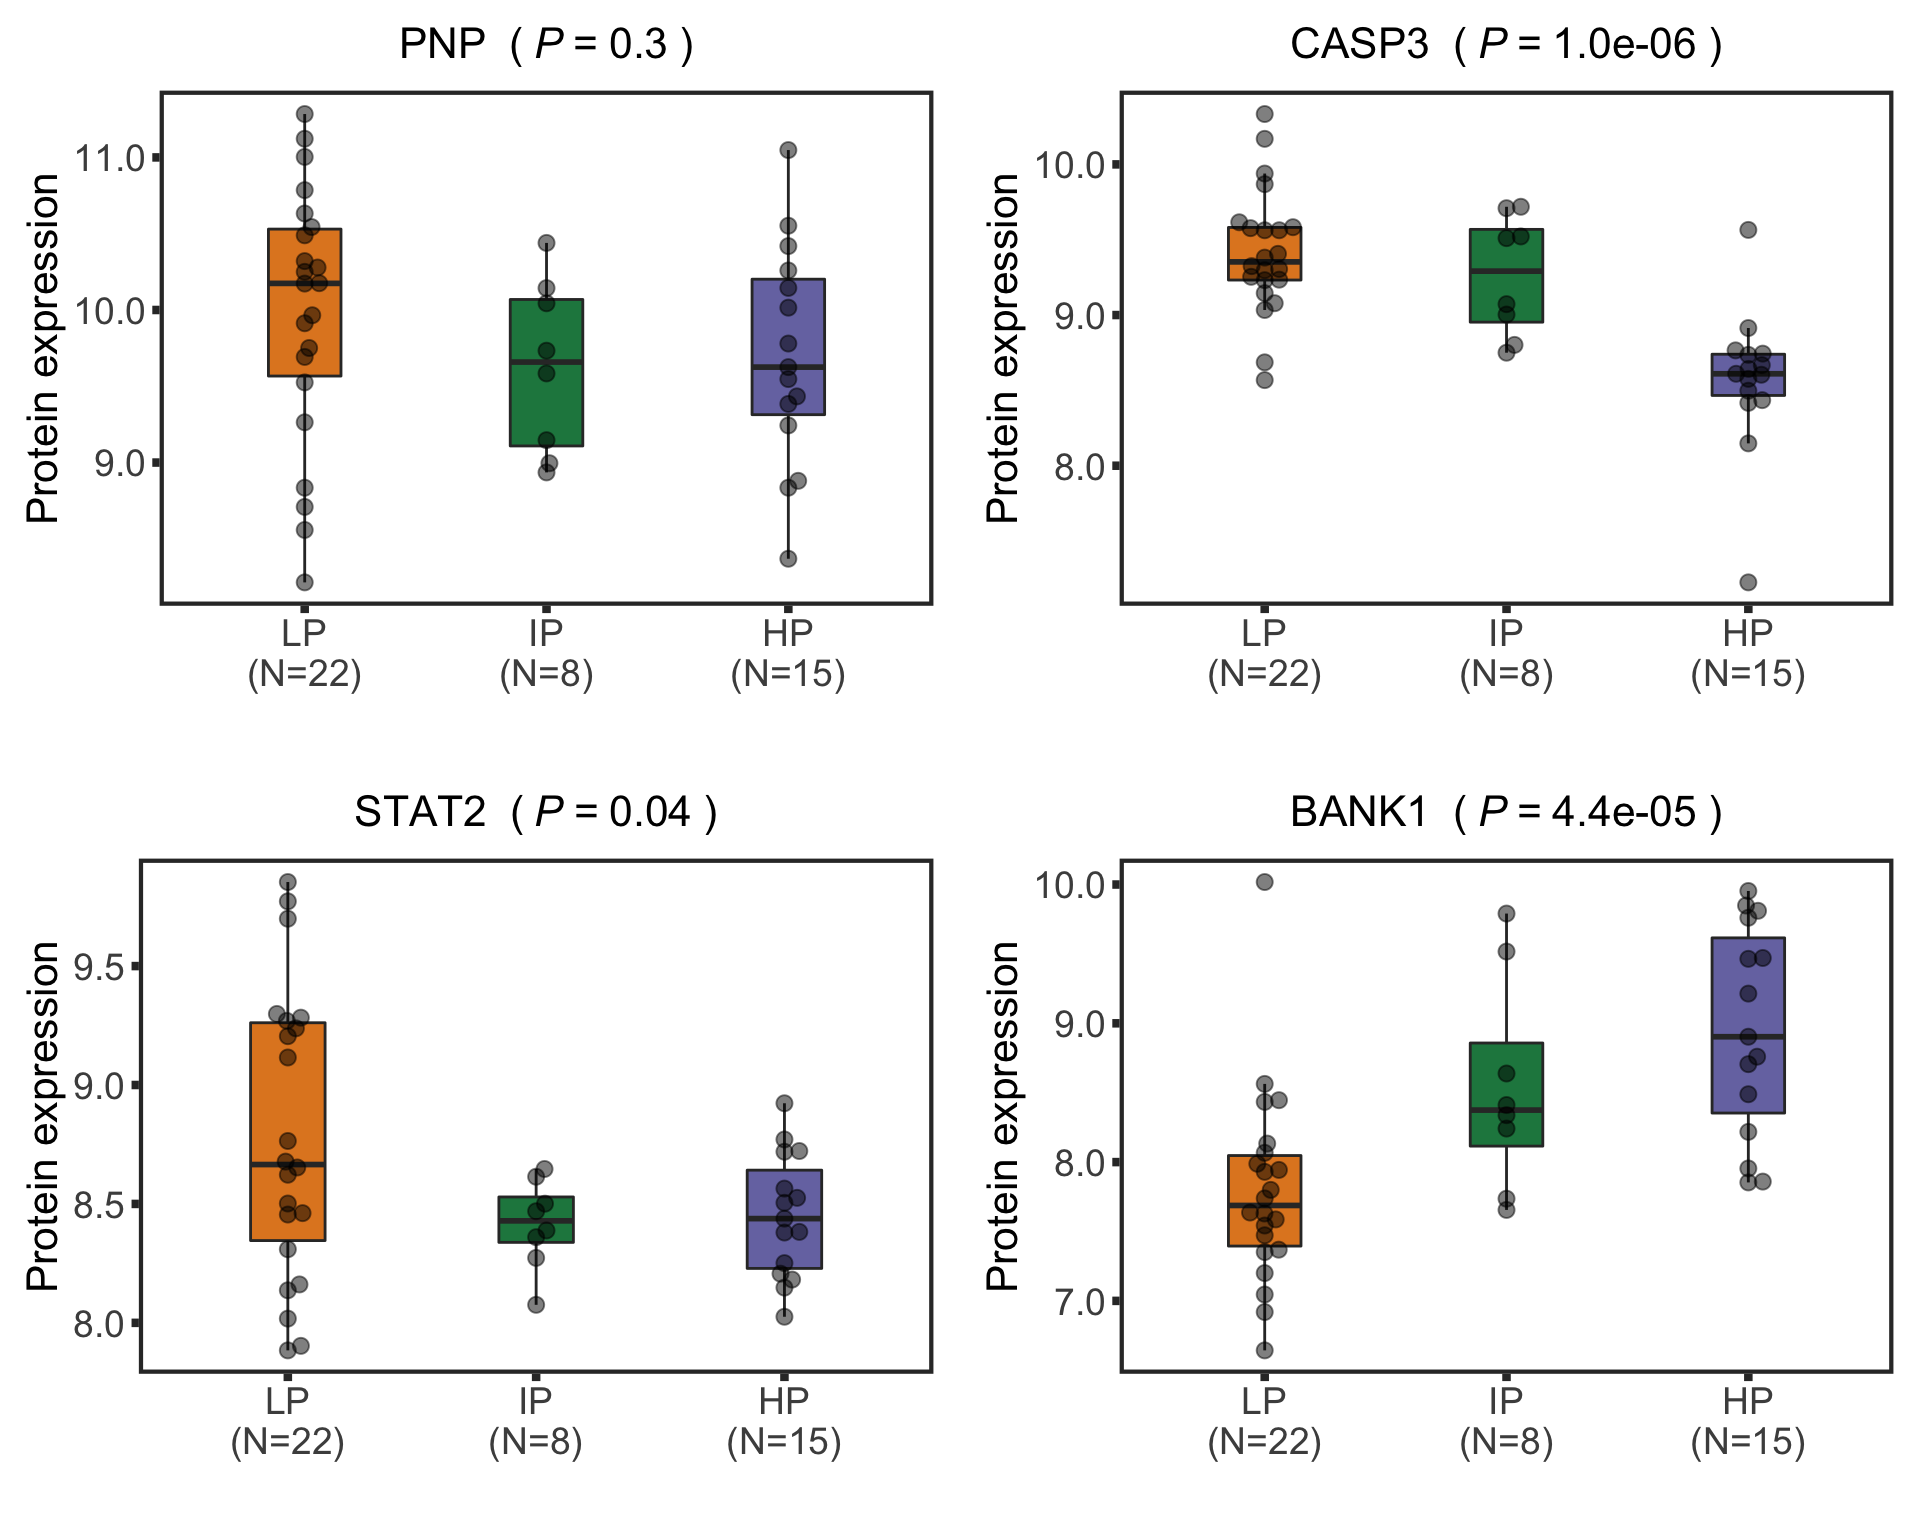
Boxplots of example proteins
protTab <- sumToTidy(protCLL, rowID = "uniprotID", colID = "patID")
plotTab <- protTab %>% filter(hgnc_symbol %in% nameList) %>%
  mutate(status = patMeta[match(patID, patMeta$Patient.ID),]$Methylation_Cluster,
         name = hgnc_symbol) %>%
  mutate(status = factor(status, levels = c("LP","IP","HP")))
pList <- plotBox(plotTab, pValTabel = resTab, y_lab = "Protein expression")
cowplot::plot_grid(plotlist= pList, ncol=2)
IP-specific proteins
resTab <- test_diff(fit, IP - (HP + LP)/2) %>%
  dplyr::rename(id = name, logFC = diff, t=t_statistic,
                  P.Value = pval, adj.P.Val = adj_pval) %>%
    mutate(name = rowData(protCLL[id,])$hgnc_symbol) %>%
    select(name, id, logFC, t, P.Value, adj.P.Val) %>%
    arrange(P.Value) %>%
    as_tibble()
resTab.sig <- filter(resTab,adj.P.Val < 0.1)
How many cases show IP specific changes at 10% FDR?
nrow(resTab.sig)
[1] 6
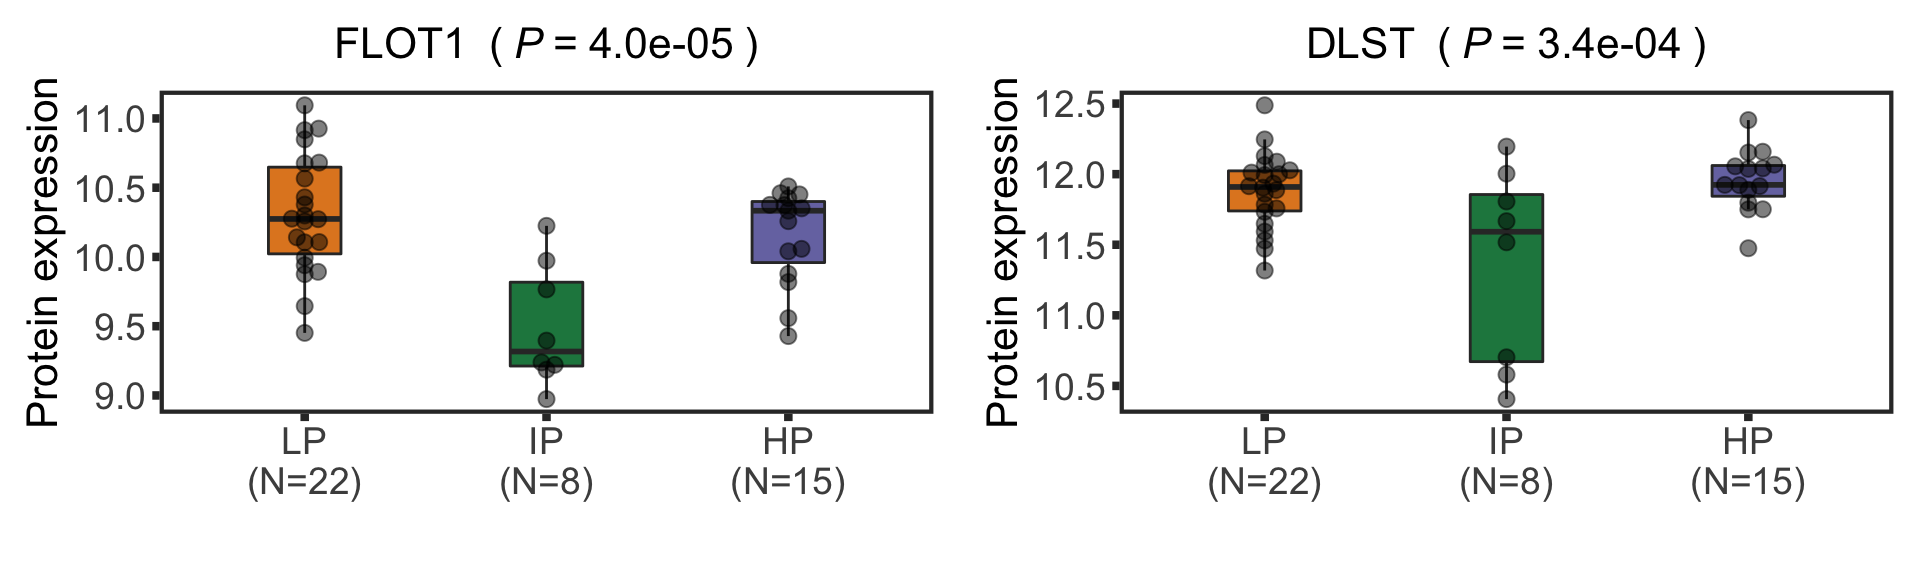
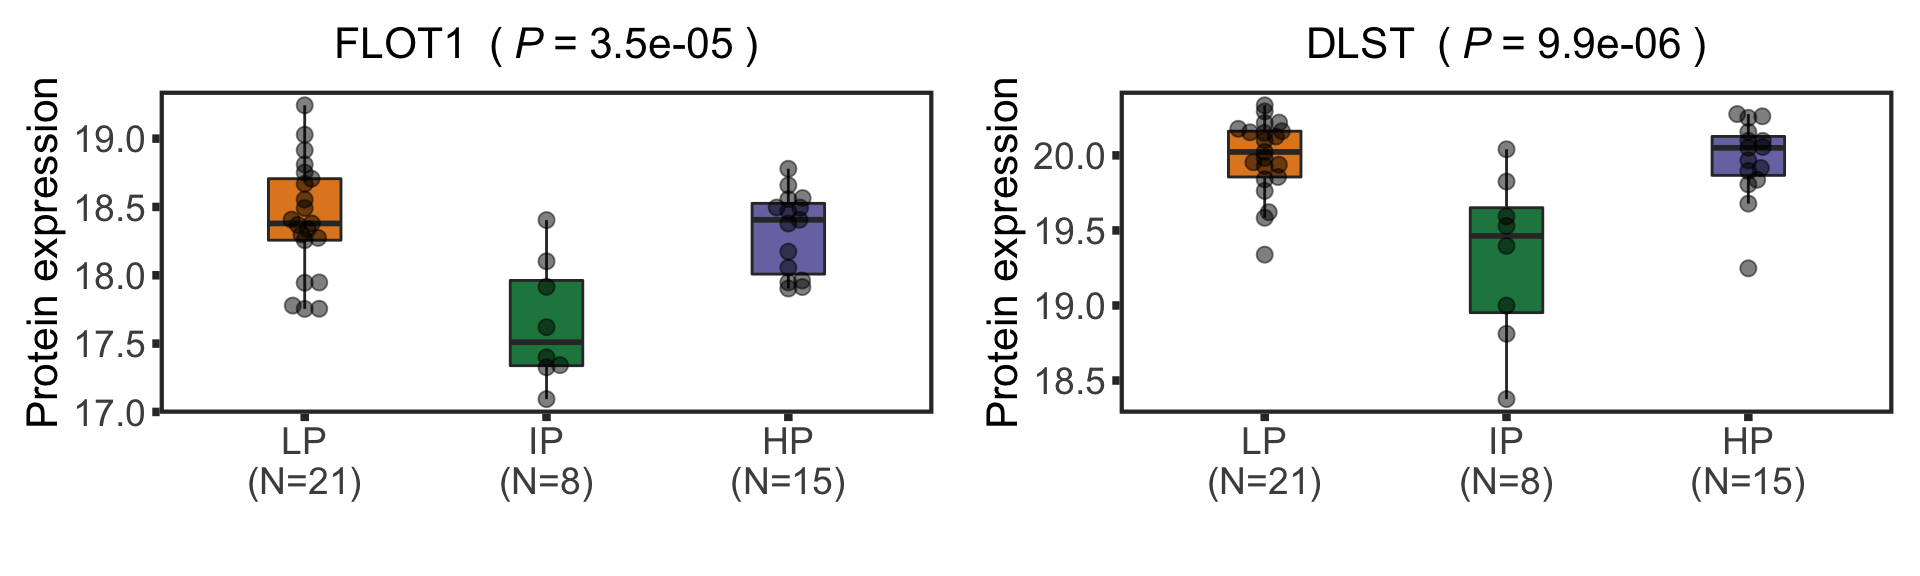
Boxplots of IP-specific proteins
seleProts <- c("FLOT1", "DLST")
protTab <- sumToTidy(protCLL, rowID = "uniprotID", colID = "patID")
plotTab <- protTab %>% filter(hgnc_symbol %in% seleProts) %>%
  mutate(status = patMeta[match(patID, patMeta$Patient.ID),]$Methylation_Cluster,
         name = hgnc_symbol) %>%
  mutate(status = factor(status, levels = c("LP","IP","HP")))
pList <- plotBox(plotTab, pValTabel = resTab, y_lab = "Protein expression")
methBox <- cowplot::plot_grid(plotlist= pList, ncol=2)
methBox
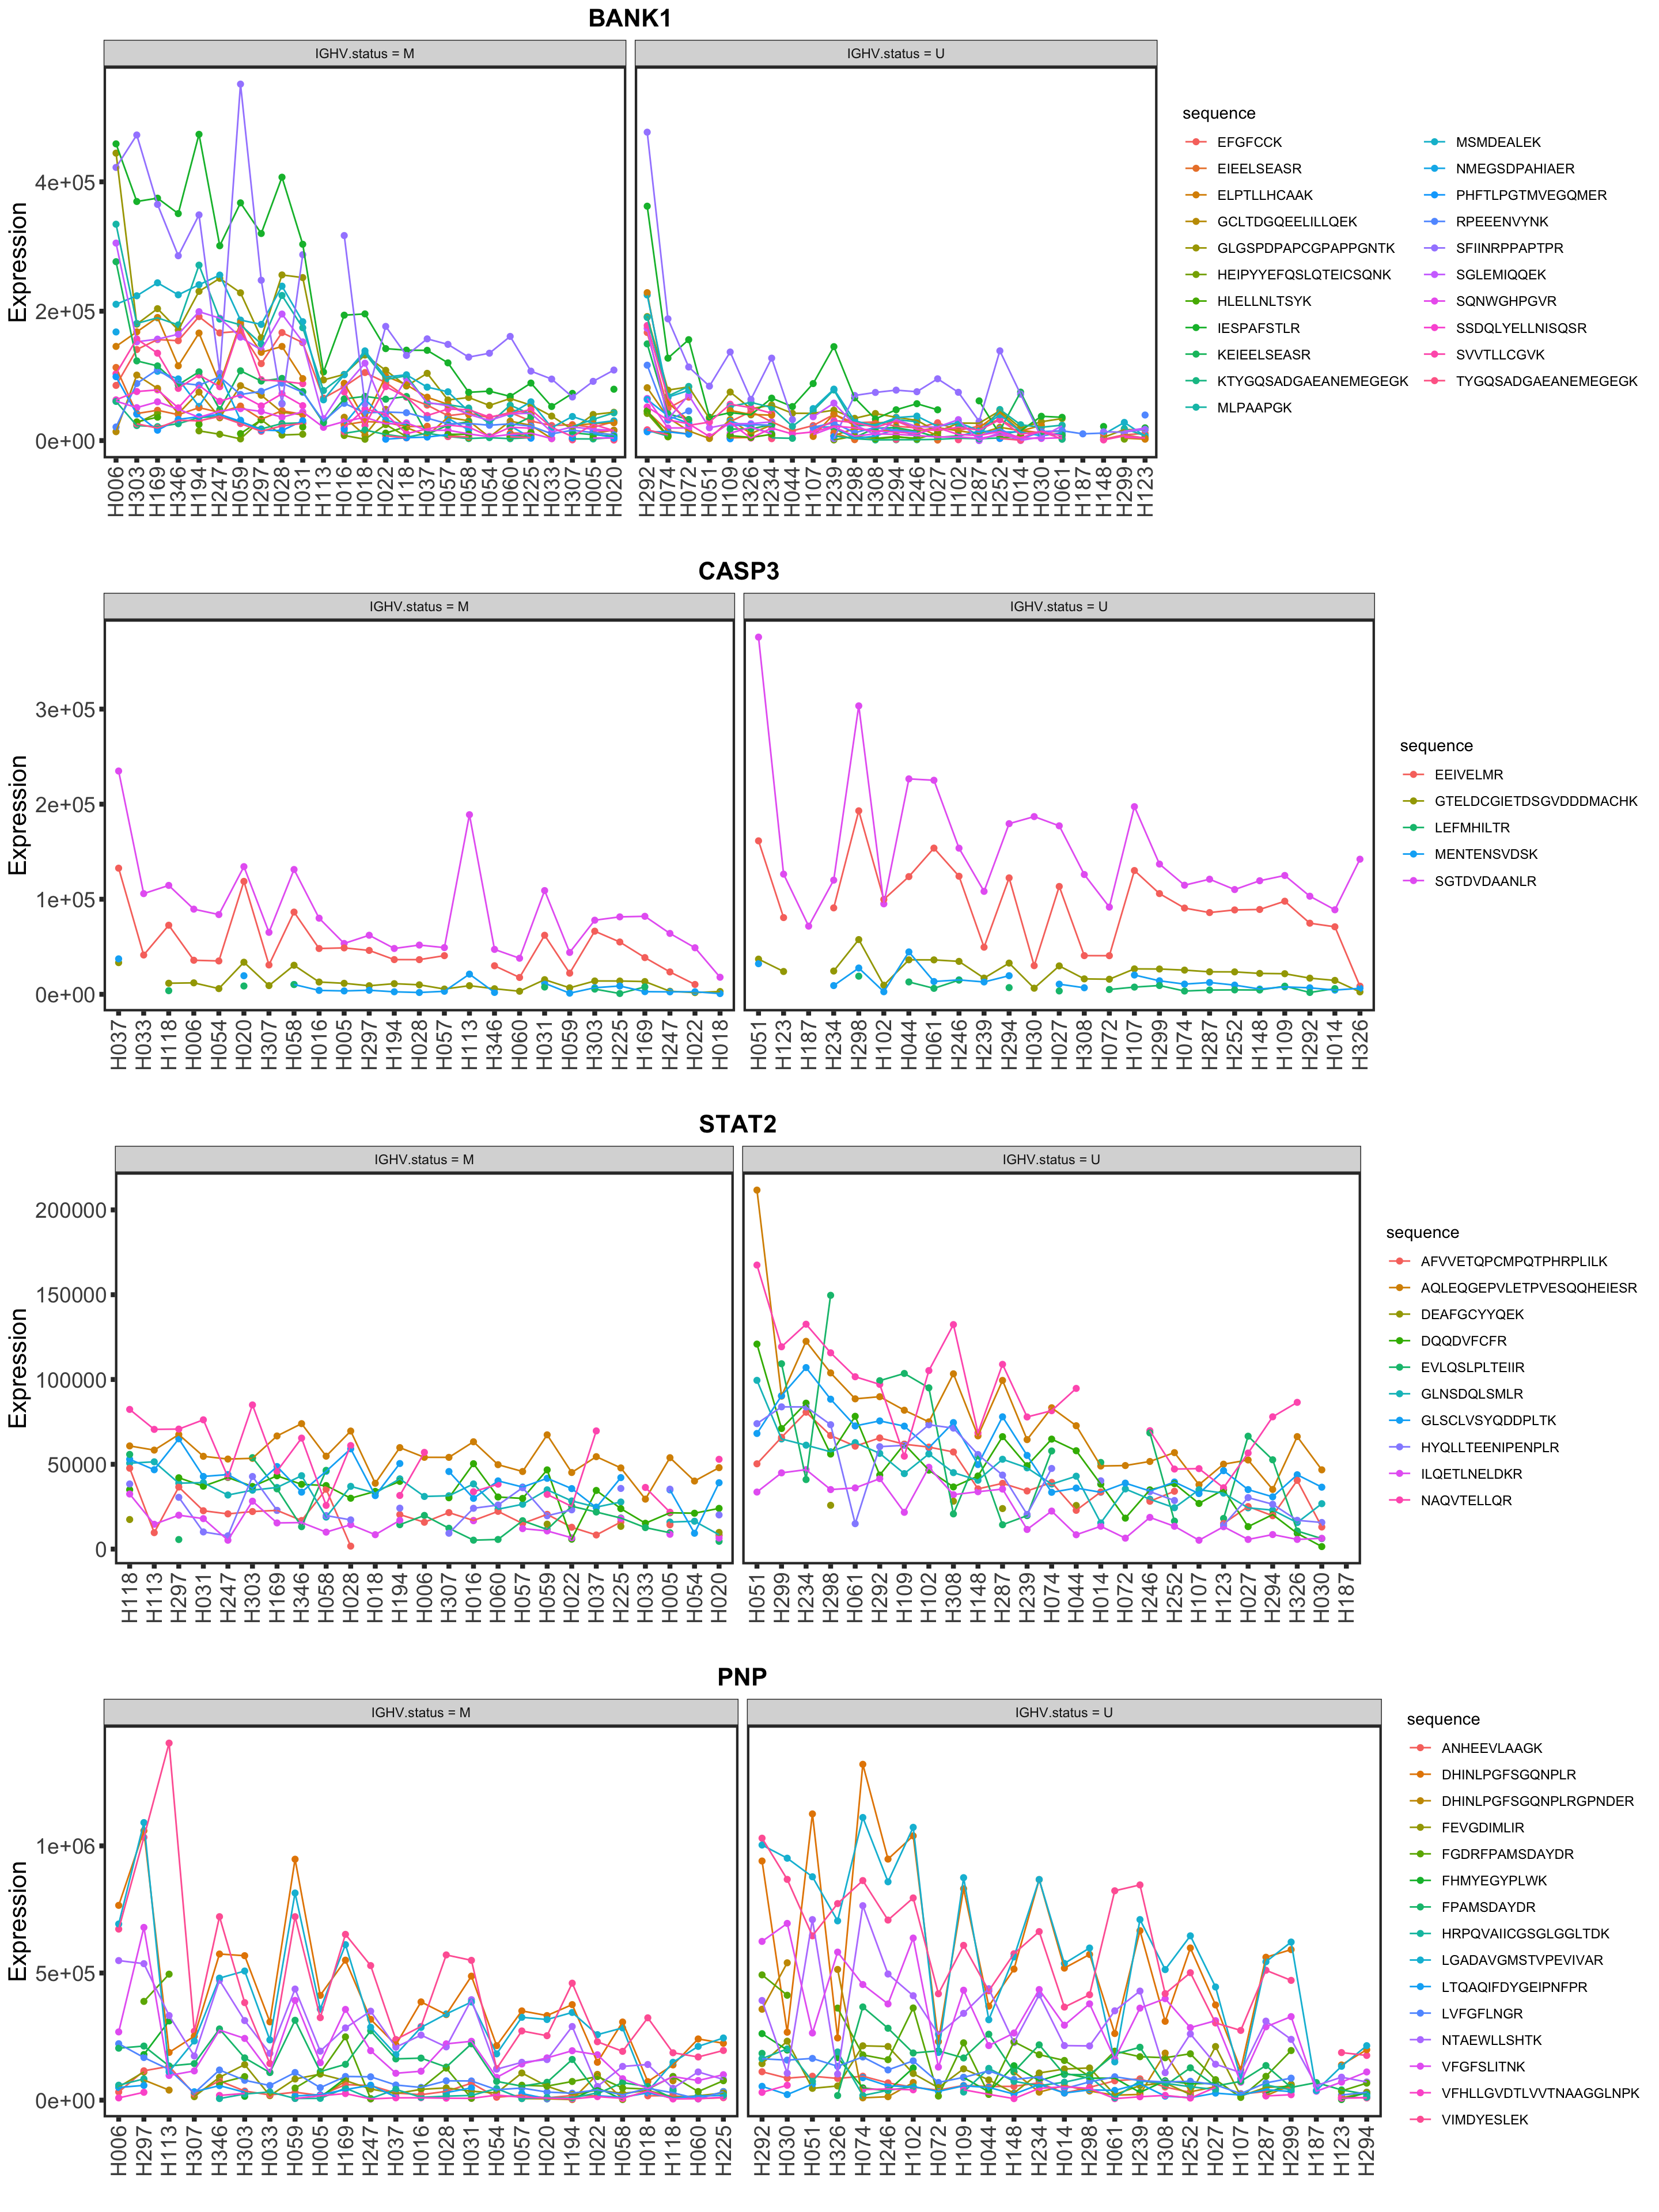
Validation on peptide level
load("../output/pepCLL_lumos_enc.RData")
stratifier <- "IGHV.status"
plotList <- lapply(nameList, function(n) {
 mutStatus <- as.character(patMeta[match(colnames(pepCLL), patMeta$Patient.ID),][[stratifier]])
 names(mutStatus) <- colnames(pepCLL)
 plotPep(pepCLL, n, type = "count", stratifier = stratifier, mutStatus = mutStatus)
})
cowplot::plot_grid(plotlist = plotList, ncol=1)
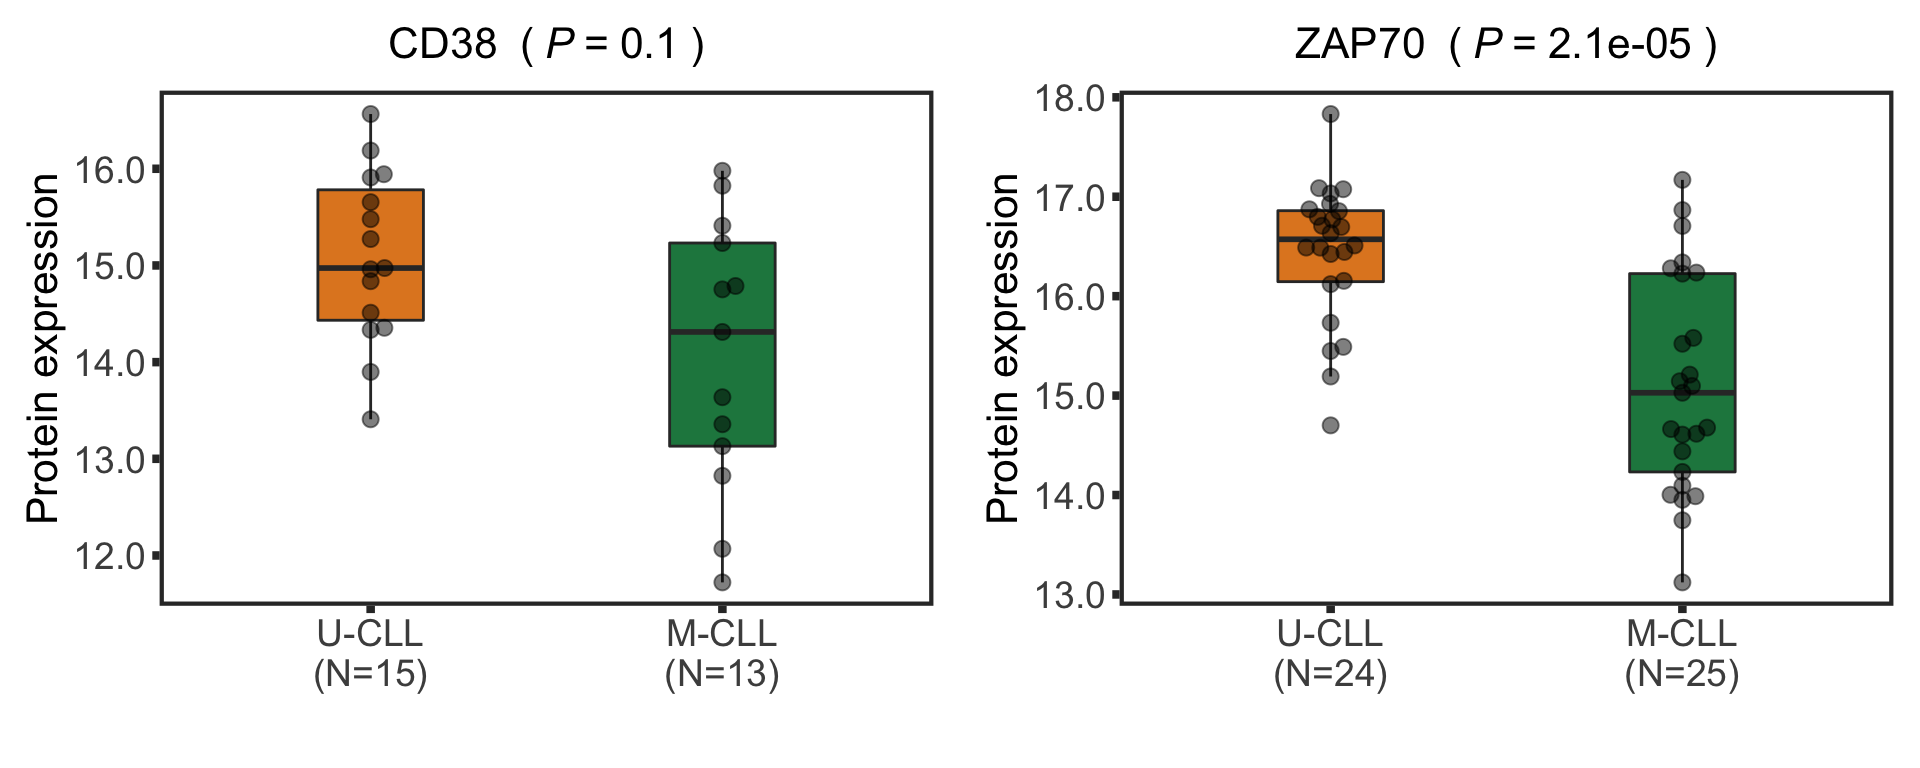
Validation using timsTOF data
IGHV status
Load timsTOF data
load("../output/proteomic_timsTOF_enc.RData")
load("../output/deResList_timsTOF.RData")
resList <- filter(resList, Gene == "IGHV.status") %>%
  mutate(adj.P.Val = adj.P.IHW) %>% #use IHW corrected P-value
  mutate(Chr = rowData(protCLL[id,])$chromosome_name)
protTab <- sumToTidy(protCLL, rowID = "uniprotID", colID = "patID")
plotTab <- protTab %>% filter(hgnc_symbol %in% nameList) %>%
  mutate(IGHV = patMeta[match(patID, patMeta$Patient.ID),]$IGHV.status) %>%
  mutate(status = ifelse(IGHV %in% "M","M-CLL","U-CLL"),
         name = hgnc_symbol) %>%
  mutate(status = factor(status, levels = c("U-CLL","M-CLL")))
pList <- plotBox(plotTab, pValTabel = resList)
cowplot::plot_grid(plotlist= pList, ncol=2)
Methylation cluster
Process proteomics data
protMat <- assays(protCLL)[["count"]] #without imputation
Get methylation cluster information
designMat <- data.frame(row.names = colnames(protMat),
                        Mclust = factor(patMeta[match(colnames(protMat),patMeta$Patient.ID),]$Methylation_Cluster,
                                        levels = c("LP","IP","HP")))
designMat <- designMat[!is.na(designMat$Mclust),,drop=FALSE]
protMat <- protMat[,rownames(designMat)]
Fit the probailistic dropout model
fit <- proDA(protMat, design = designMat$Mclust)
Proteins differentially expressed between HP and LP group
resTab <- test_diff(fit, HP - LP) %>%
  dplyr::rename(id = name, logFC = diff, t=t_statistic,
                  P.Value = pval, adj.P.Val = adj_pval) %>%
    mutate(name = rowData(protCLL[id,])$hgnc_symbol) %>%
    select(name, id, logFC, t, P.Value, adj.P.Val) %>%
    arrange(P.Value) %>%
    as_tibble()
Boxplots of example proteins
protTab <- sumToTidy(protCLL, rowID = "uniprotID", colID = "patID")
plotTab <- protTab %>% filter(hgnc_symbol %in% nameList) %>%
  mutate(status = patMeta[match(patID, patMeta$Patient.ID),]$Methylation_Cluster,
         name = hgnc_symbol) %>%
  mutate(status = factor(status, levels = c("LP","IP","HP")))
pList <- plotBox(plotTab, pValTabel = resTab, y_lab = "Protein expression")
cowplot::plot_grid(plotlist= pList, ncol=2)
IP-specific proteins
resTab <- test_diff(fit, IP - (HP + LP)/2) %>%
  dplyr::rename(id = name, logFC = diff, t=t_statistic,
                  P.Value = pval, adj.P.Val = adj_pval) %>%
    mutate(name = rowData(protCLL[id,])$hgnc_symbol) %>%
    select(name, id, logFC, t, P.Value, adj.P.Val) %>%
    arrange(P.Value) %>%
    as_tibble()
resTab.sig <- filter(resTab,adj.P.Val < 0.1)
Boxplots of IP-specific proteins
seleProts <- c("FLOT1", "DLST")
protTab <- sumToTidy(protCLL, rowID = "uniprotID", colID = "patID")
plotTab <- protTab %>% filter(hgnc_symbol %in% seleProts) %>%
  mutate(status = patMeta[match(patID, patMeta$Patient.ID),]$Methylation_Cluster,
         name = hgnc_symbol) %>%
  mutate(status = factor(status, levels = c("LP","IP","HP")))
pList <- plotBox(plotTab, pValTabel = resTab, y_lab = "Protein expression")
methBox <- cowplot::plot_grid(plotlist= pList, ncol=2)
methBox