Overview of differentially expressed proteins
A table of associations with 10% FDR
resList <- filter(resList, Gene == "del11q") %>%
  mutate(adj.P.Val = adj.P.IHW) %>% #use IHW corrected P-value
  mutate(Chr = rowData(protCLL[id,])$chromosome_name)
resList %>% filter(adj.P.Val <= 0.1) %>%
  select(name, Chr,logFC, P.Value, adj.P.Val) %>%
  mutate_if(is.numeric, formatC, digits=2) %>%
  DT::datatable()
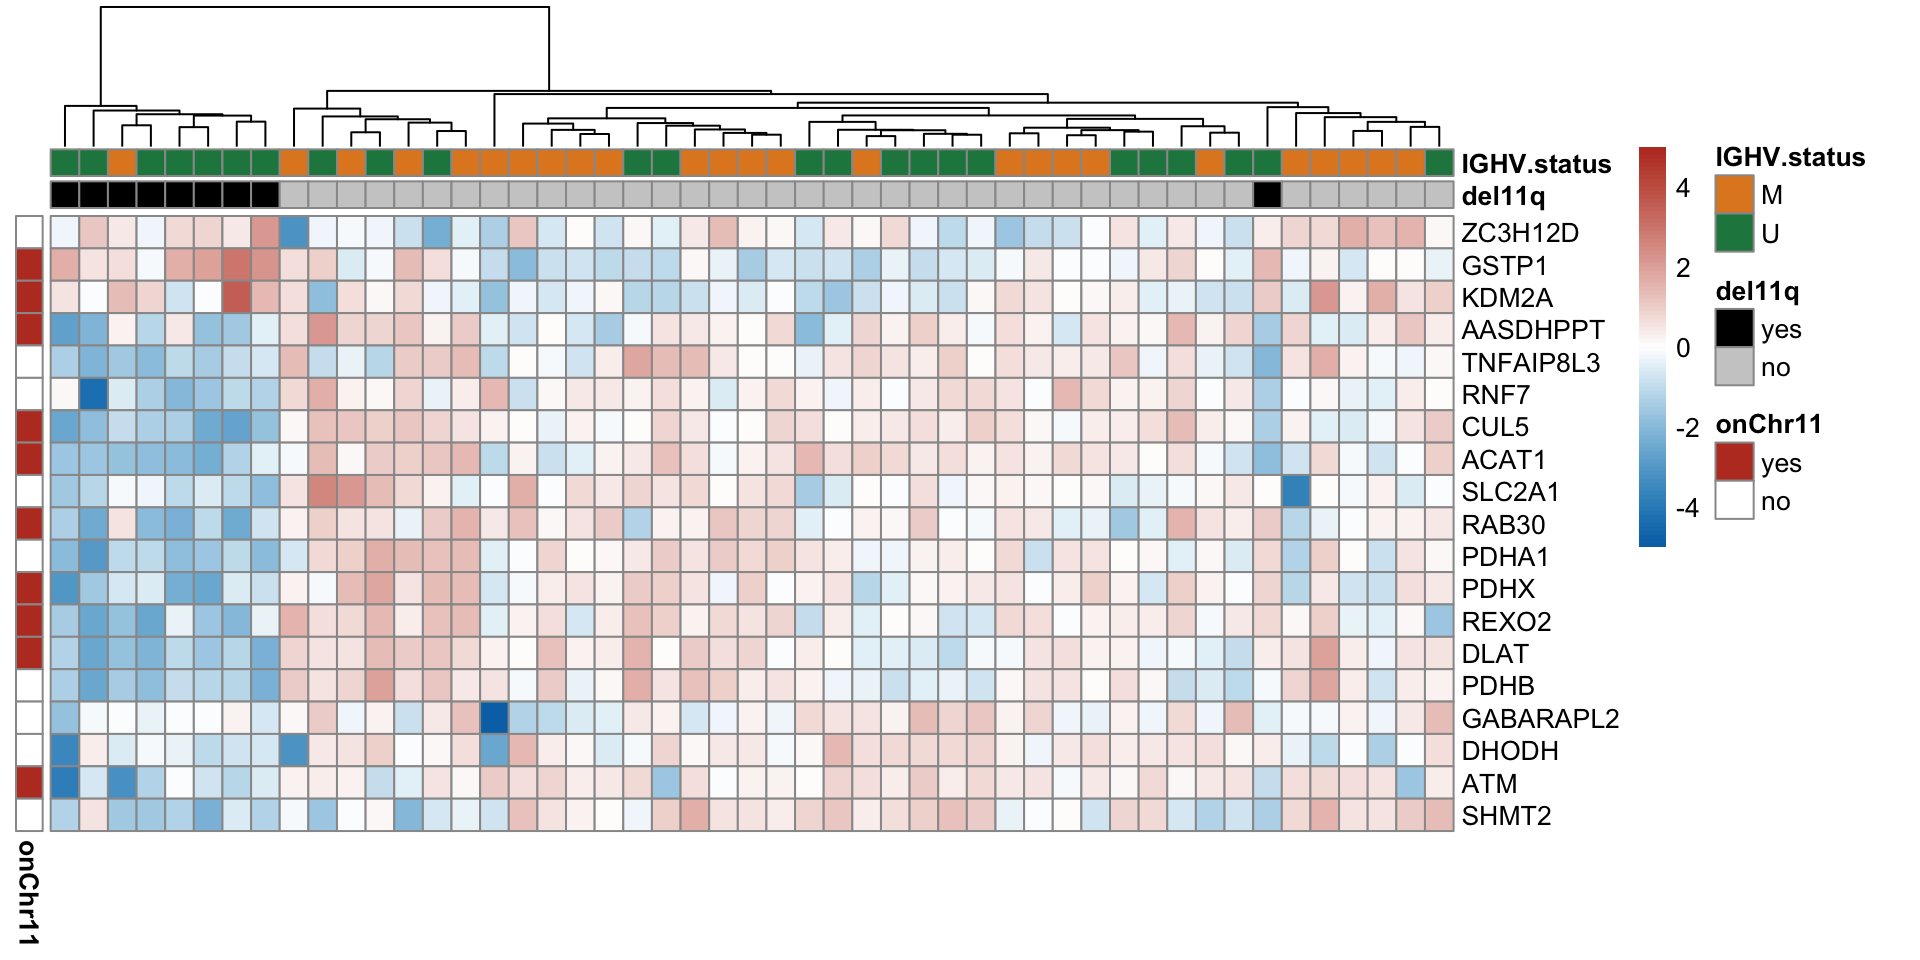
Heatmap of differentially expressed proteins (10% FDR)
proList <- filter(resList, !is.na(name), adj.P.Val < 0.1) %>% distinct(name, .keep_all = TRUE) %>% pull(id)
plotMat <- assays(protCLL)[["QRILC"]][proList,]
rownames(plotMat) <- rowData(protCLL[proList,])$hgnc_symbol

colAnno <- filter(patMeta, Patient.ID %in% colnames(protCLL)) %>%
  select(Patient.ID, del11q, IGHV.status) %>%
  data.frame() %>% column_to_rownames("Patient.ID")
colAnno$del11q <- ifelse(colAnno$del11q %in% 1, "yes","no")

rowAnno <- rowData(protCLL)[proList,c("chromosome_name","hgnc_symbol"),drop=FALSE] %>%
  data.frame(stringsAsFactors = FALSE) %>%
  mutate(onChr11 = ifelse(chromosome_name == "11","yes","no")) %>%
  select(hgnc_symbol, onChr11) %>% data.frame() %>% column_to_rownames("hgnc_symbol")

plotMat <- jyluMisc::mscale(plotMat, censor = 5)

annoCol <- list(del11q = c(yes = "black",no = "grey80"),
                IGHV.status = c(M = colList[3], U = colList[4]),
                onChr11 = c(yes = colList[1],no = "white"))

pheatmap::pheatmap(plotMat, annotation_col = colAnno, scale = "none",
                   annotation_row = rowAnno,
                   clustering_method = "ward.D2",
                   color = colorRampPalette(c(colList[2],"white",colList[1]))(100),
                   breaks = seq(-5,5, length.out = 101), annotation_colors = annoCol,
                   show_rownames = TRUE, show_colnames = FALSE,
                   treeheight_row = 0)
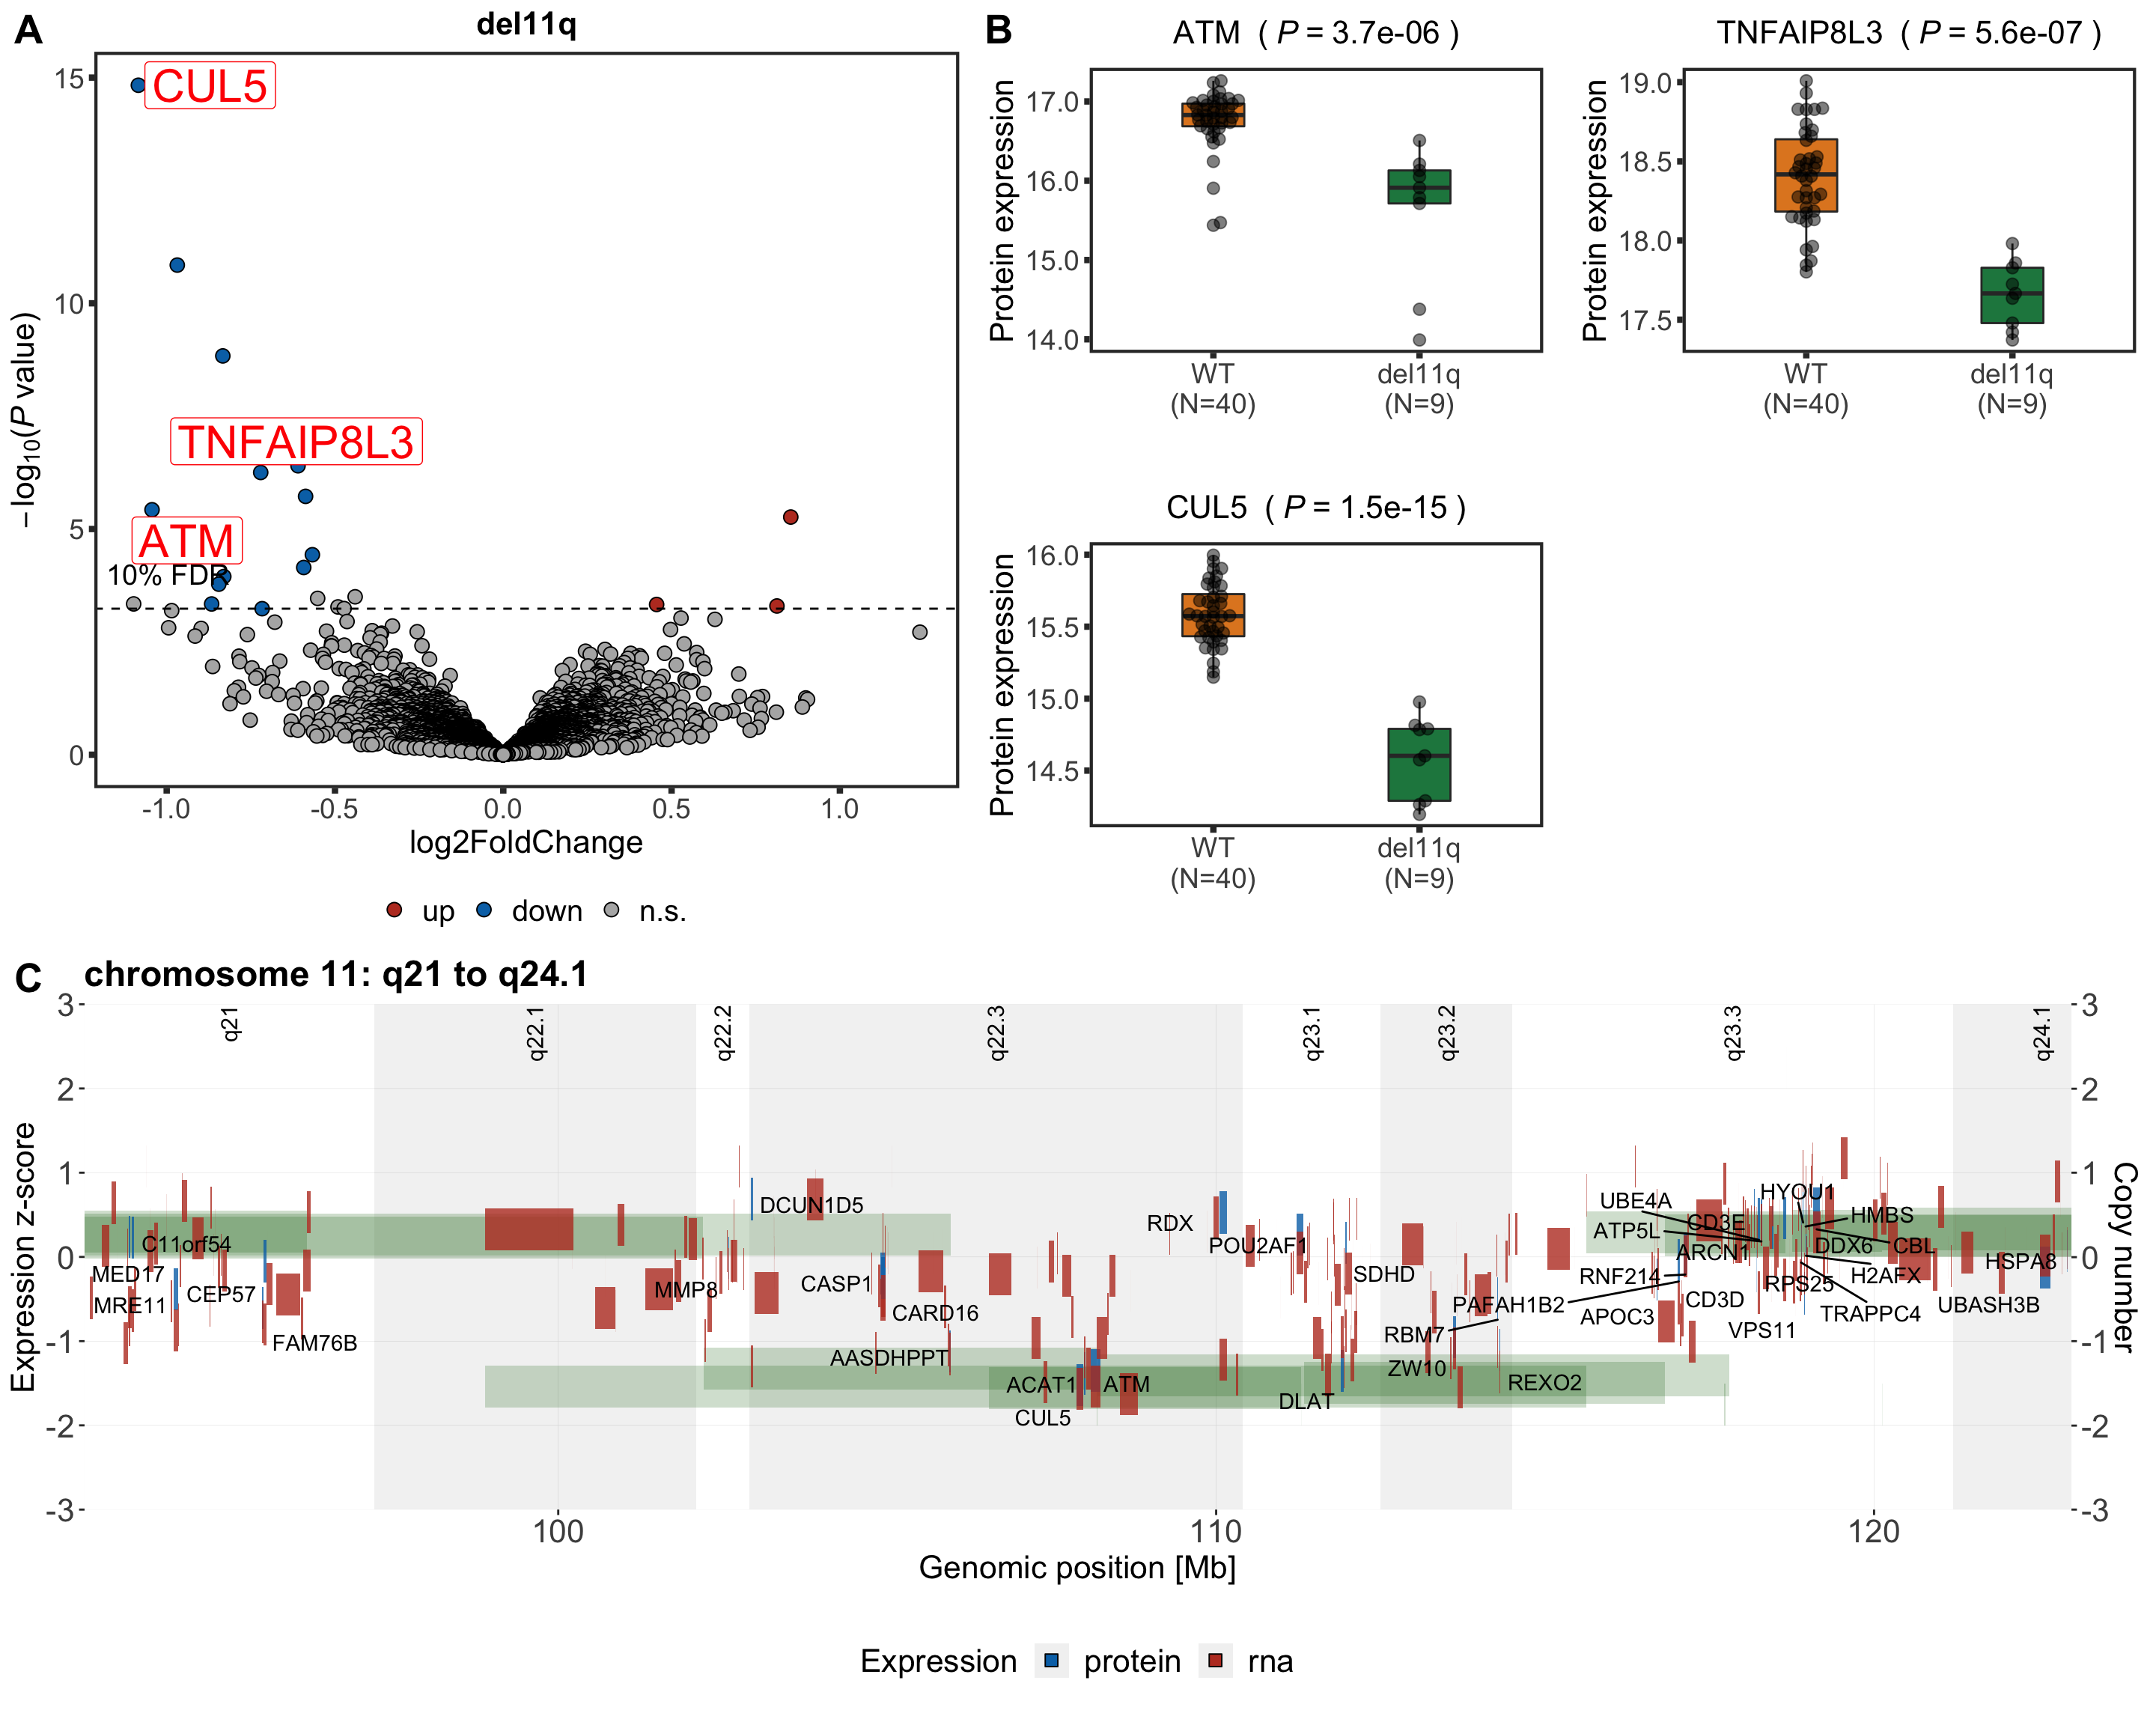
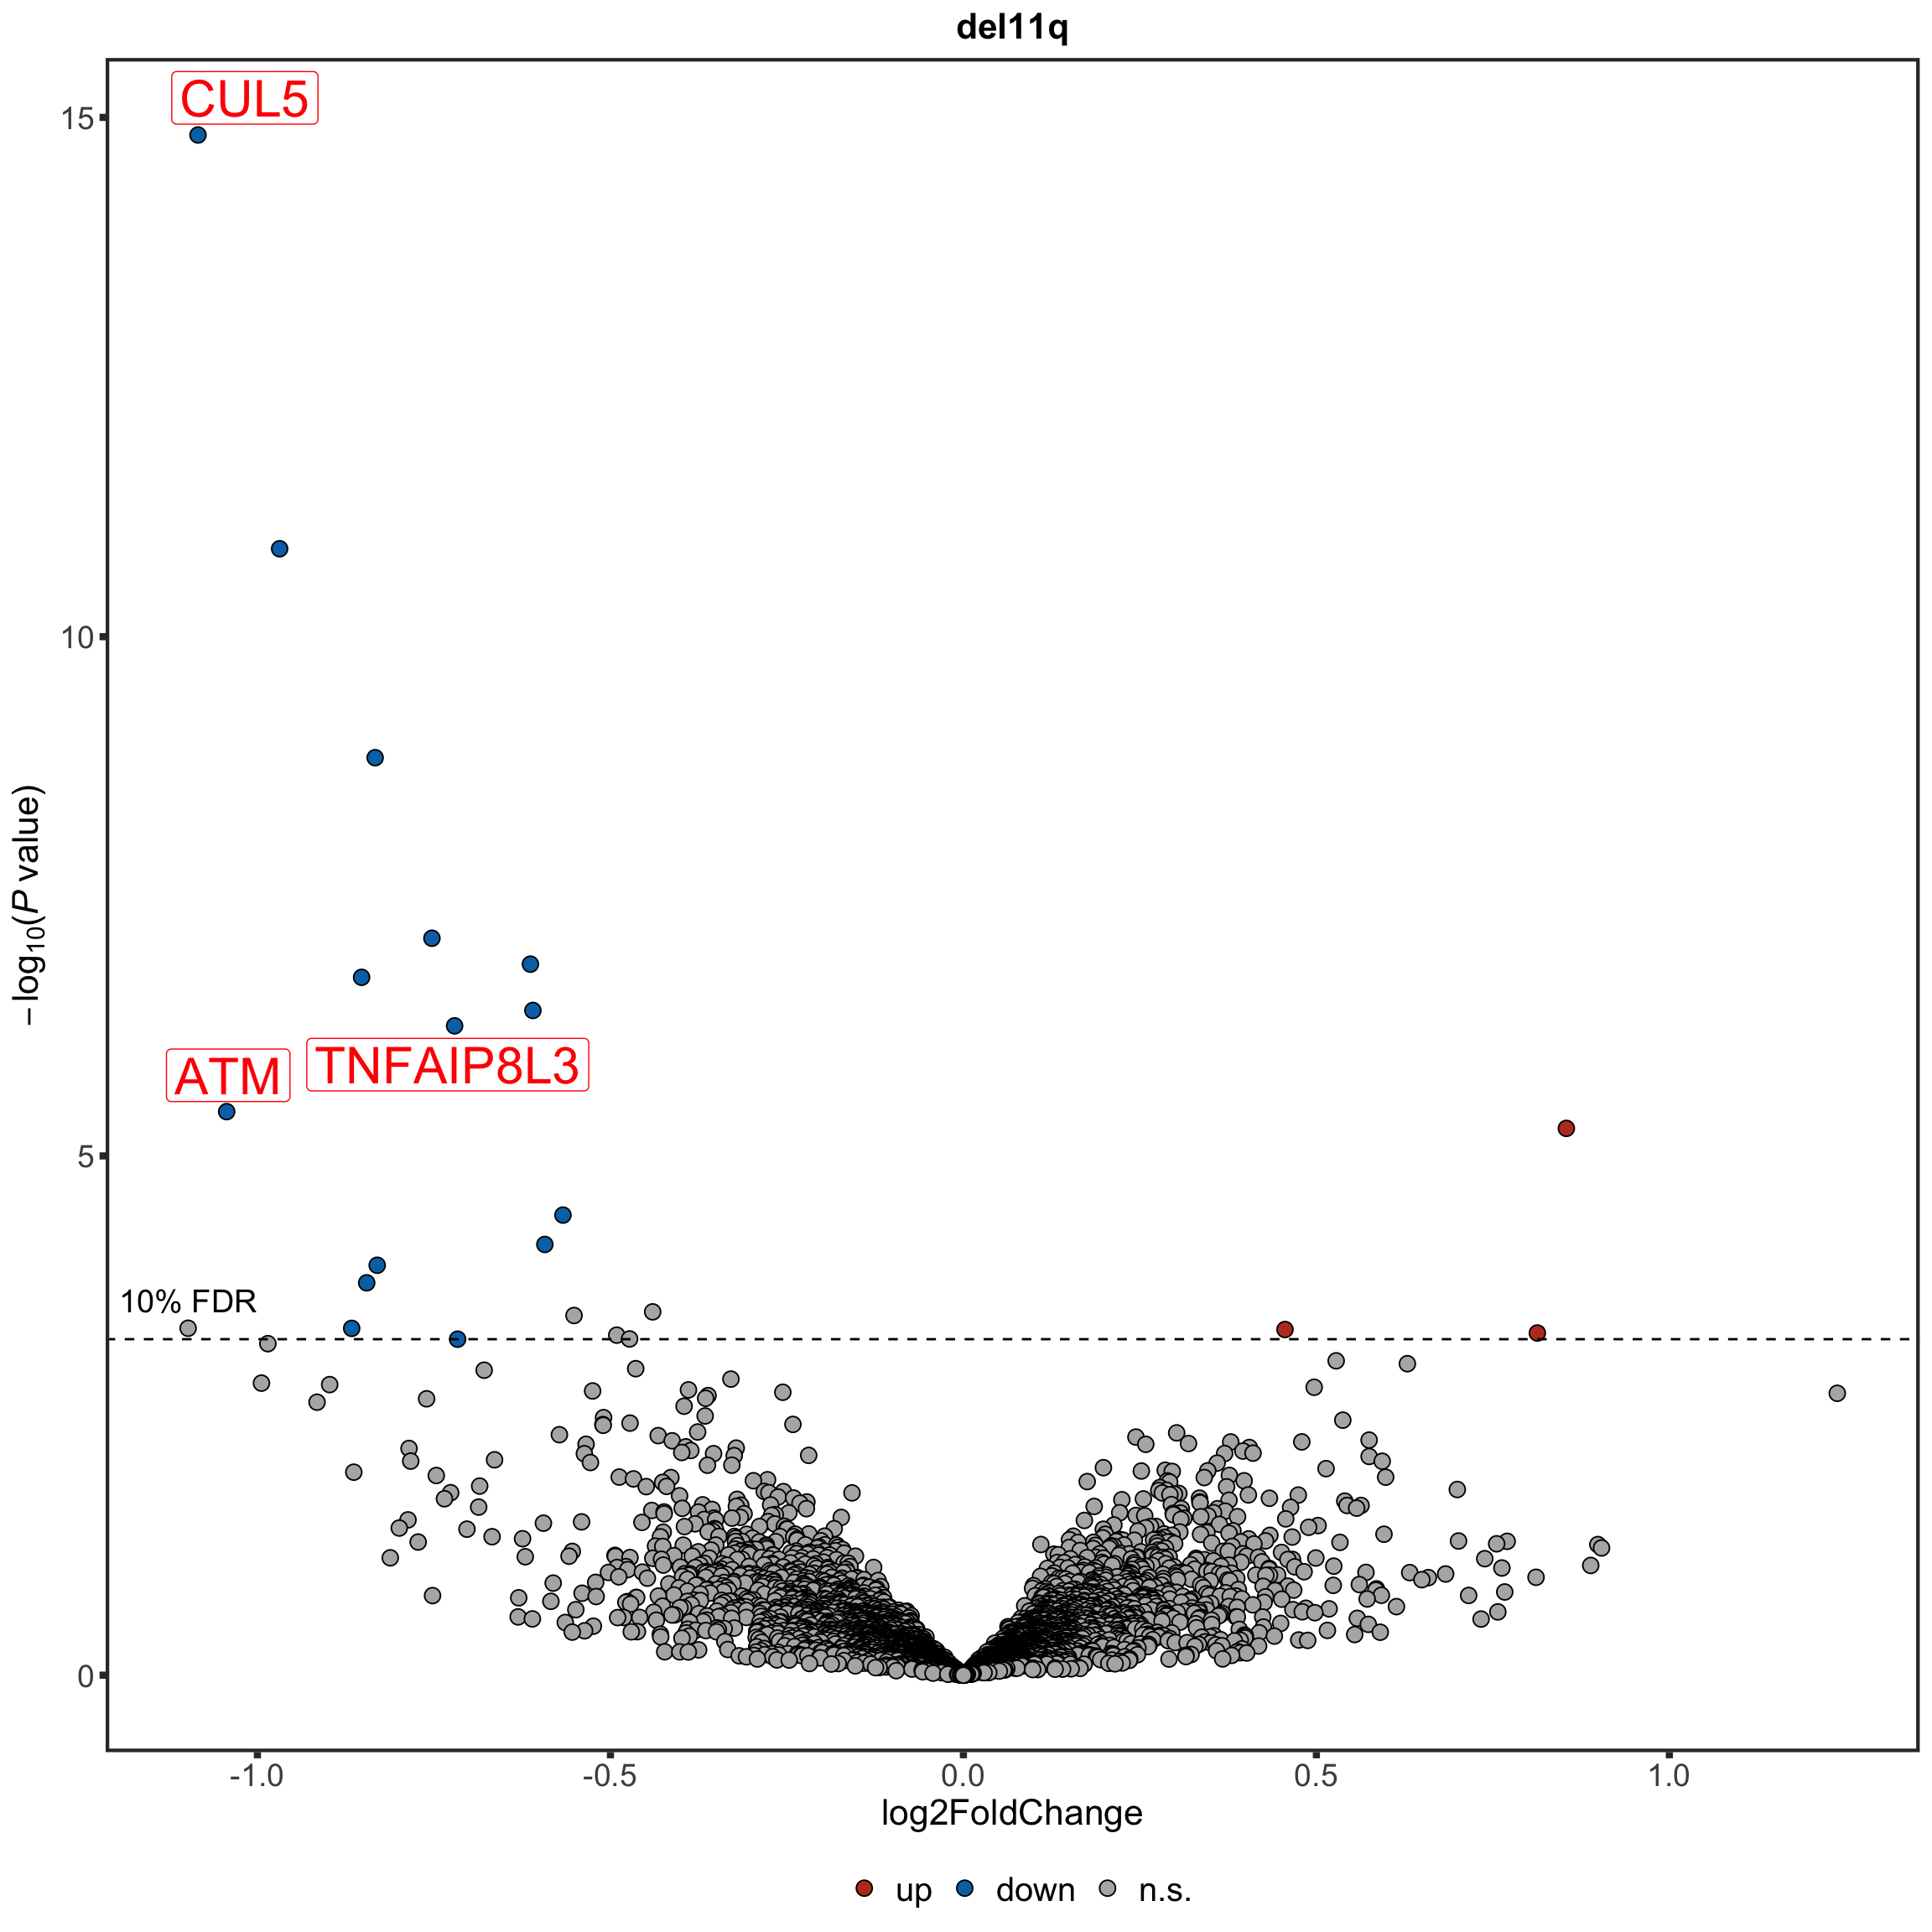
Volcano plot
plotTab <- resList %>% mutate(onChr11 = ifelse(Chr %in% "11","yes","no"))
#nameList <- filter(resList, adj.P.Val < 0.1)$name
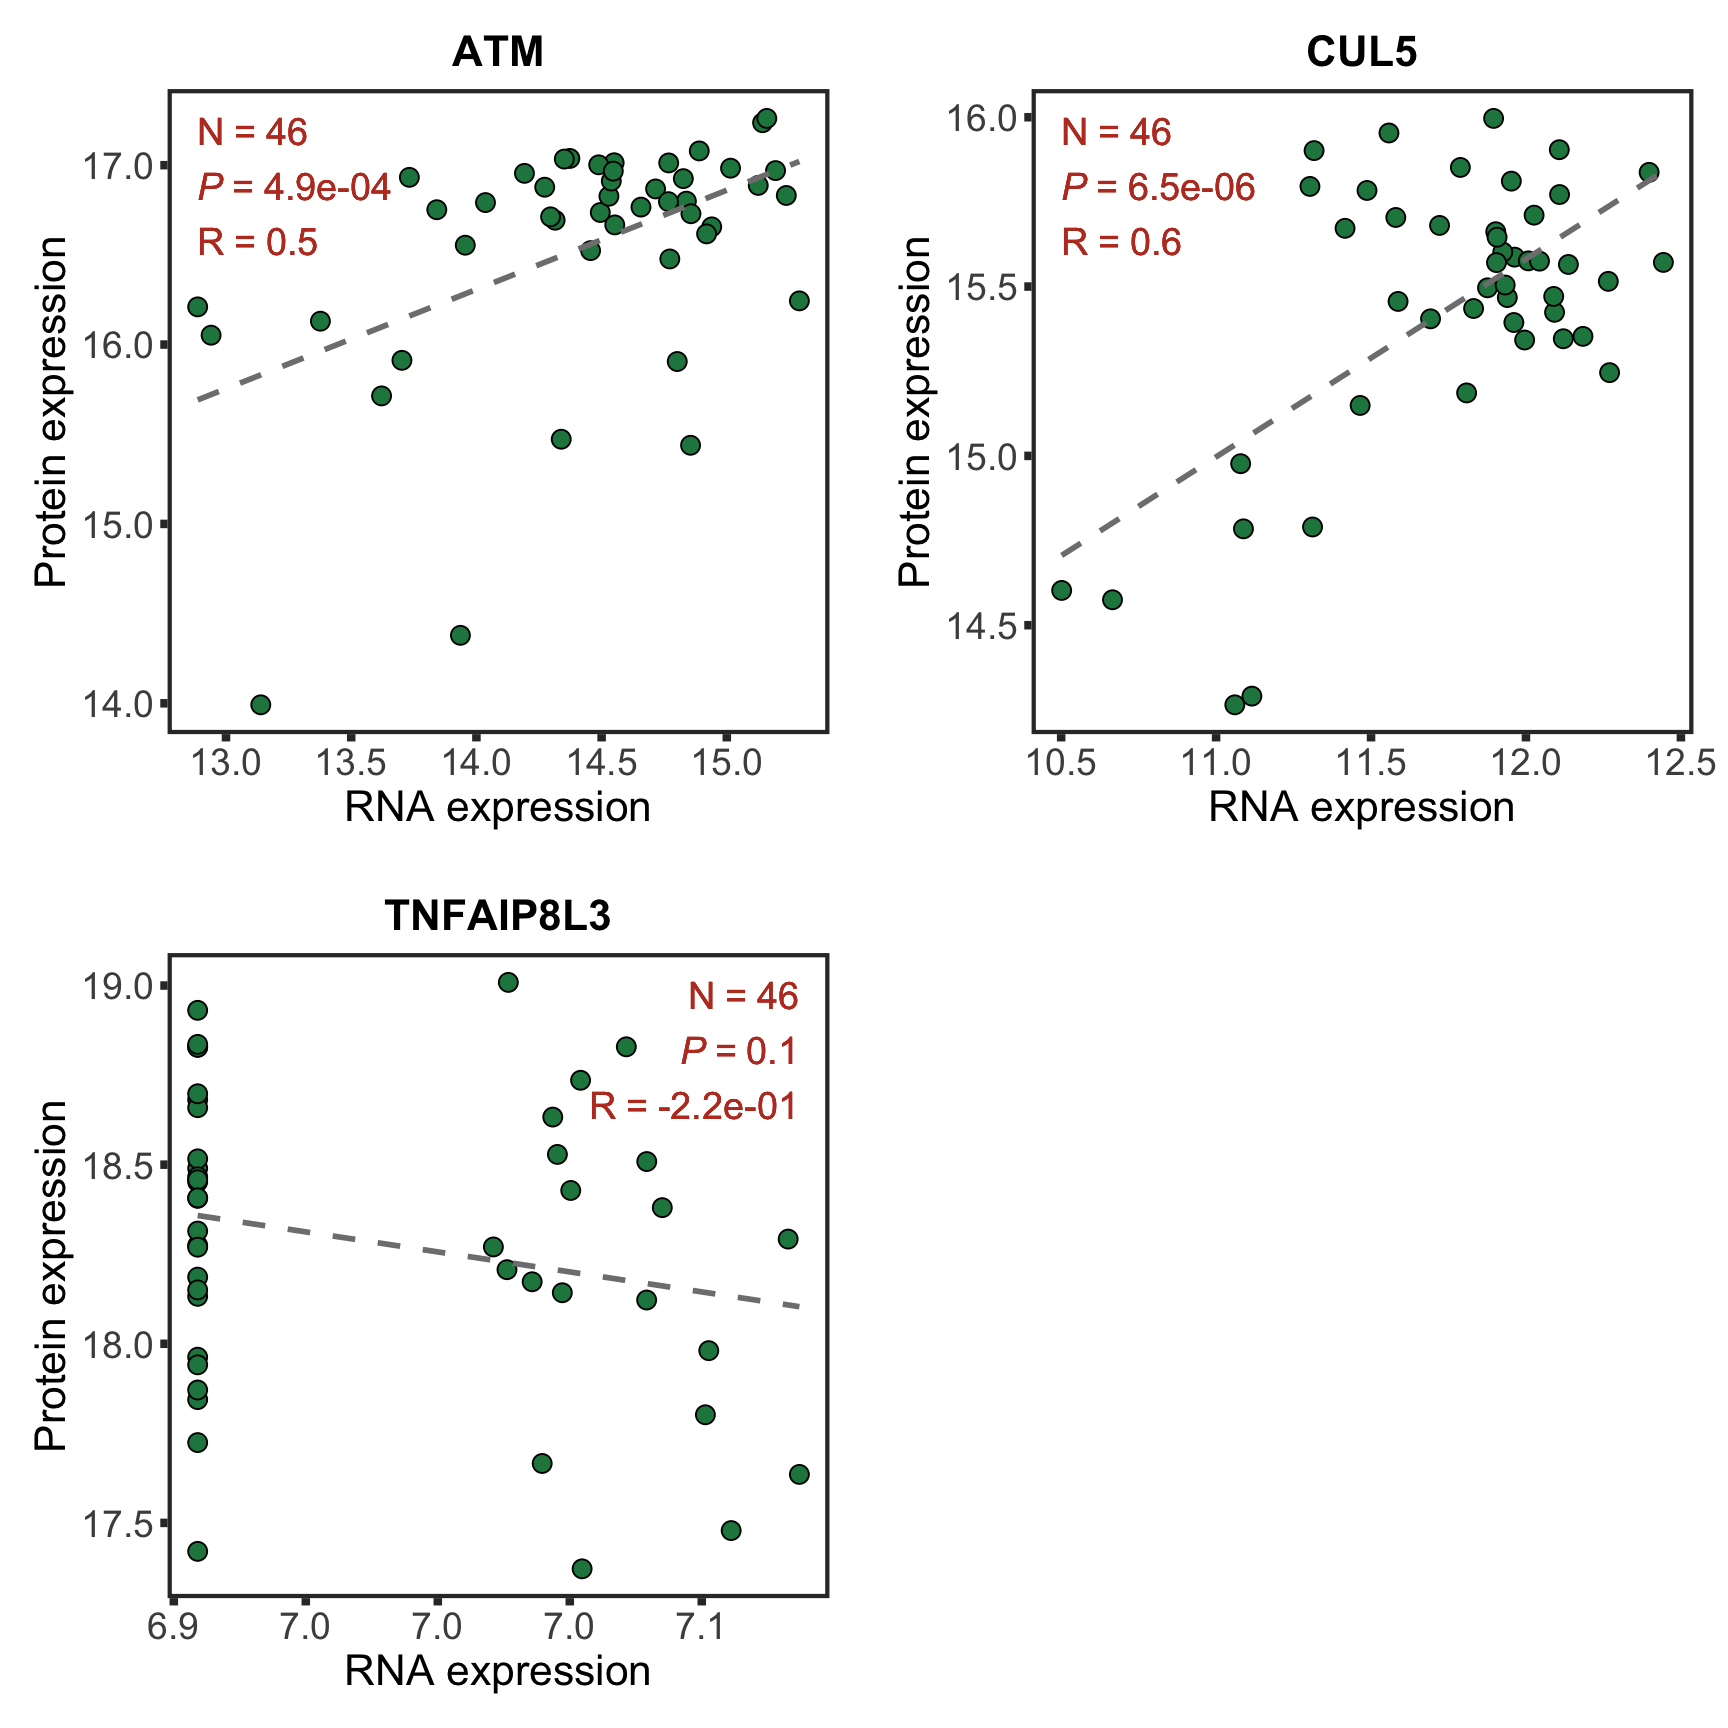
nameList <- c("CUL5","ATM","TNFAIP8L3")
del11qVolcano <- plotVolcano(plotTab, fdrCut =0.1, x_lab="log2FoldChange", posCol = colList[1], negCol = colList[2],
plotTitle = "del11q", ifLabel = TRUE, labelList = nameList)
del11qVolcano
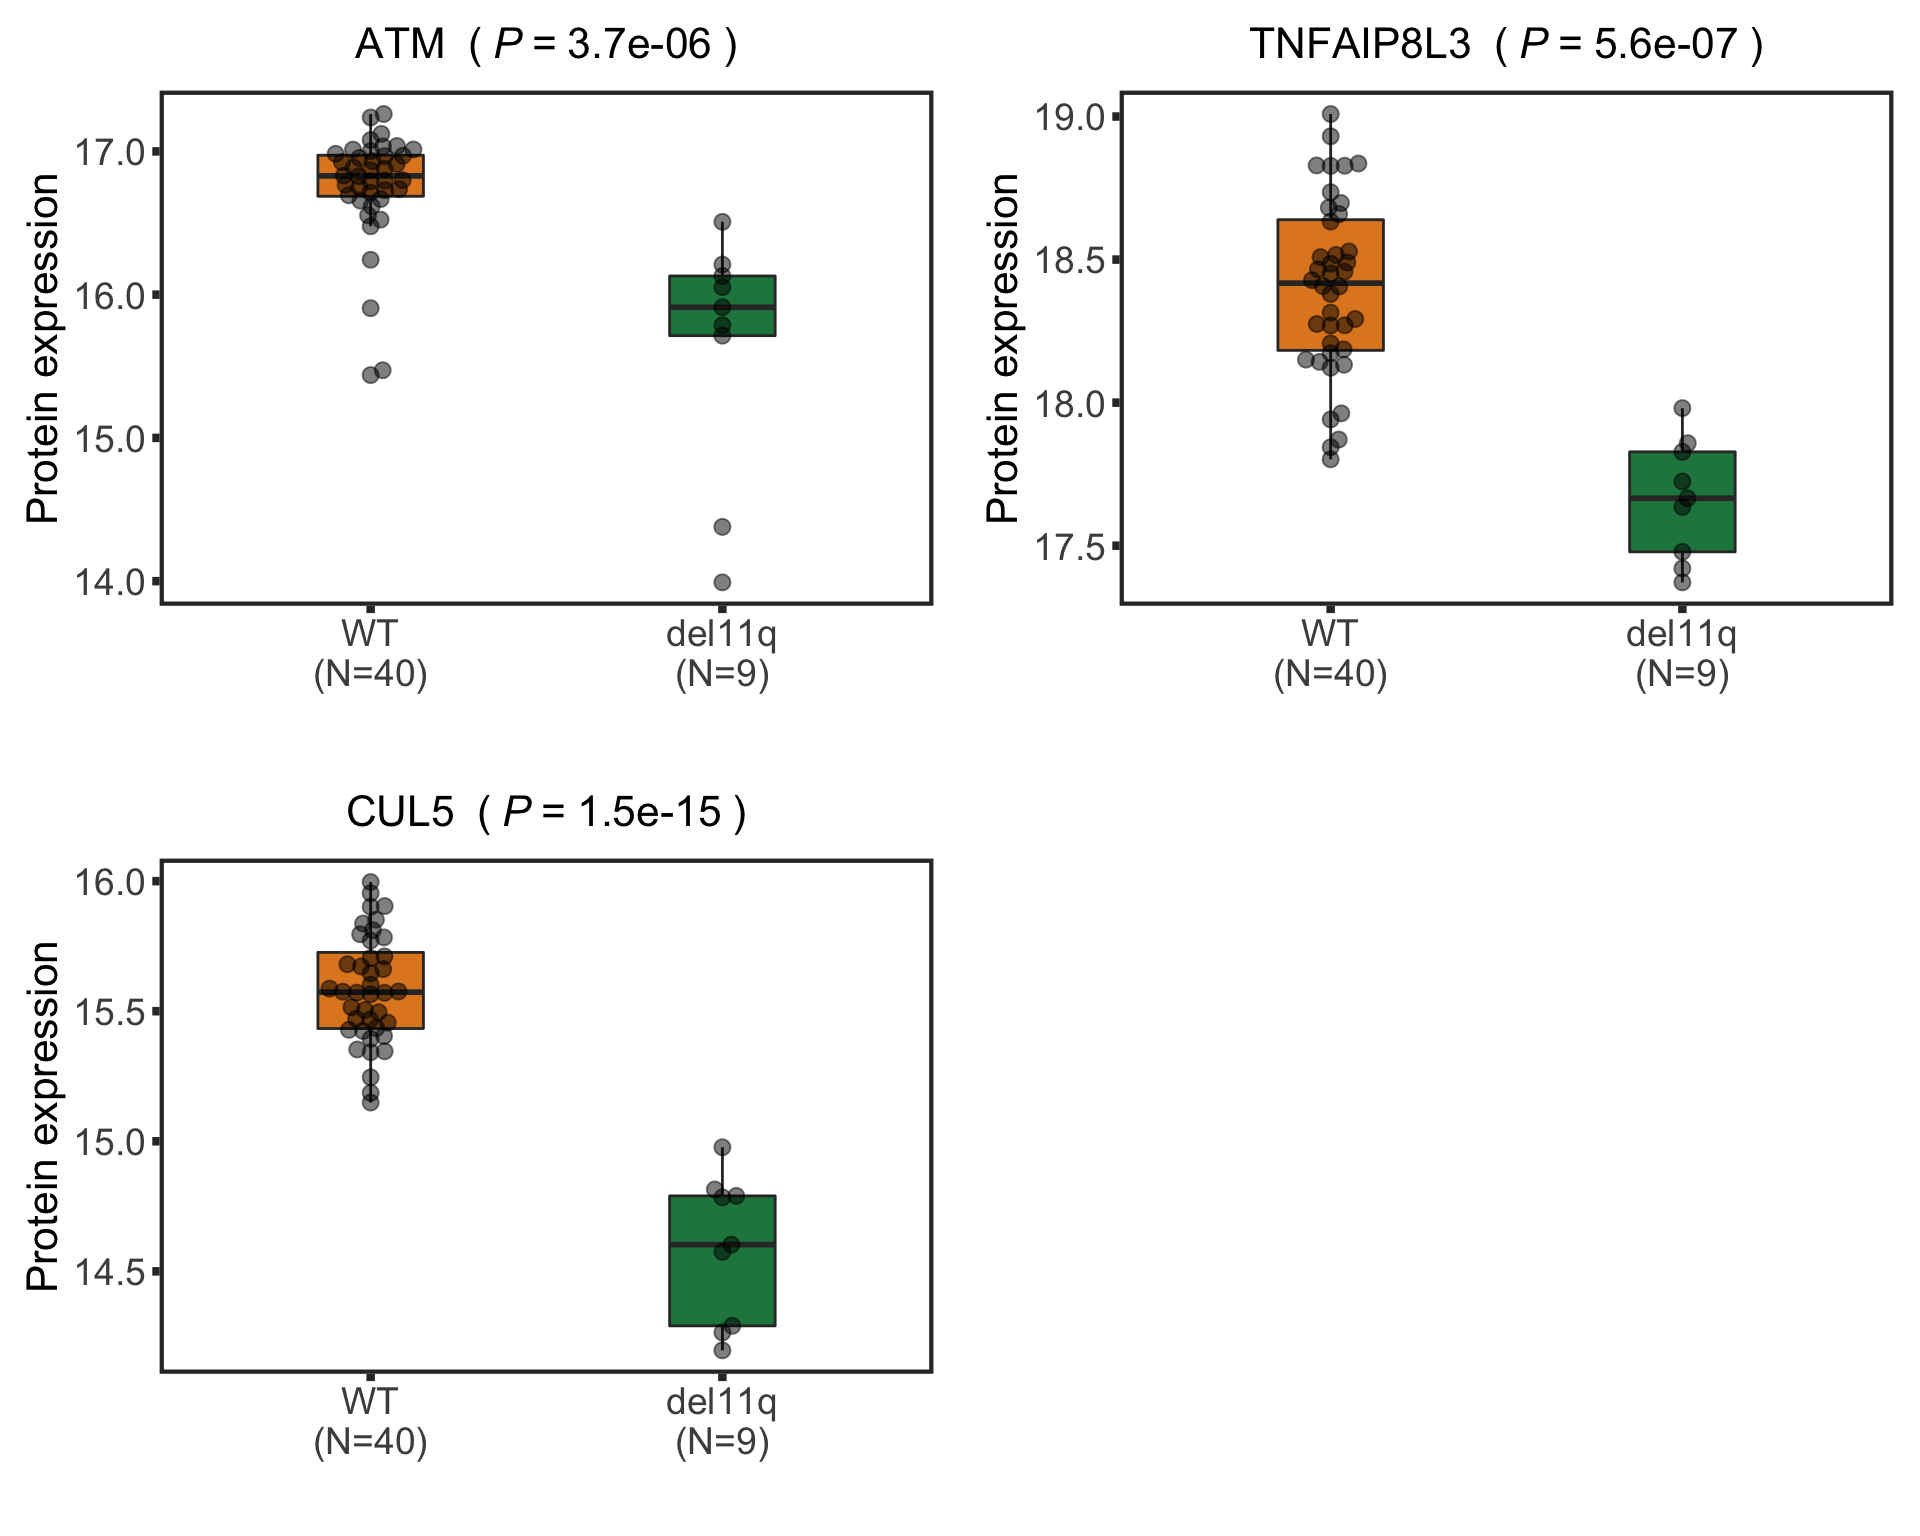
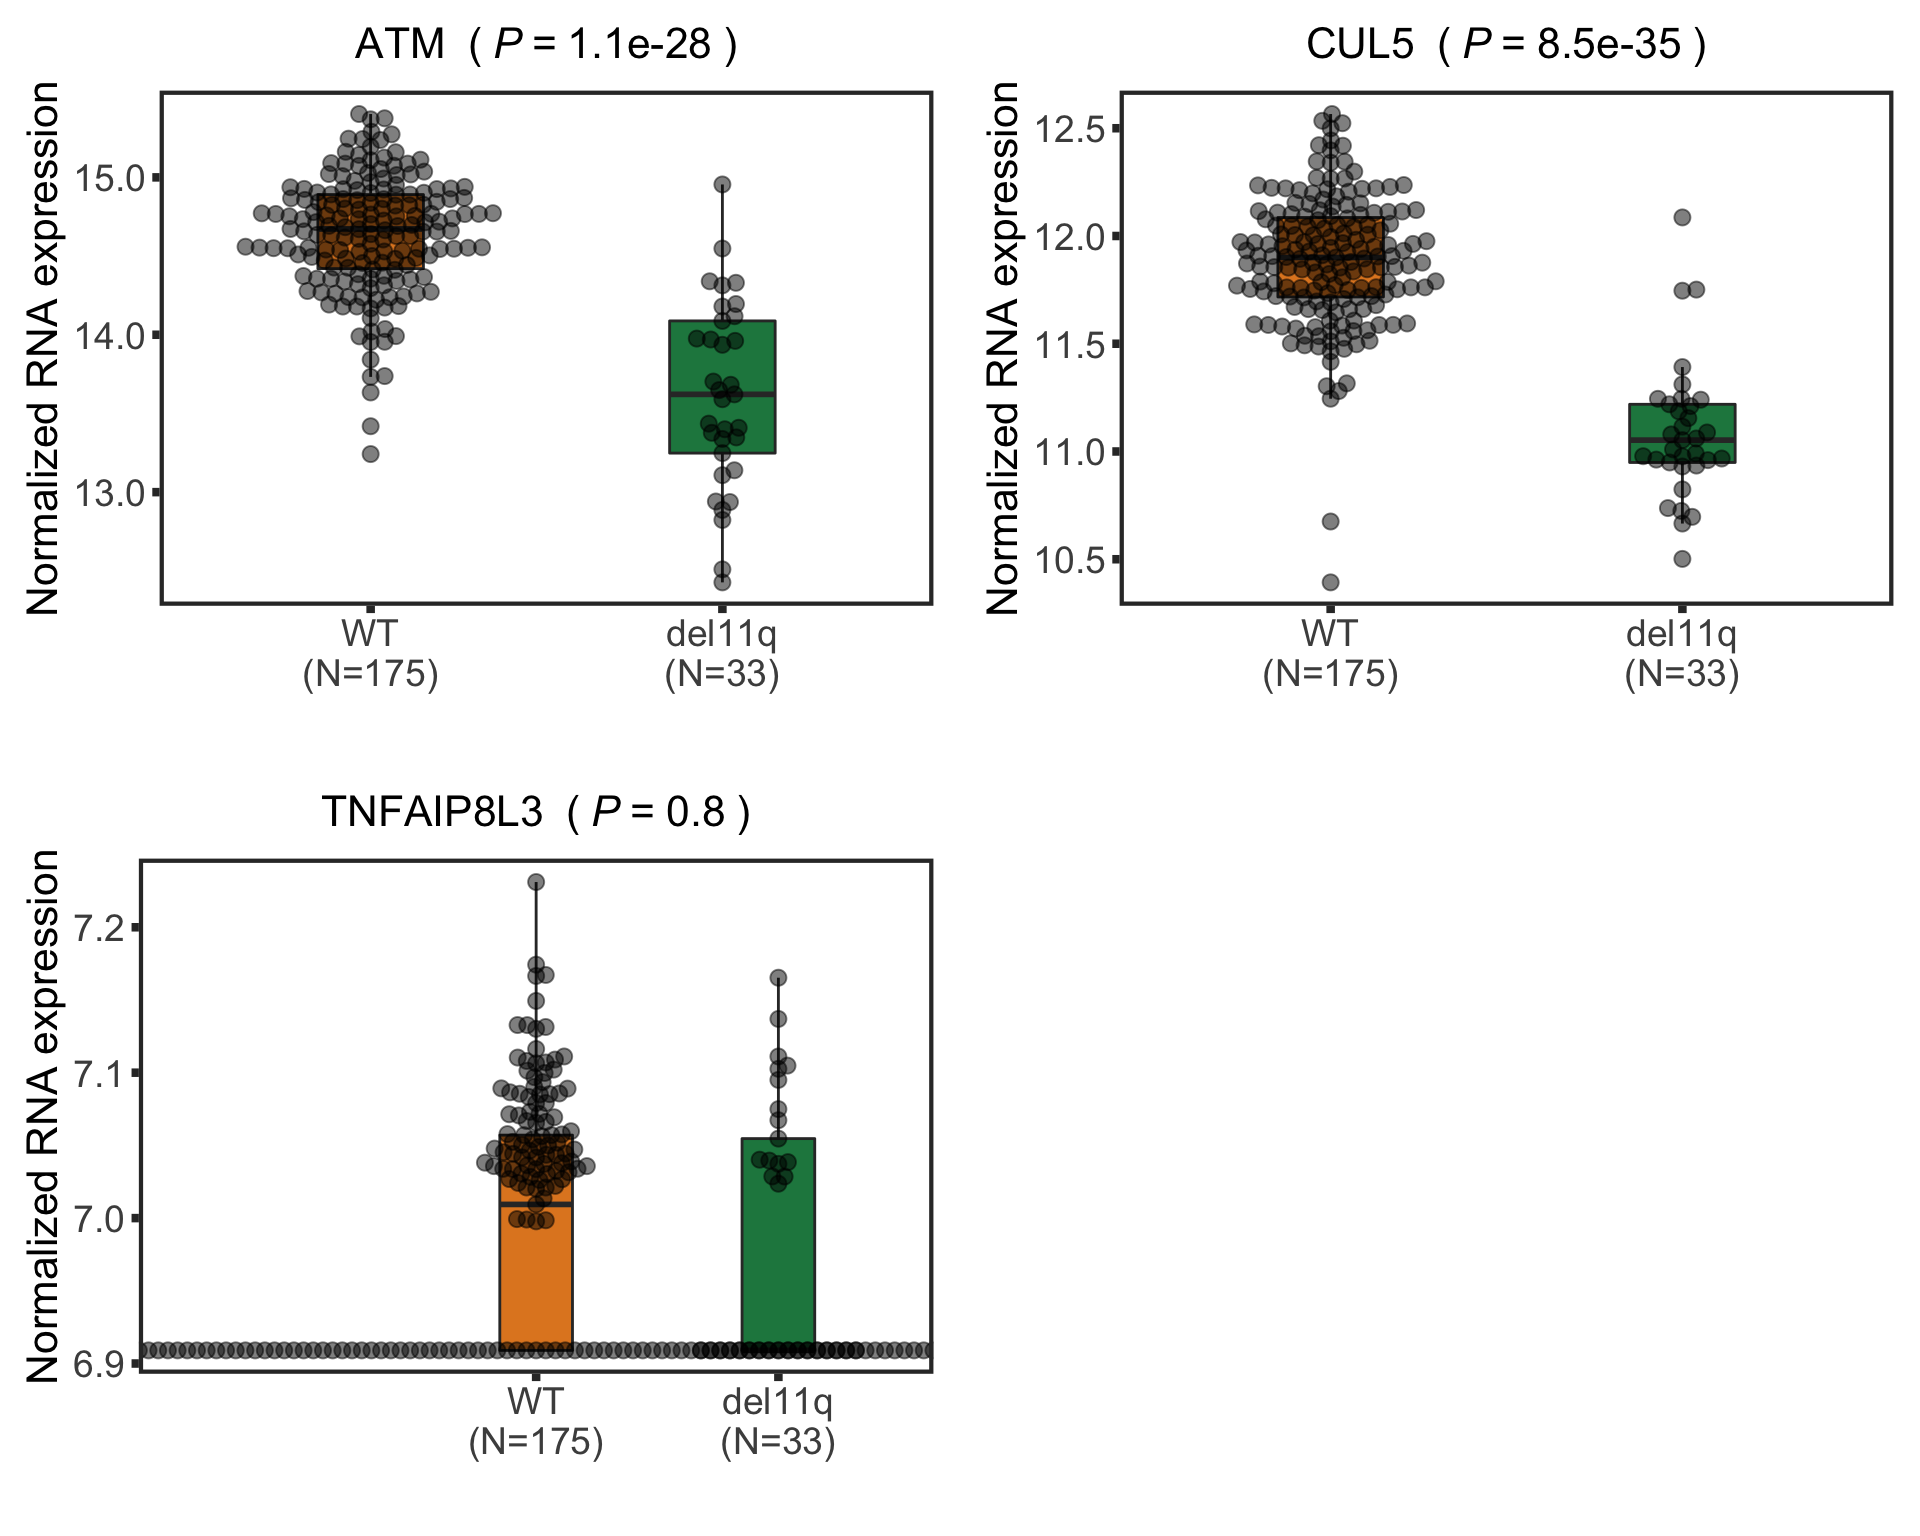
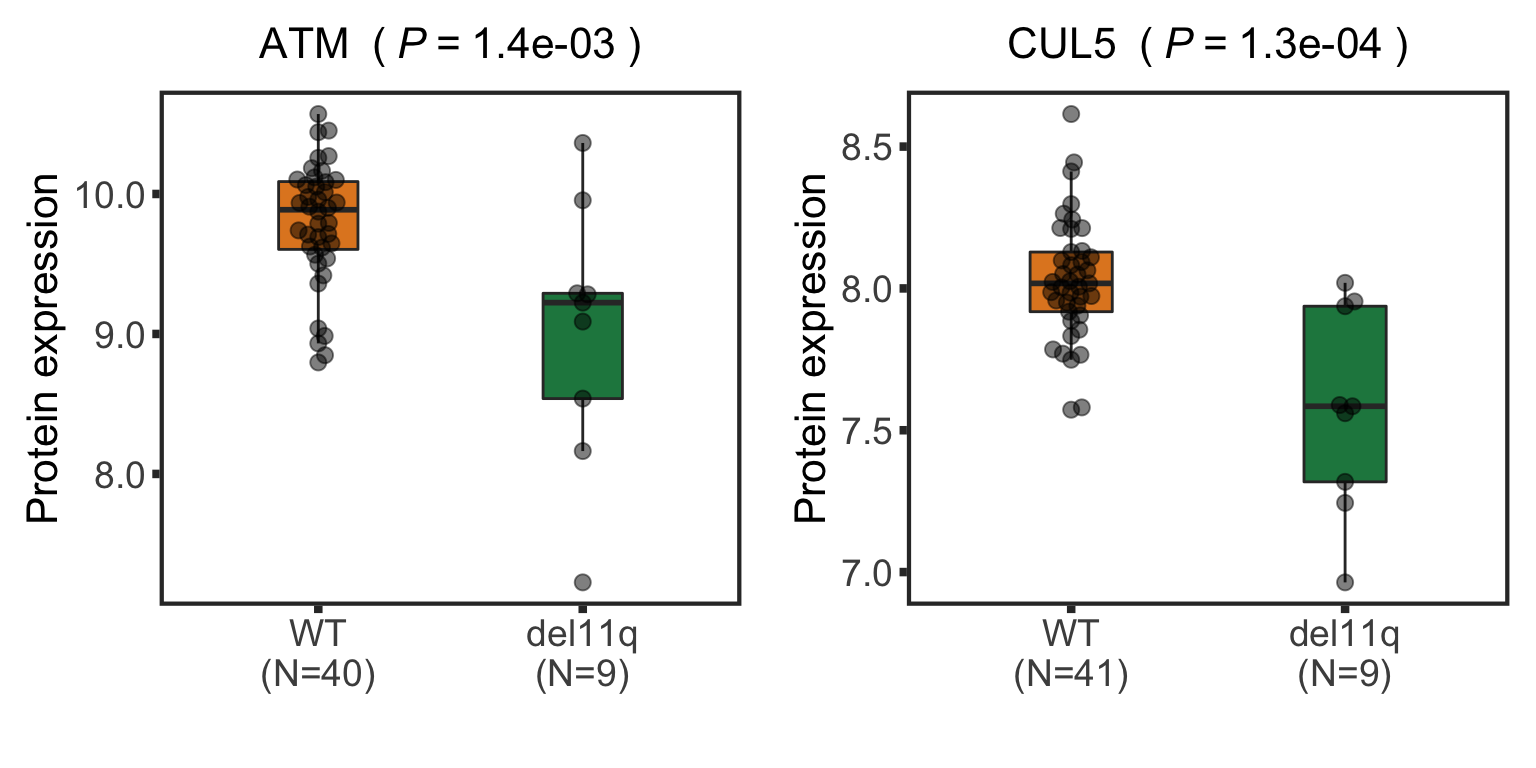
Boxplot plot of selected genes
nameList <- c("ATM","CUL5","TNFAIP8L3")
protTab <- sumToTidy(protCLL, rowID = "uniprotID", colID = "patID")
plotTab <- protTab %>% filter(hgnc_symbol %in% nameList) %>%
  mutate(del11q = patMeta[match(patID, patMeta$Patient.ID),]$del11q) %>%
  mutate(status = ifelse(del11q %in% 1,"del11q","WT"),
         name = hgnc_symbol) %>%
  mutate(status = factor(status, levels = c("WT","del11q")))
pList <- plotBox(plotTab, pValTabel = resList, y_lab = "Protein expression")
del11qBox <- cowplot::plot_grid(plotlist= pList, ncol=2)
del11qBox
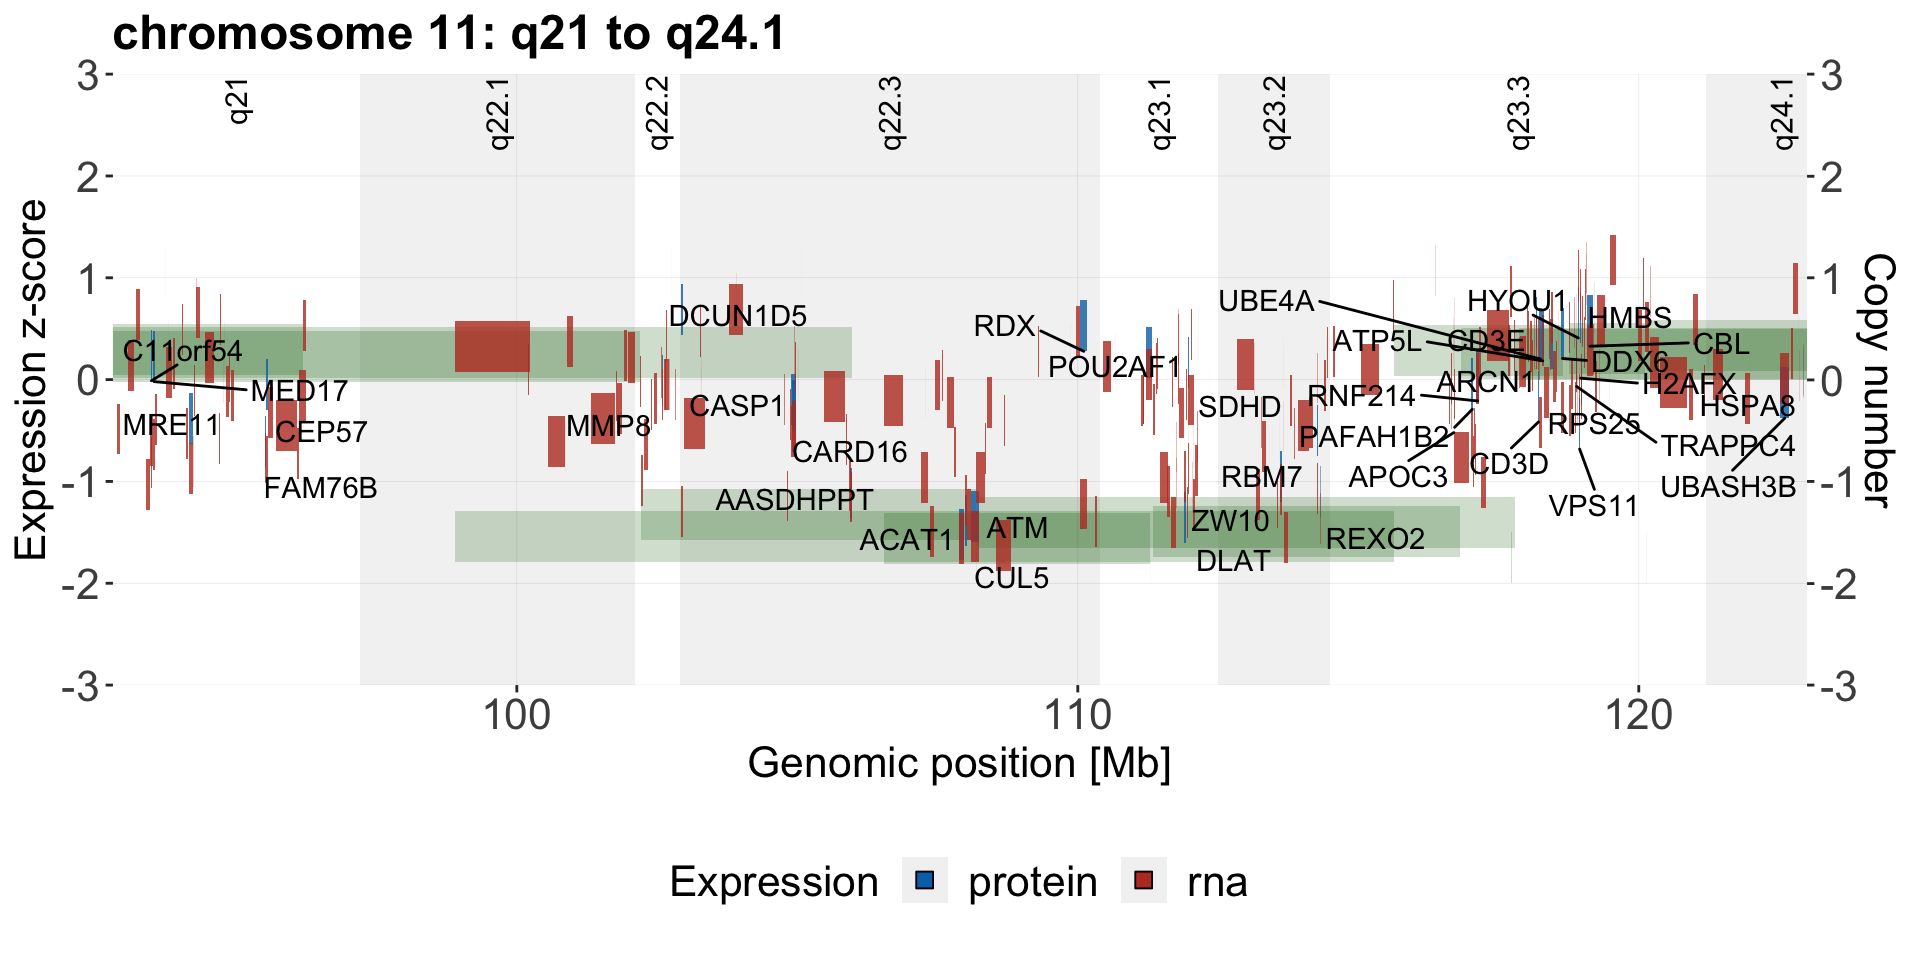
Genome coordinate plot
load("../output/exprCNV_enc.RData")
Normalize protein and RNA expression
normalized <- TRUE
#if perform normalization
if (normalized) {
  #for protein
  exprMat <- select(allProtTab,patID, id,expr) %>%
    spread(key = patID, value =expr) %>% data.frame() %>%
    column_to_rownames("id") %>% as.matrix()
  qm <- jyluMisc::mscale(exprMat, useMad = F)
  normTab <- data.frame(qm) %>% rownames_to_column("id") %>%
    gather(key = "patID", value = "expr", -id)
  allProtTab <- select(allProtTab, -expr) %>% left_join(normTab, by = c("patID","id"))


  #for RNA
  exprMat <- select(allRnaTab,patID, id,expr) %>%
    spread(key = patID, value =expr) %>% data.frame() %>%
    column_to_rownames("id") %>% as.matrix()
  qm <- jyluMisc::mscale(exprMat, useMad = F)
  normTab <- data.frame(qm) %>% rownames_to_column("id") %>%
    gather(key = "patID", value = "expr", -id)
  allRnaTab <- select(allRnaTab, -expr) %>% left_join(normTab, by = c("patID","id"))
}
Function for plotting
plotExprCNV <- function(pat, chr, allBand, allLine, allProtTab, allRnaTab, ifTrend = FALSE, plotTitle = "",
                        startPos = -Inf, endPos= Inf, showLabel = "none", plotDiff = FALSE, errorBar = FALSE) {

  multiPat <- length(unique(pat)) > 1

  #table for cyto band
  bandTab <- filter(allBand, ChromID == chr)

  #table for expression
  plotProtTab <- filter(allProtTab, ChromID == chr, patID %in% pat) %>%
    mutate(expression = "protein") %>%
    mutate_if(is.factor,as.character)

  plotRnaTab <- filter(allRnaTab, ChromID == chr, patID %in% pat) %>%
    mutate(expression = "rna") %>% mutate_if(is.factor,as.character)

  if (!plotDiff) {
    plotExprTab <- bind_rows(plotRnaTab, plotProtTab) %>%
      filter(start_position > startPos, end_position < endPos)
  } else {
    plotProtTab <- plotProtTab %>% dplyr::rename(protein = expr)
    plotRnaTab <- plotRnaTab %>% select(id, expr) %>%
      dplyr::rename(rna = expr)
    plotExprTab <- left_join(plotProtTab, plotRnaTab, by = "id") %>%
      mutate(expr = protein-rna, expression = "protein-rna") %>%
      filter(start_position > startPos, end_position < endPos) %>%
      select(-protein,-rna)
  }

  if (multiPat) {
    se <- function(x) sqrt(var(x,na.rm = T)/length(x))
    plotExprTab <- group_by(plotExprTab, id, symbol, ChromID, start_position, end_position,mid_position, expression) %>%
      summarise(upper = mean(expr,na.rm=T) + 1.96*se(expr), lower = mean(expr,na.rm=T) - 1.96*se(expr),
                expr = mean(expr)) %>%
      ungroup()
  }

  #table for copy number
  plotLineTab <- filter(allLine, patID %in% pat, ChromID == chr)

  #plot range
  maxVal <- max(c(max(plotExprTab$expr,na.rm = T),max(plotLineTab$SegmentMean,na.rm = T)),na.rm = T) + 1
  minVal <- min(c(min(plotExprTab$expr, na.rm = T),min(plotLineTab$SegmentMean,na.rm = T)),na.rm = T) - 1
  #maxVal <- 5
  #minVal <- -5
  xMax <- max(bandTab$chromEnd, na.rm = T)

  #main plot
  gg <- ggplot() +
    geom_rect(data=bandTab, mapping=aes(xmin=chromStart, xmax=chromEnd, ymin=minVal, ymax=maxVal,
                                        fill=Colour, label = band), alpha=0.1) +
    geom_text(data=bandTab, mapping=aes(label=band, x=chromMid), y=maxVal, hjust =1, angle = 90, size=4) +
    geom_rect(data=plotLineTab,
            mapping=aes(xmin=Start, xmax=End, ymin=SegmentMean,
                        ymax=SegmentMean+0.5,fill = set),alpha=0.2)
  if (multiPat & errorBar) {
      gg <- gg + geom_errorbar(data = plotExprTab,
                               aes(x = mid_position, y = expr + 0.25, ymax = upper + 0.25, ymin=lower + 0.25),
                               col = "grey60")
  }

  gg <- gg + geom_rect(data = plotExprTab,
            mapping=aes(xmin=start_position,
                        xmax=end_position, ymin=expr, ymax=expr+0.5,
                        fill = expression, label = symbol), alpha =0.8) +
    #scale_x_continuous(expand=c(0,0),limits = c(max(0,startPos),min(xMax,endPos))) +
    scale_y_continuous(limits = c(minVal, maxVal), sec.axis = sec_axis(~./1, name = "Copy number")) +
    coord_cartesian(xlim = c(max(0,startPos),min(xMax,endPos)), expand = FALSE)+
    xlab("Genomic position [Mb]") +
    ylab("Expression z-score") +
    scale_fill_manual(values = c(even = "white",odd = "grey50",
                                 rna = colList[1], protein = colList[2], `protein-rna` = "salmon",
                                 WES = "darkgreen",WGS = "orange", Methylome = "purple")) +
    scale_color_manual(values = c(protein = "blue",rna = "red",`protein-rna` = "salmon")) +
    ggtitle(plotTitle) +
    theme(plot.title = element_text(face = "bold", size = 18),
        axis.text = element_text(size=16),
        axis.title = element_text(size=16),
        axis.line = element_blank(),
        legend.position = "none",
        panel.background = element_blank(),
        panel.grid.major = element_line(colour="grey90", size=0.1))

    if (showLabel != "none") {
      gg <- gg +
        ggrepel::geom_text_repel(data = filter(plotExprTab,
                                               expression == showLabel),
                                 aes(x=mid_position, y=expr, label = symbol))
    }
    if (ifTrend) {
      gg <- gg + geom_smooth(data =filter(plotExprTab),
                mapping = aes(y=expr, x= mid_position,
                              color = expression),
                method = "loess", se=FALSE, span=0.2,
                size =0.2)
    }


    #for legend
    ## if the patient has CNV data
    lgTab <- tibble(x= seq(90),y=seq(90),
                    Expression = c(rep("protein",30), rep("rna",30),rep("protein-rna",30)),
                    CNV_data = rep(c("WES","WGS","Methylome"),30))
    if (nrow(plotLineTab) >0) {
      lgTab <- filter(lgTab, CNV_data %in% unique(plotLineTab$set),
                      Expression %in% unique(plotExprTab$expression))
      lg <- ggplot(lgTab, aes(x=x,y=y)) +
        geom_point(aes(fill = Expression), shape =22,size=3) +
        geom_line(aes(color = CNV_data),size=5) +
        scale_fill_manual(values = c(rna = colList[1], protein = colList[2],`protein-rna` = "salmon")) +
        scale_color_manual(values = c(WES = "darkgreen",WGS = "orange", Methylome = "purple"), guide = FALSE) +
        theme(legend.position = "bottom",
              legend.text = element_text(size=16),
              legend.title = element_text(size=16))
    } else {
      lgTab <- filter(lgTab, Expression %in% unique(plotExprTab$expression))
      lg <- ggplot(lgTab, aes(x=x,y=y)) +
        geom_point(aes(fill = Expression), shape =22,size=3) +
        scale_fill_manual(values = c(rna = colList[1], protein = colList[2],`protein-rna` = "salmon")) +
        theme(legend.position = "bottom",
              legend.text = element_text(size=16),
              legend.title = element_text(size=16))
    }

    lg <- get_legend(lg)

    return(list(main=gg, legend = lg))
}
allLine.wes <- filter(allLine, set == "WES")
patList <- intersect(intersect(filter(patMeta, del11q %in% 1)$Patient.ID,allProtTab$patID),allRnaTab$patID)
g <- plotExprCNV(patList,"chr11",allBand, allLine.wes, allProtTab, allRnaTab,
                 ifTrend = FALSE, startPos = 92.8, endPos = 123, showLabel = "protein",
                 plotTitle = "chromosome 11: q21 to q24.1")
geneCoordPlot <- plot_grid(g$main, g$legend, ncol = 1, rel_heights = c(1,0.2))
geneCoordPlot
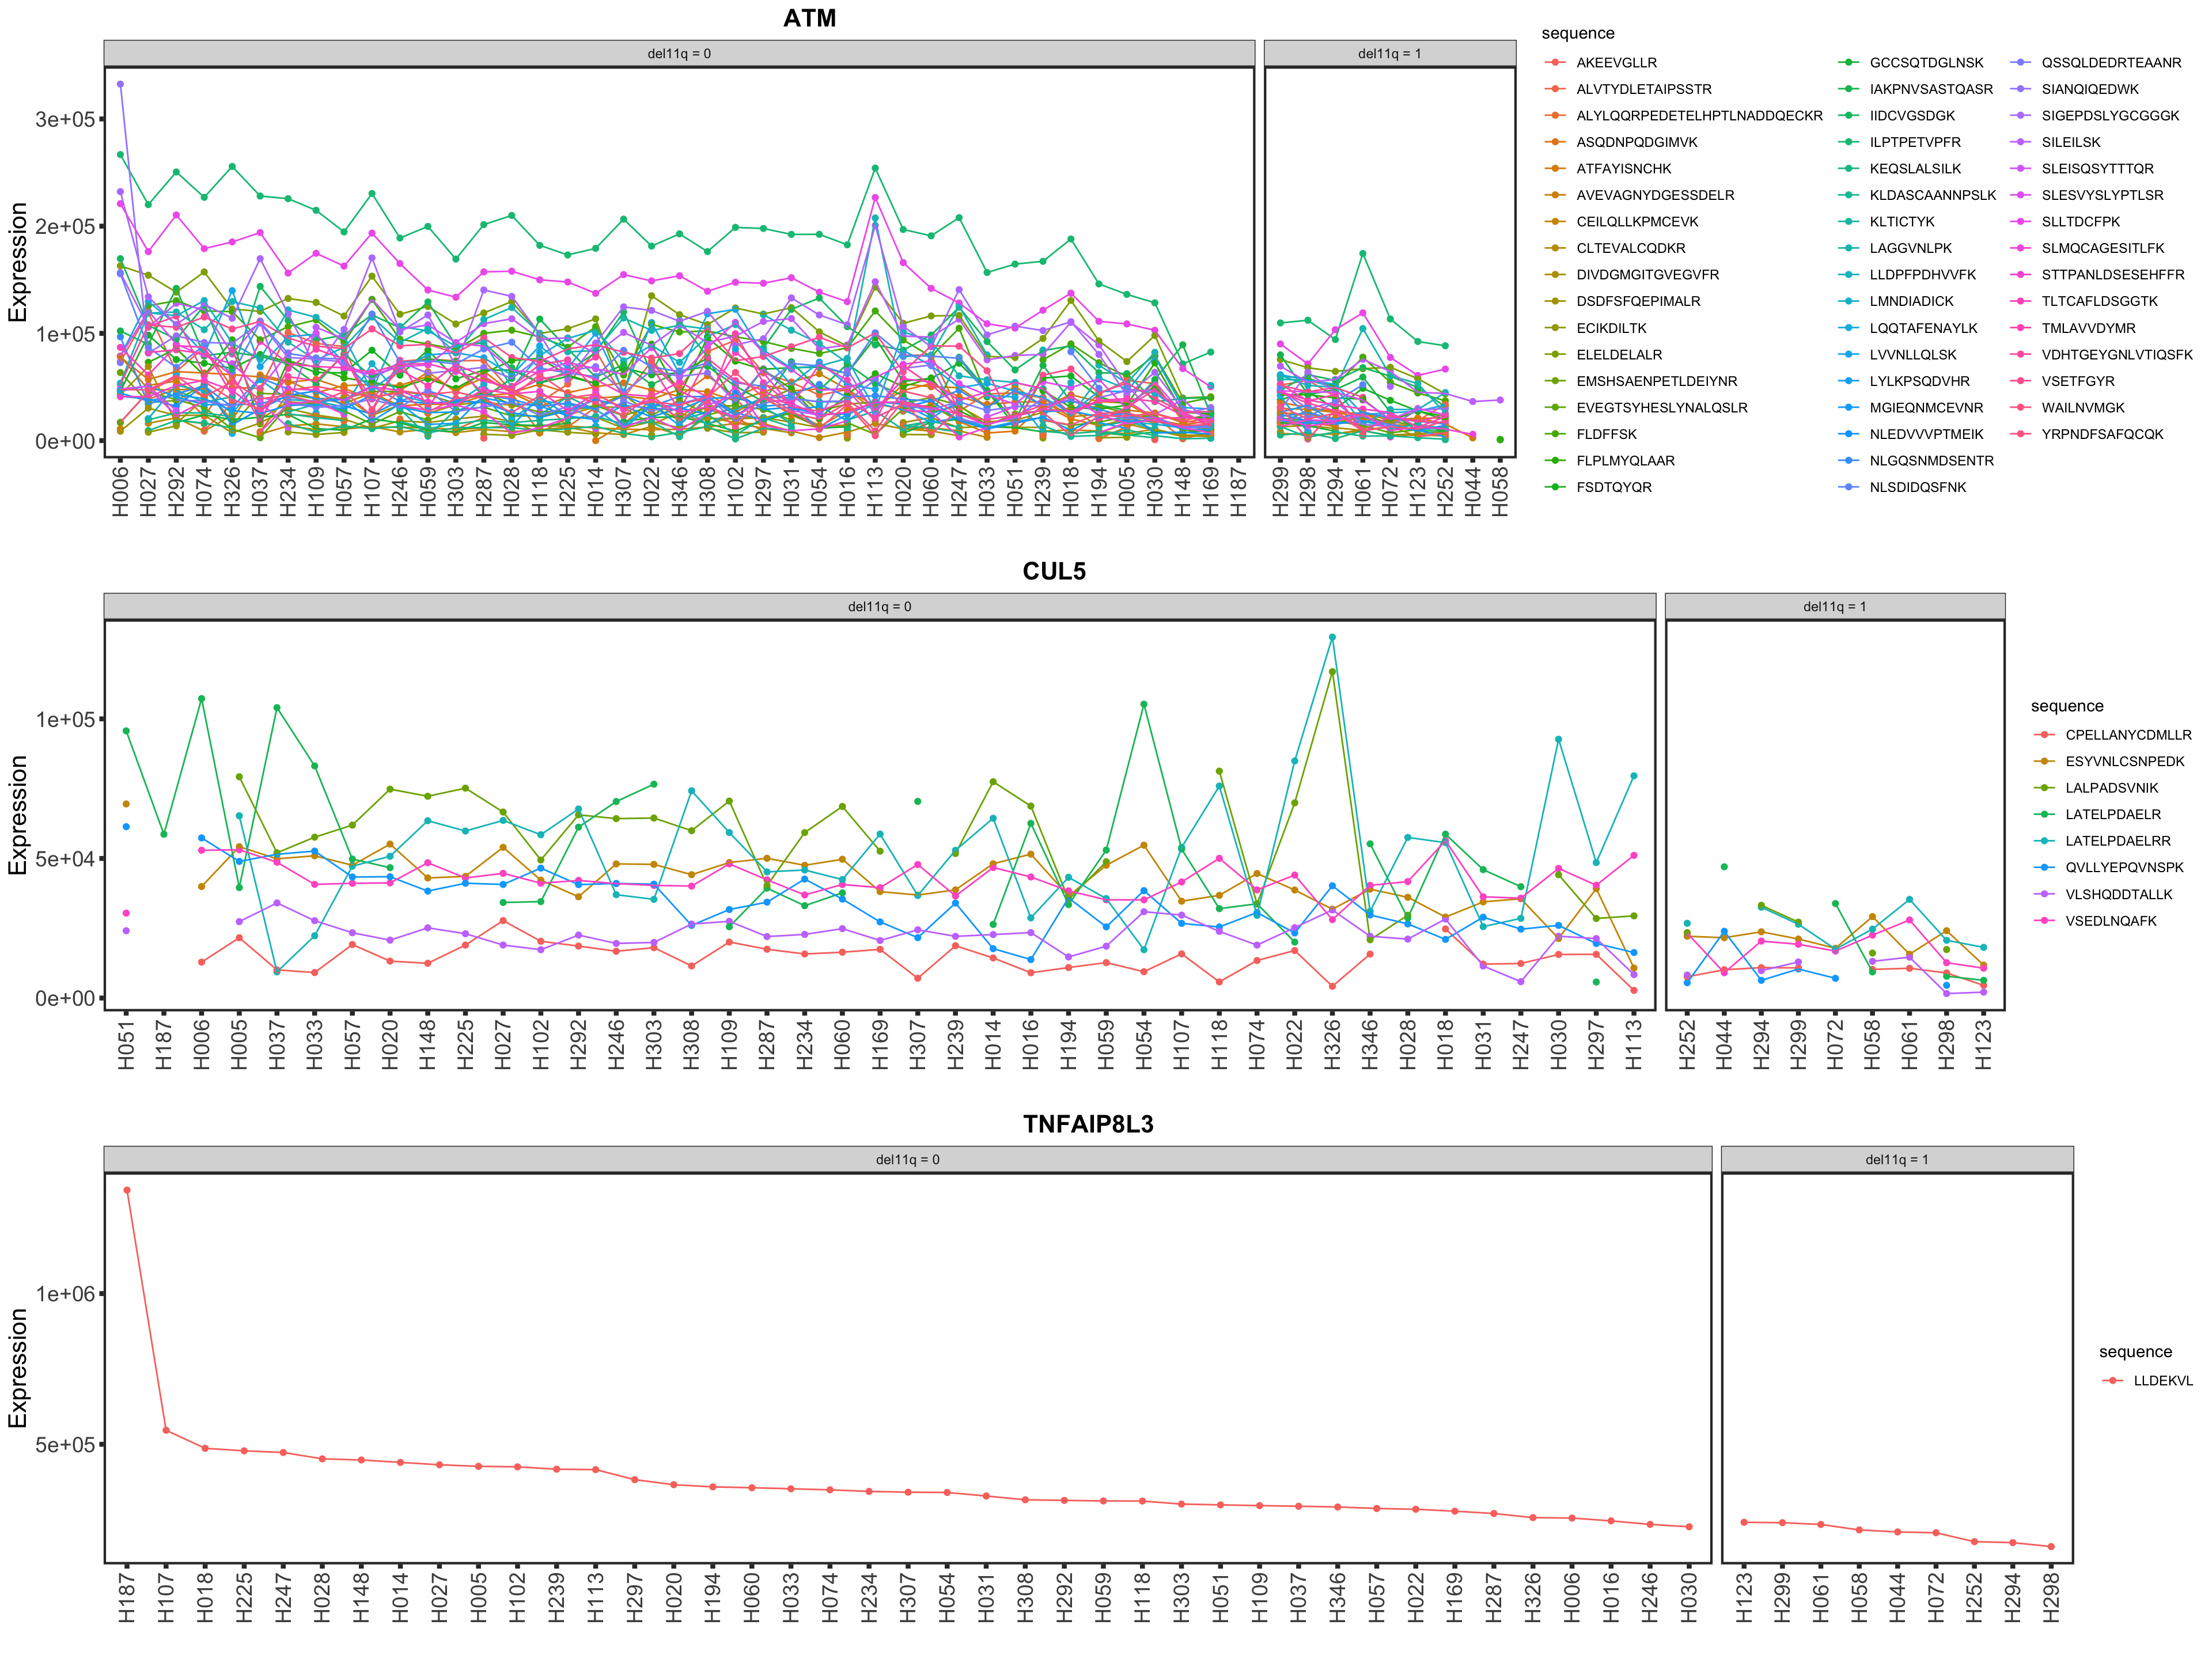
 Among the candidates, only ATM is detected by timsTOF