Analysis of the methylation data from keto diet cohort
Junyan Lu
Last updated: 2024-05-24
Checks: 4 2
Knit directory: RA_Tcell_omics/analysis/
This reproducible R Markdown analysis was created with workflowr (version 1.7.0). The Checks tab describes the reproducibility checks that were applied when the results were created. The Past versions tab lists the development history.
Great job! The global environment was empty. Objects defined in the global environment can affect the analysis in your R Markdown file in unknown ways. For reproduciblity it’s best to always run the code in an empty environment.
The command set.seed(20221110) was run prior to running
the code in the R Markdown file. Setting a seed ensures that any results
that rely on randomness, e.g. subsampling or permutations, are
reproducible.
Great job! Recording the operating system, R version, and package versions is critical for reproducibility.
- unnamed-chunk-20
- unnamed-chunk-22
- unnamed-chunk-24
- unnamed-chunk-26
- unnamed-chunk-28
- unnamed-chunk-30
- unnamed-chunk-32
- unnamed-chunk-34
- unnamed-chunk-36
- unnamed-chunk-38
- unnamed-chunk-40
- unnamed-chunk-42
To ensure reproducibility of the results, delete the cache directory
Keto_diet_analysis_cache and re-run the analysis. To have
workflowr automatically delete the cache directory prior to building the
file, set delete_cache = TRUE when running
wflow_build() or wflow_publish().
Great job! Using relative paths to the files within your workflowr project makes it easier to run your code on other machines.
Tracking code development and connecting the code version to the
results is critical for reproducibility. To start using Git, open the
Terminal and type git init in your project directory.
This project is not being versioned with Git. To obtain the full
reproducibility benefits of using workflowr, please see
?wflow_start.
Load libraries
Global variables
Load and preprocess datasets
Load omics data
Remove CpGs from Y chromosomes
Filter for interested CpGs
To increase statistic power by reducing number of test and increase intepretability
CpGs that associated with interested genes
CpGs within known enhancers
Find GC probs in the enhancer region
Subset CpGs that in either of the two list
Final data dimension
[1] 82147 40Prepare annotation table for CpGs
PCA
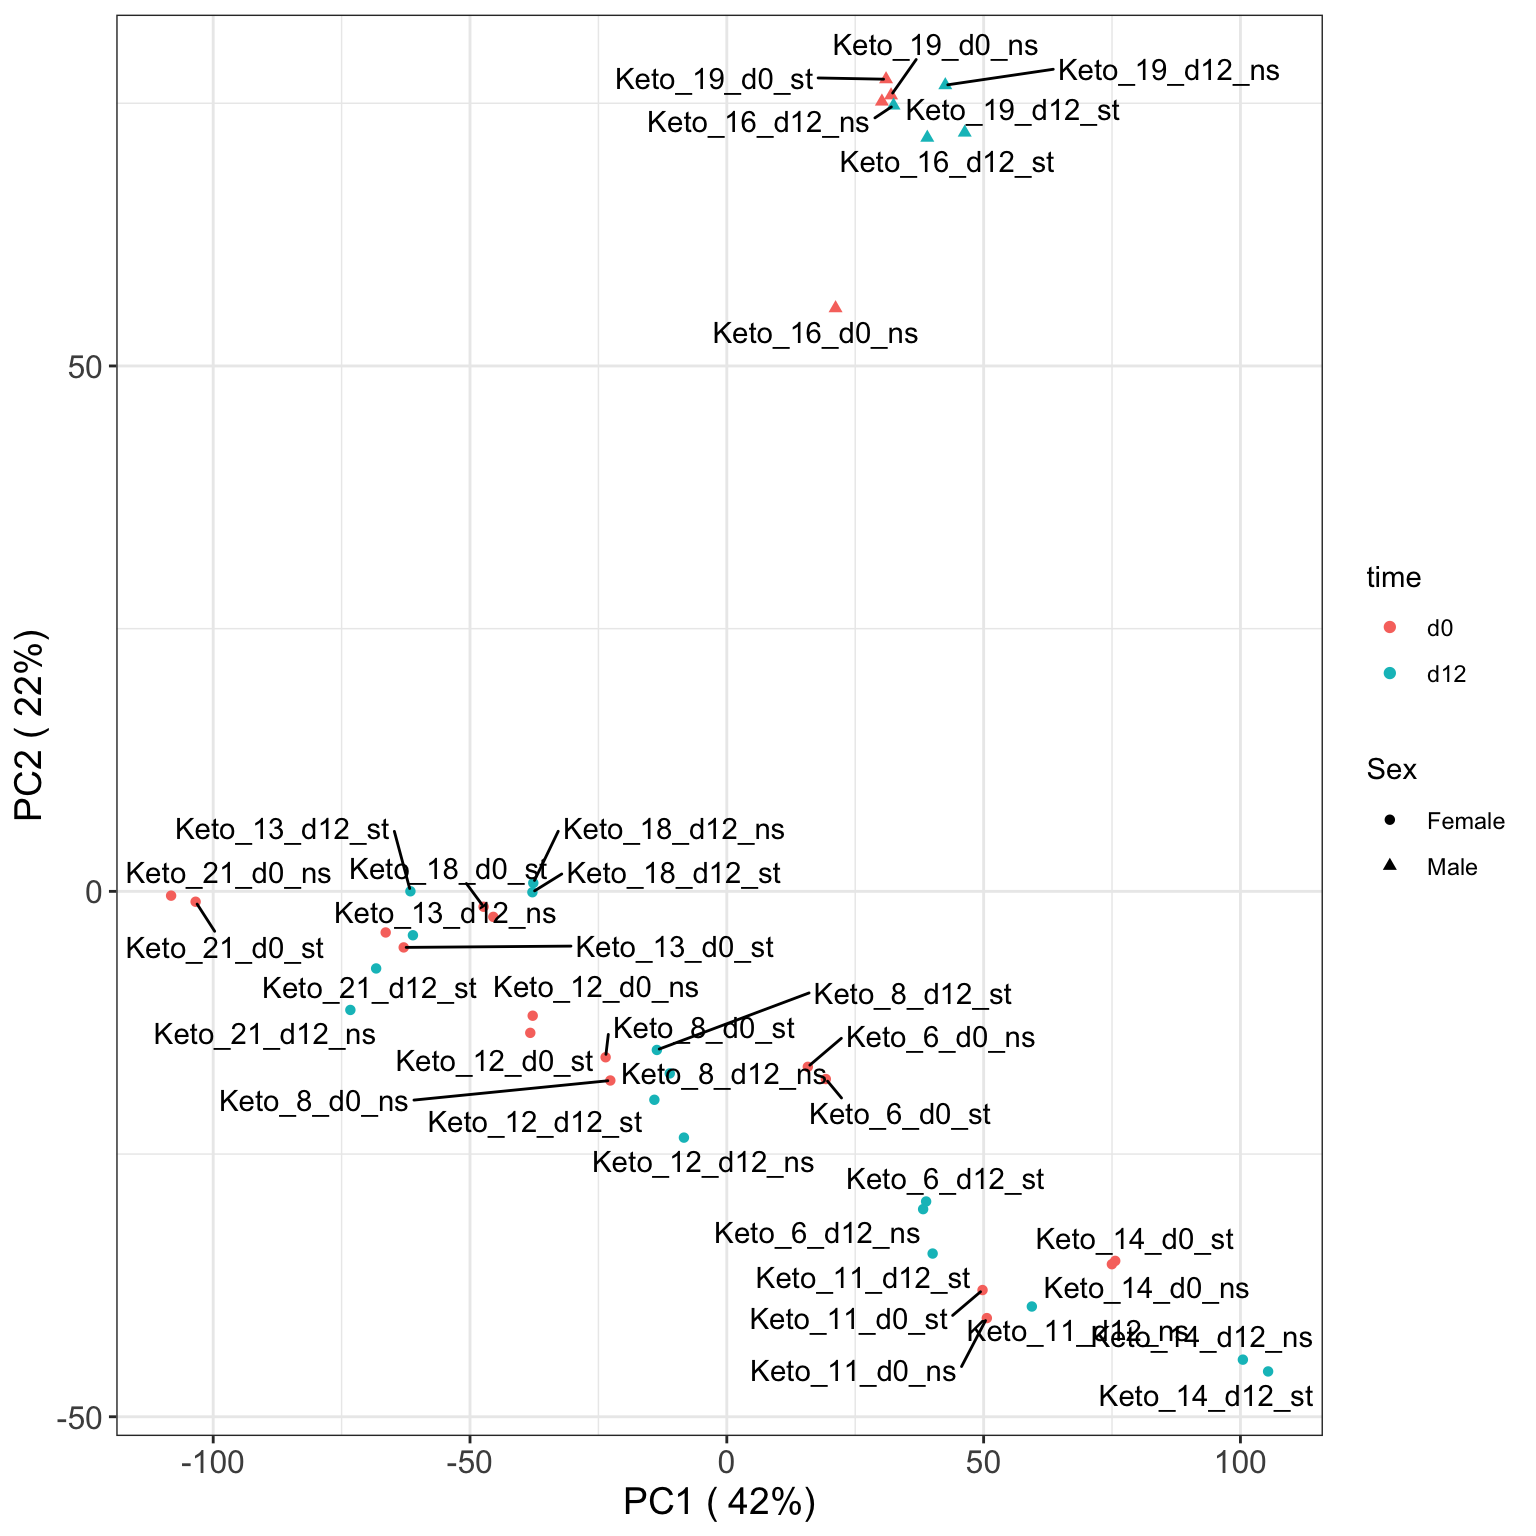
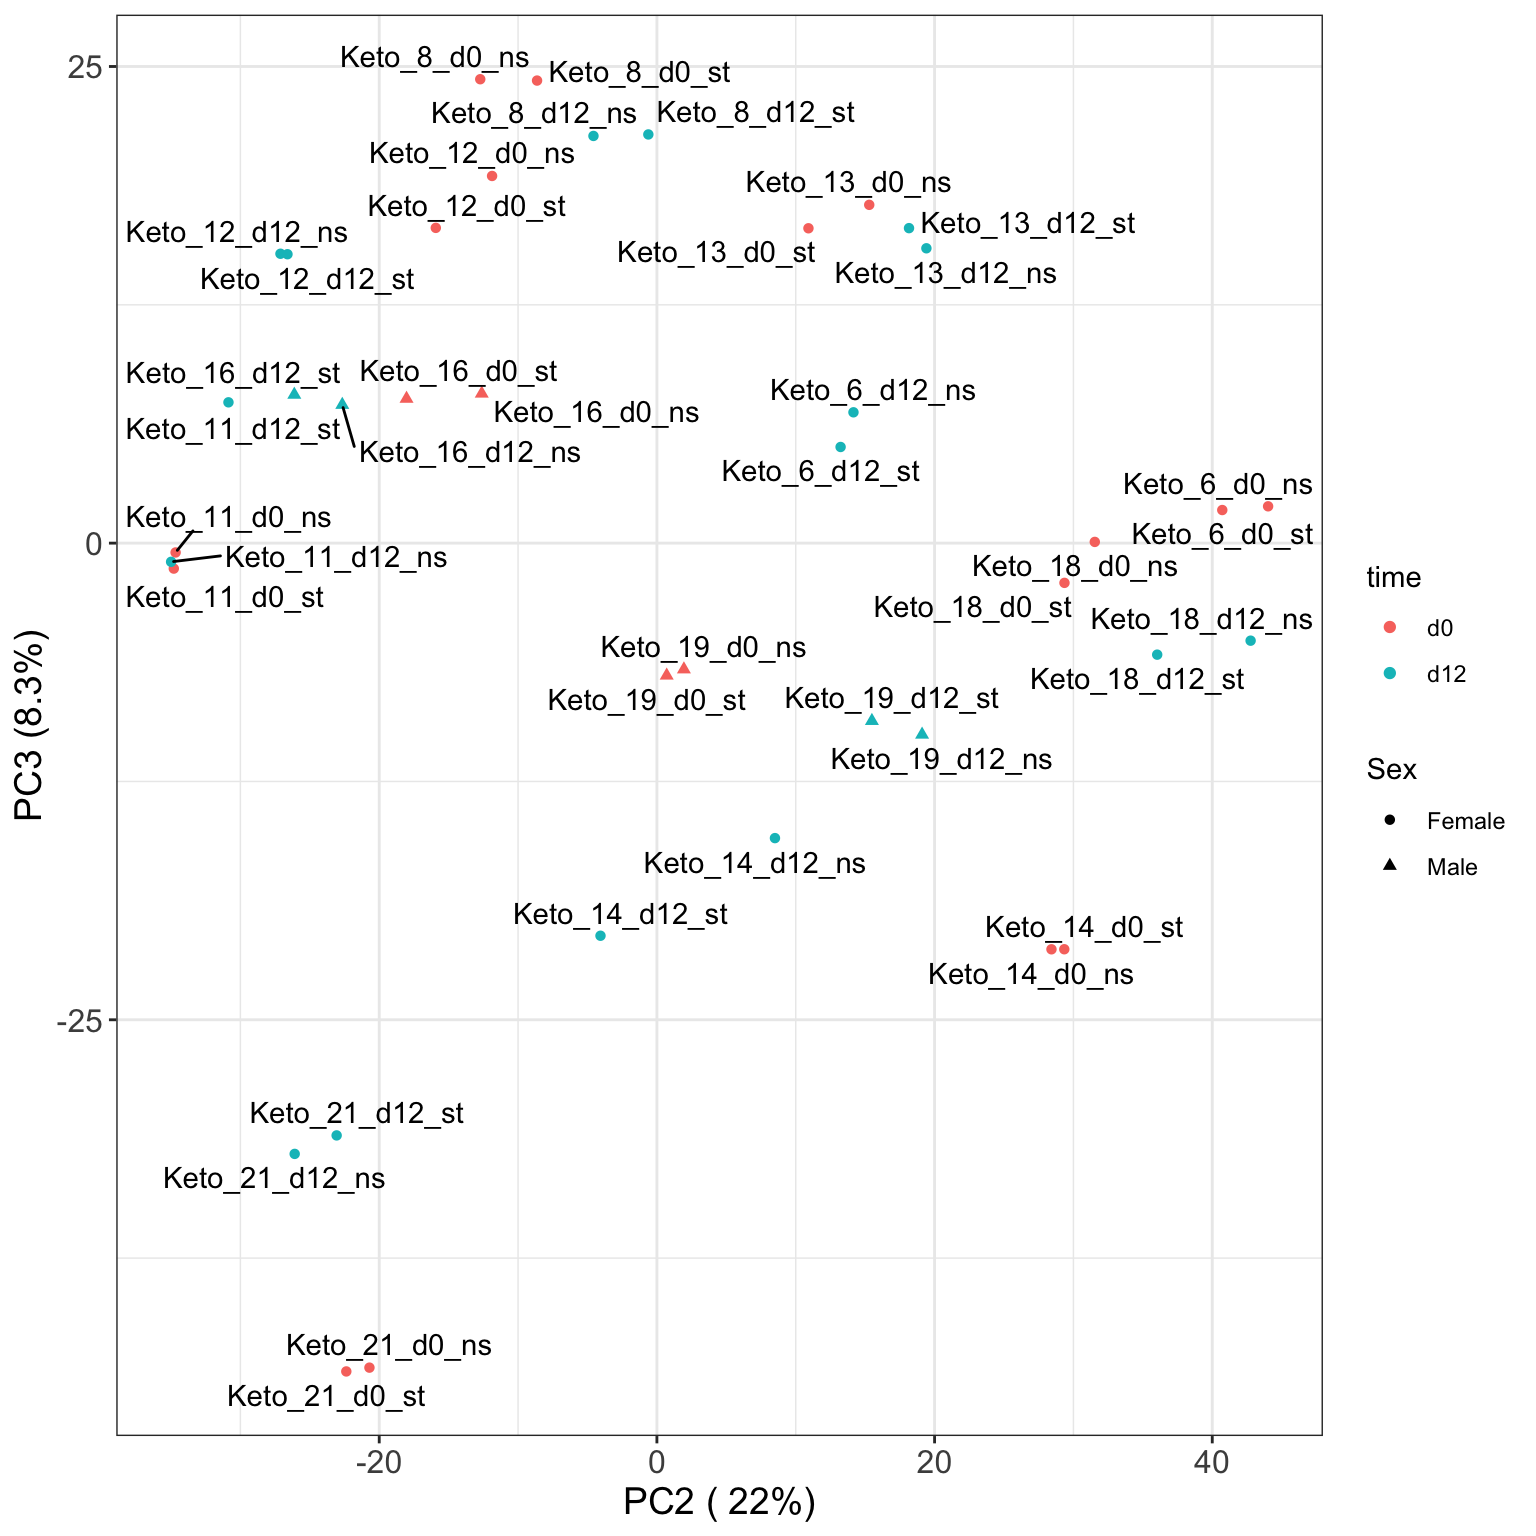
Without adjust for patient specific effect
Calculate PCA
PCA plots
PC1 versus PC2
PC3 versus PC4
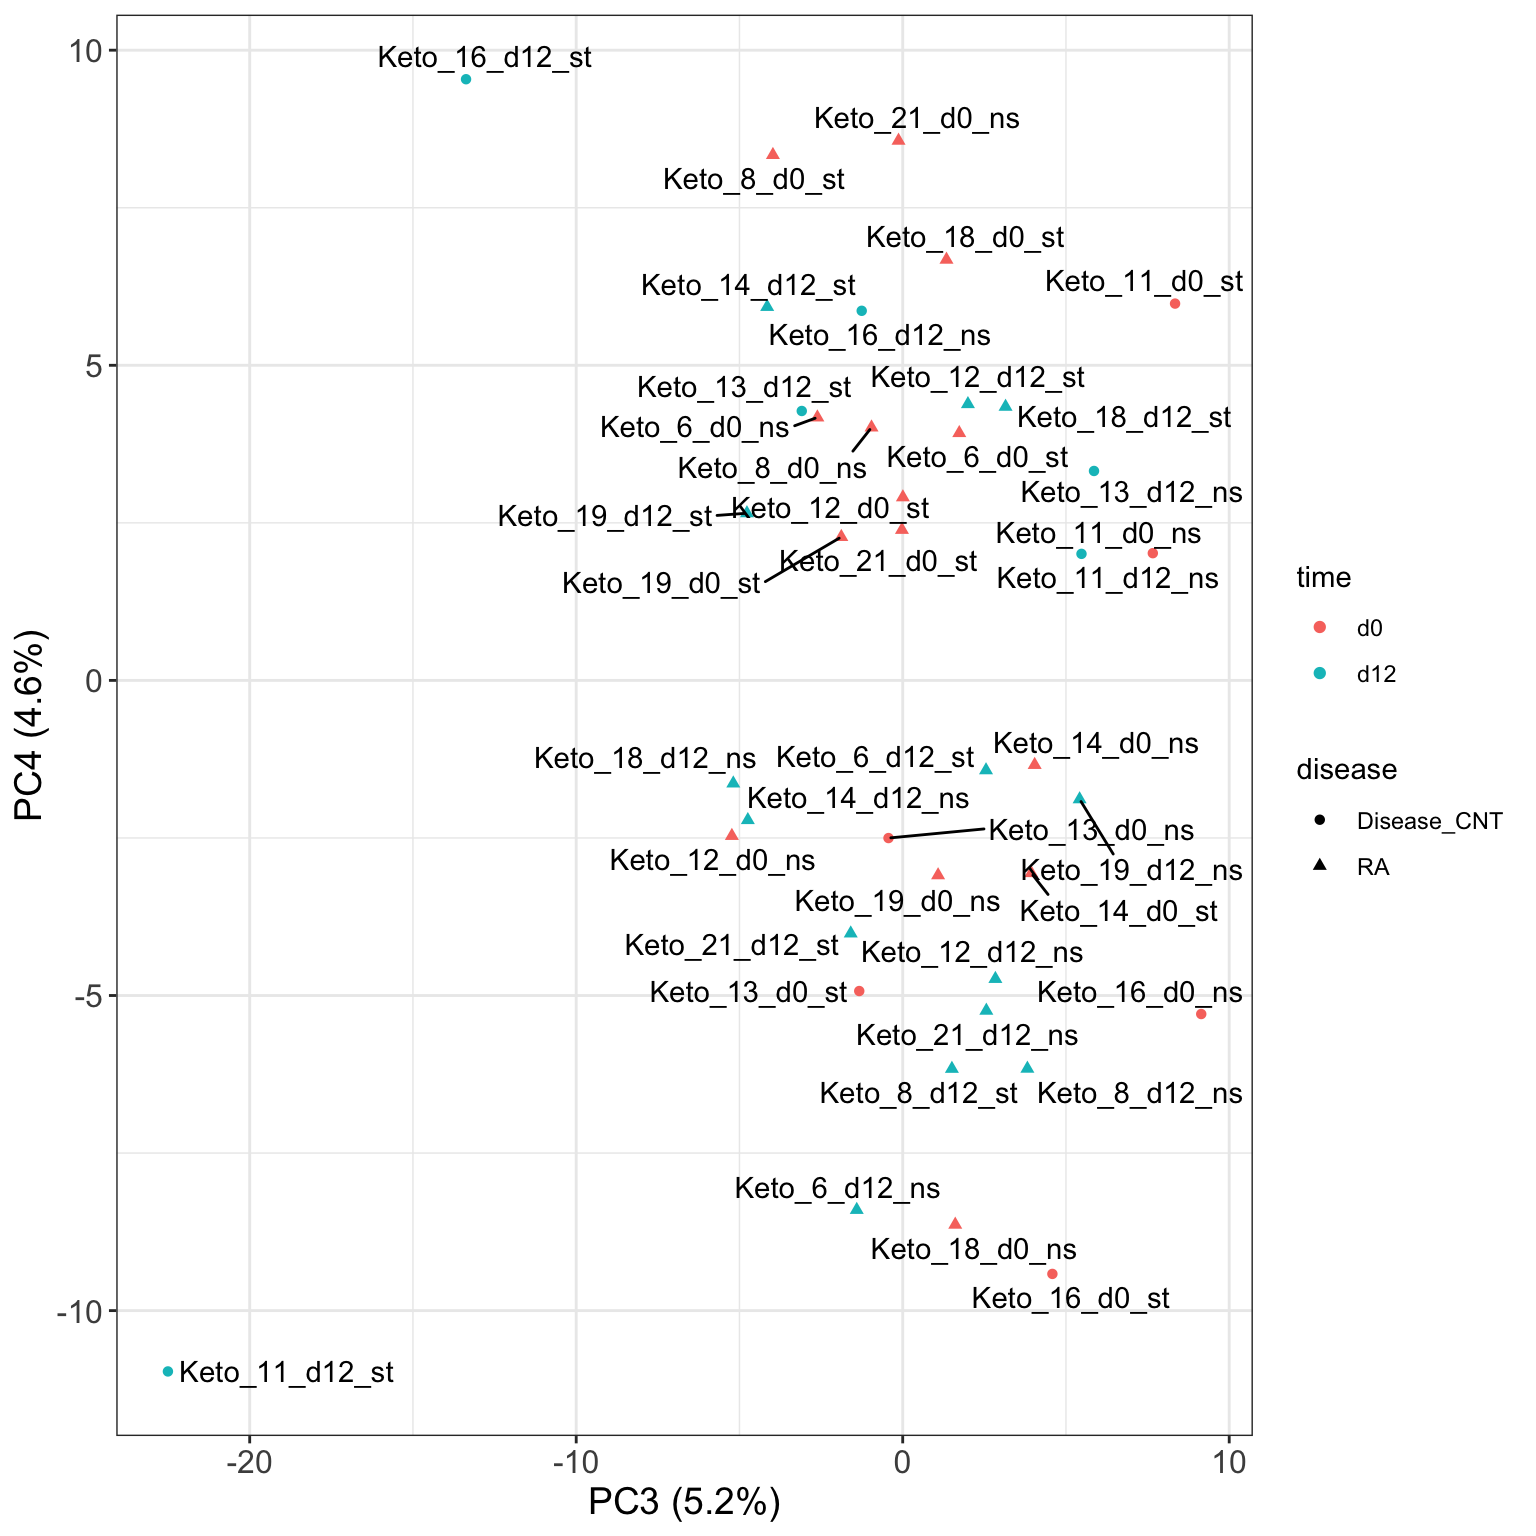
PCA with adjust for patient effect
Use combat to remove patient specific effect
Calculate PCA
PCA plots
PC1 versus PC2
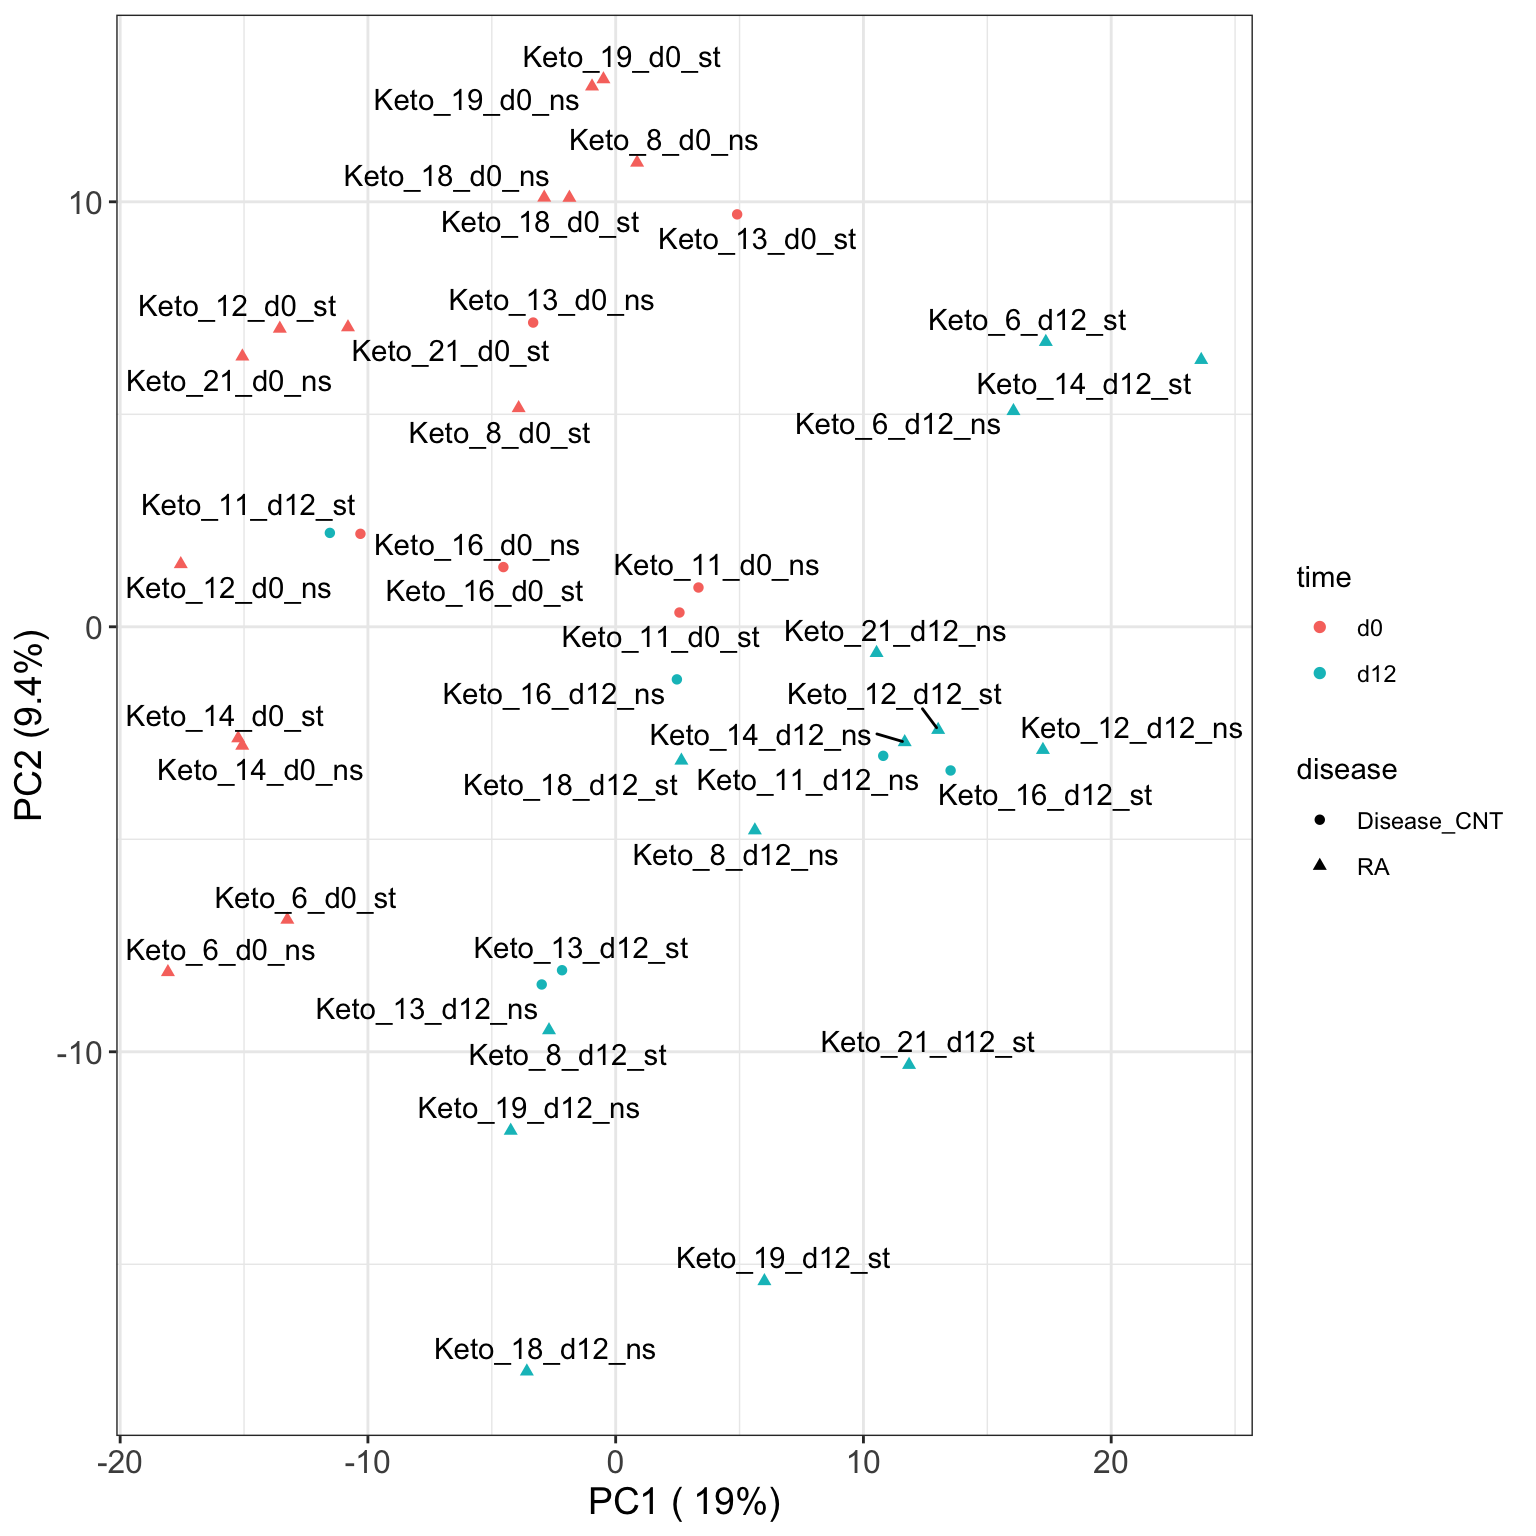
After adjust for patient specific effect, the time point effect can be clearly seen as PC1
PC3 versus PC4
Differential methylation analysis to identify methylation change over time
Sample size
, ,  = ns


              d0 d12
  Disease_CNT  3   3
  RA           7   7

, ,  = st


              d0 d12
  Disease_CNT  3   3
  RA           7   7
For comparisons in RA: 7 versus 7, for comparisons disease CNT: 3 versus 3. The statistical power could be a problem
In patient with RA
Non-stimulated samples
Subset
Perform differential methylation using limma
Stimulated samples
Subset
Perform differential methylation using limma
Stimulated versus non-stimulated at day 0
Subset
Perform differential methylation using limma
Stimulated versus non-stimulated at day 12
Subset
Perform differential methylation using limma
Block for time or stimulation or test for their interaction
Subset
Perform differential methylation using limma
In patient with disease control
Non-stimulated samples
Subset
Perform differential methylation using limma
Stimulated samples
Subset
Perform differential methylation using limma
Stimulated versus non-stimulated at day 0
Subset
Perform differential methylation using limma
Stimulated versus non-stimulated at day 12
Subset
Perform differential methylation using limma
Block for time or stimulation or test for their interaction
Subset
Perform differential methylation using limma
Compare RA and CNT using mixed-effect model with interaction
Without stimulation
Subset
Perform differential methylation using limma
With stimulation
Subset
Perform differential methylation using limma
Summarise the comparison results
P-value histogram
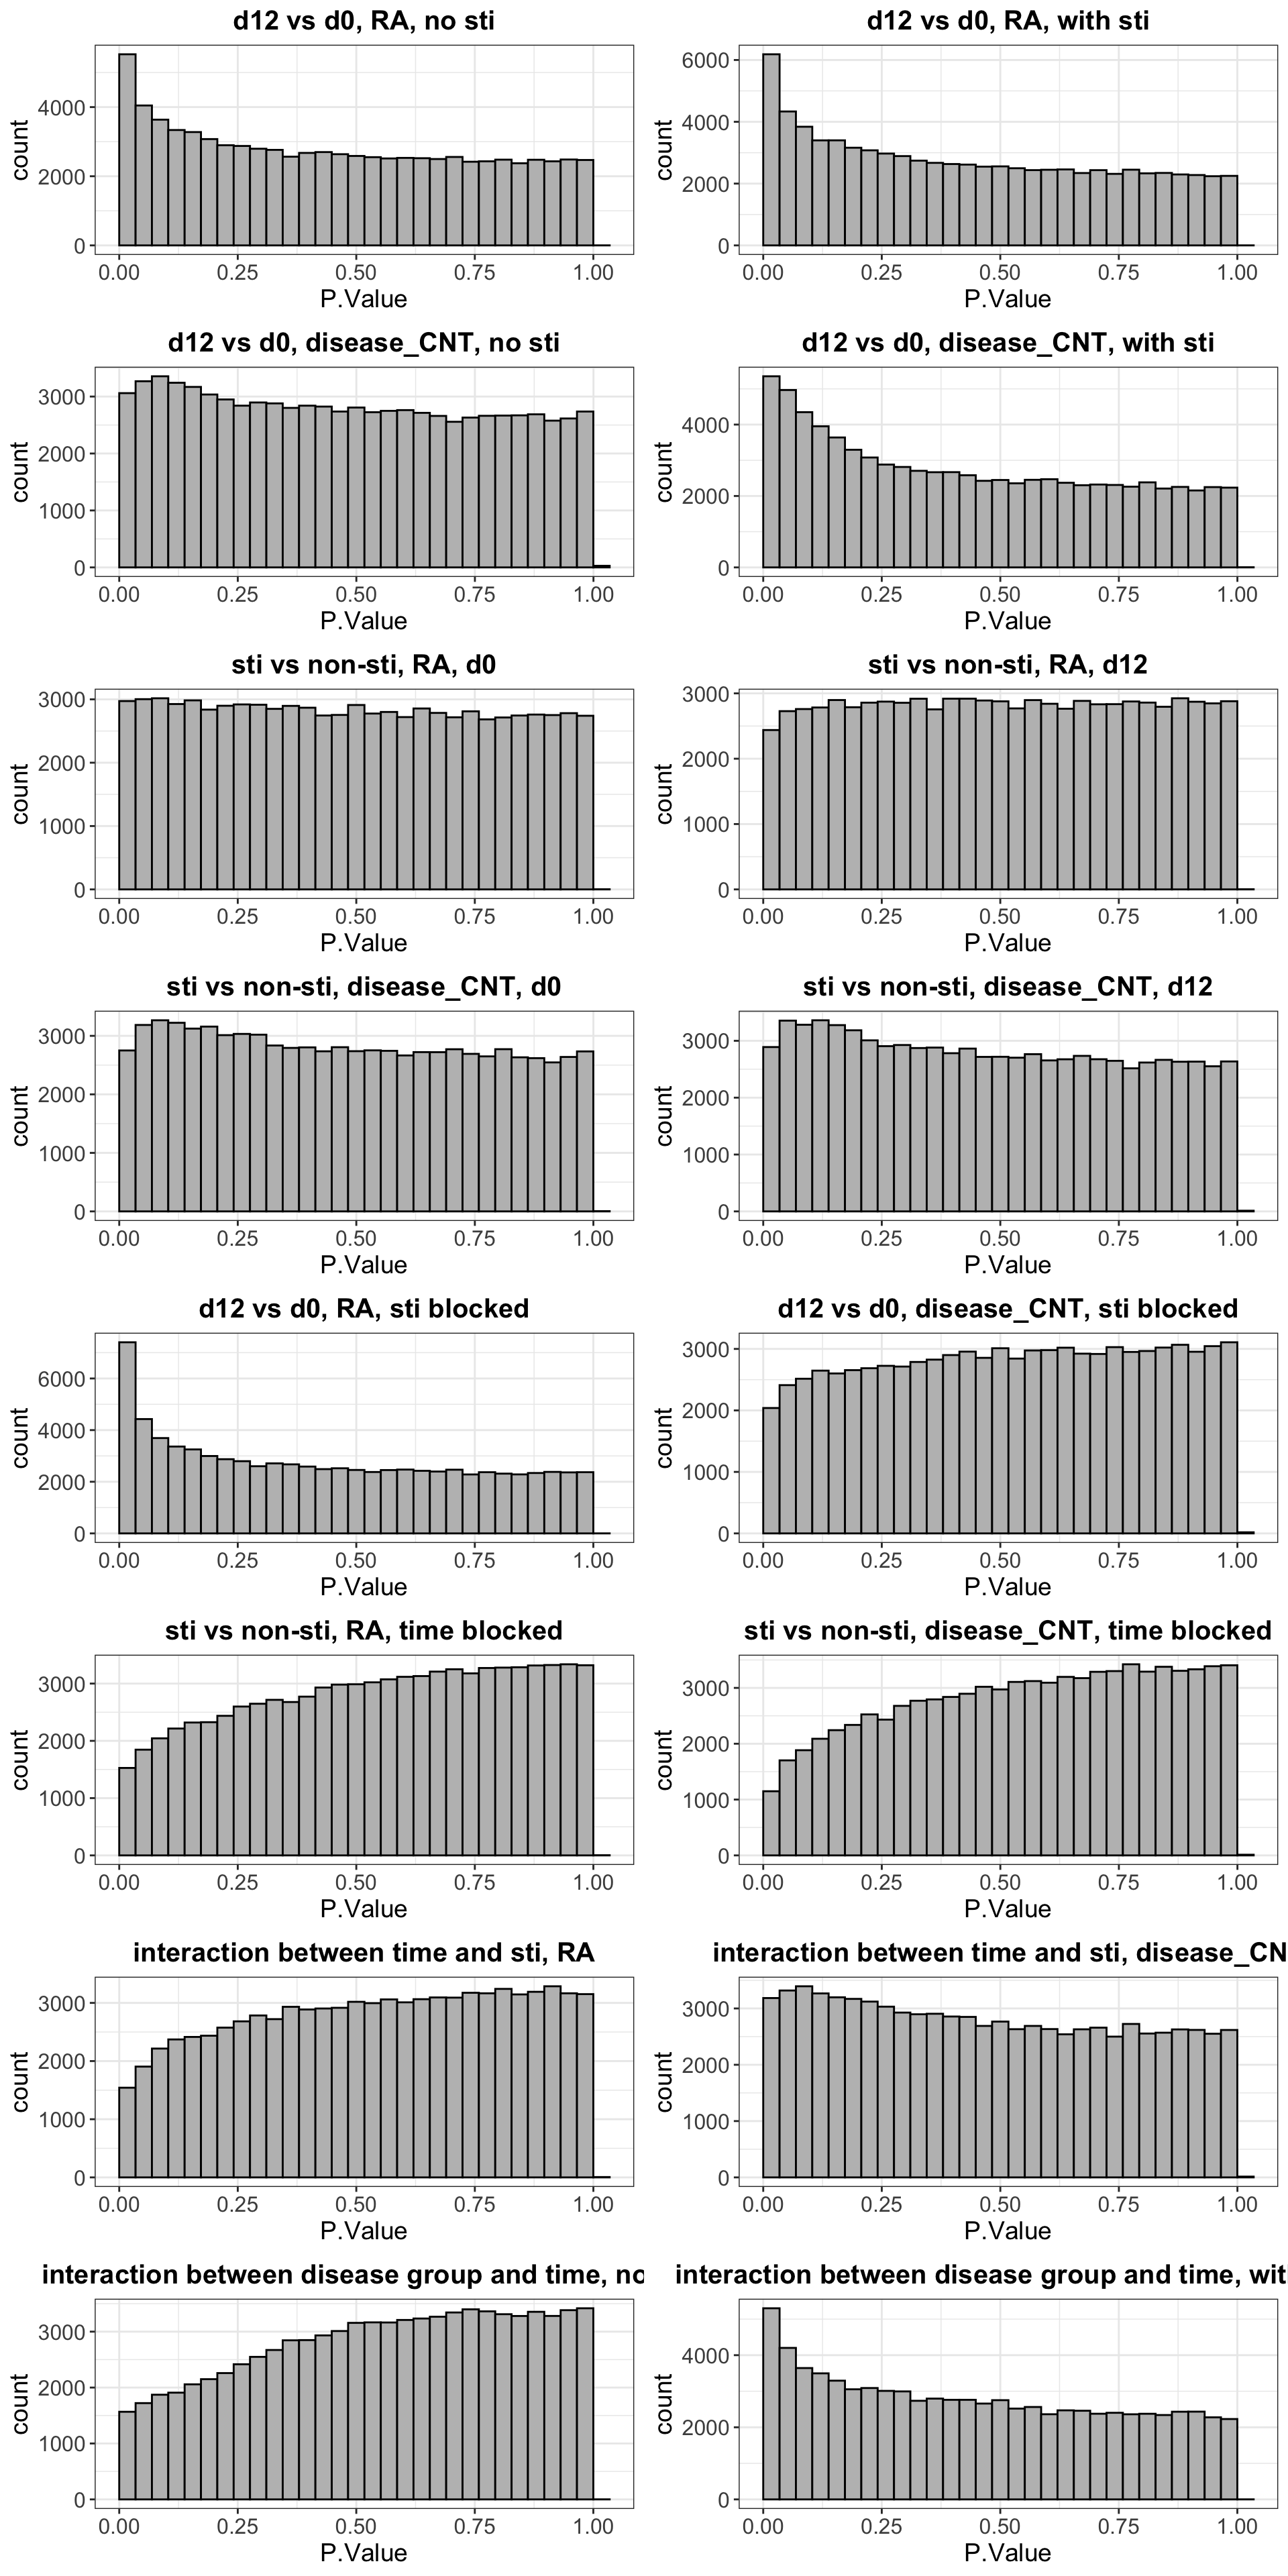 If the p-value histogram has a peak on the left, it indicates
there’s more like a real difference. If the histogram is largely flat,
perhaps the difference is not strong
If the p-value histogram has a peak on the left, it indicates
there’s more like a real difference. If the histogram is largely flat,
perhaps the difference is not strong
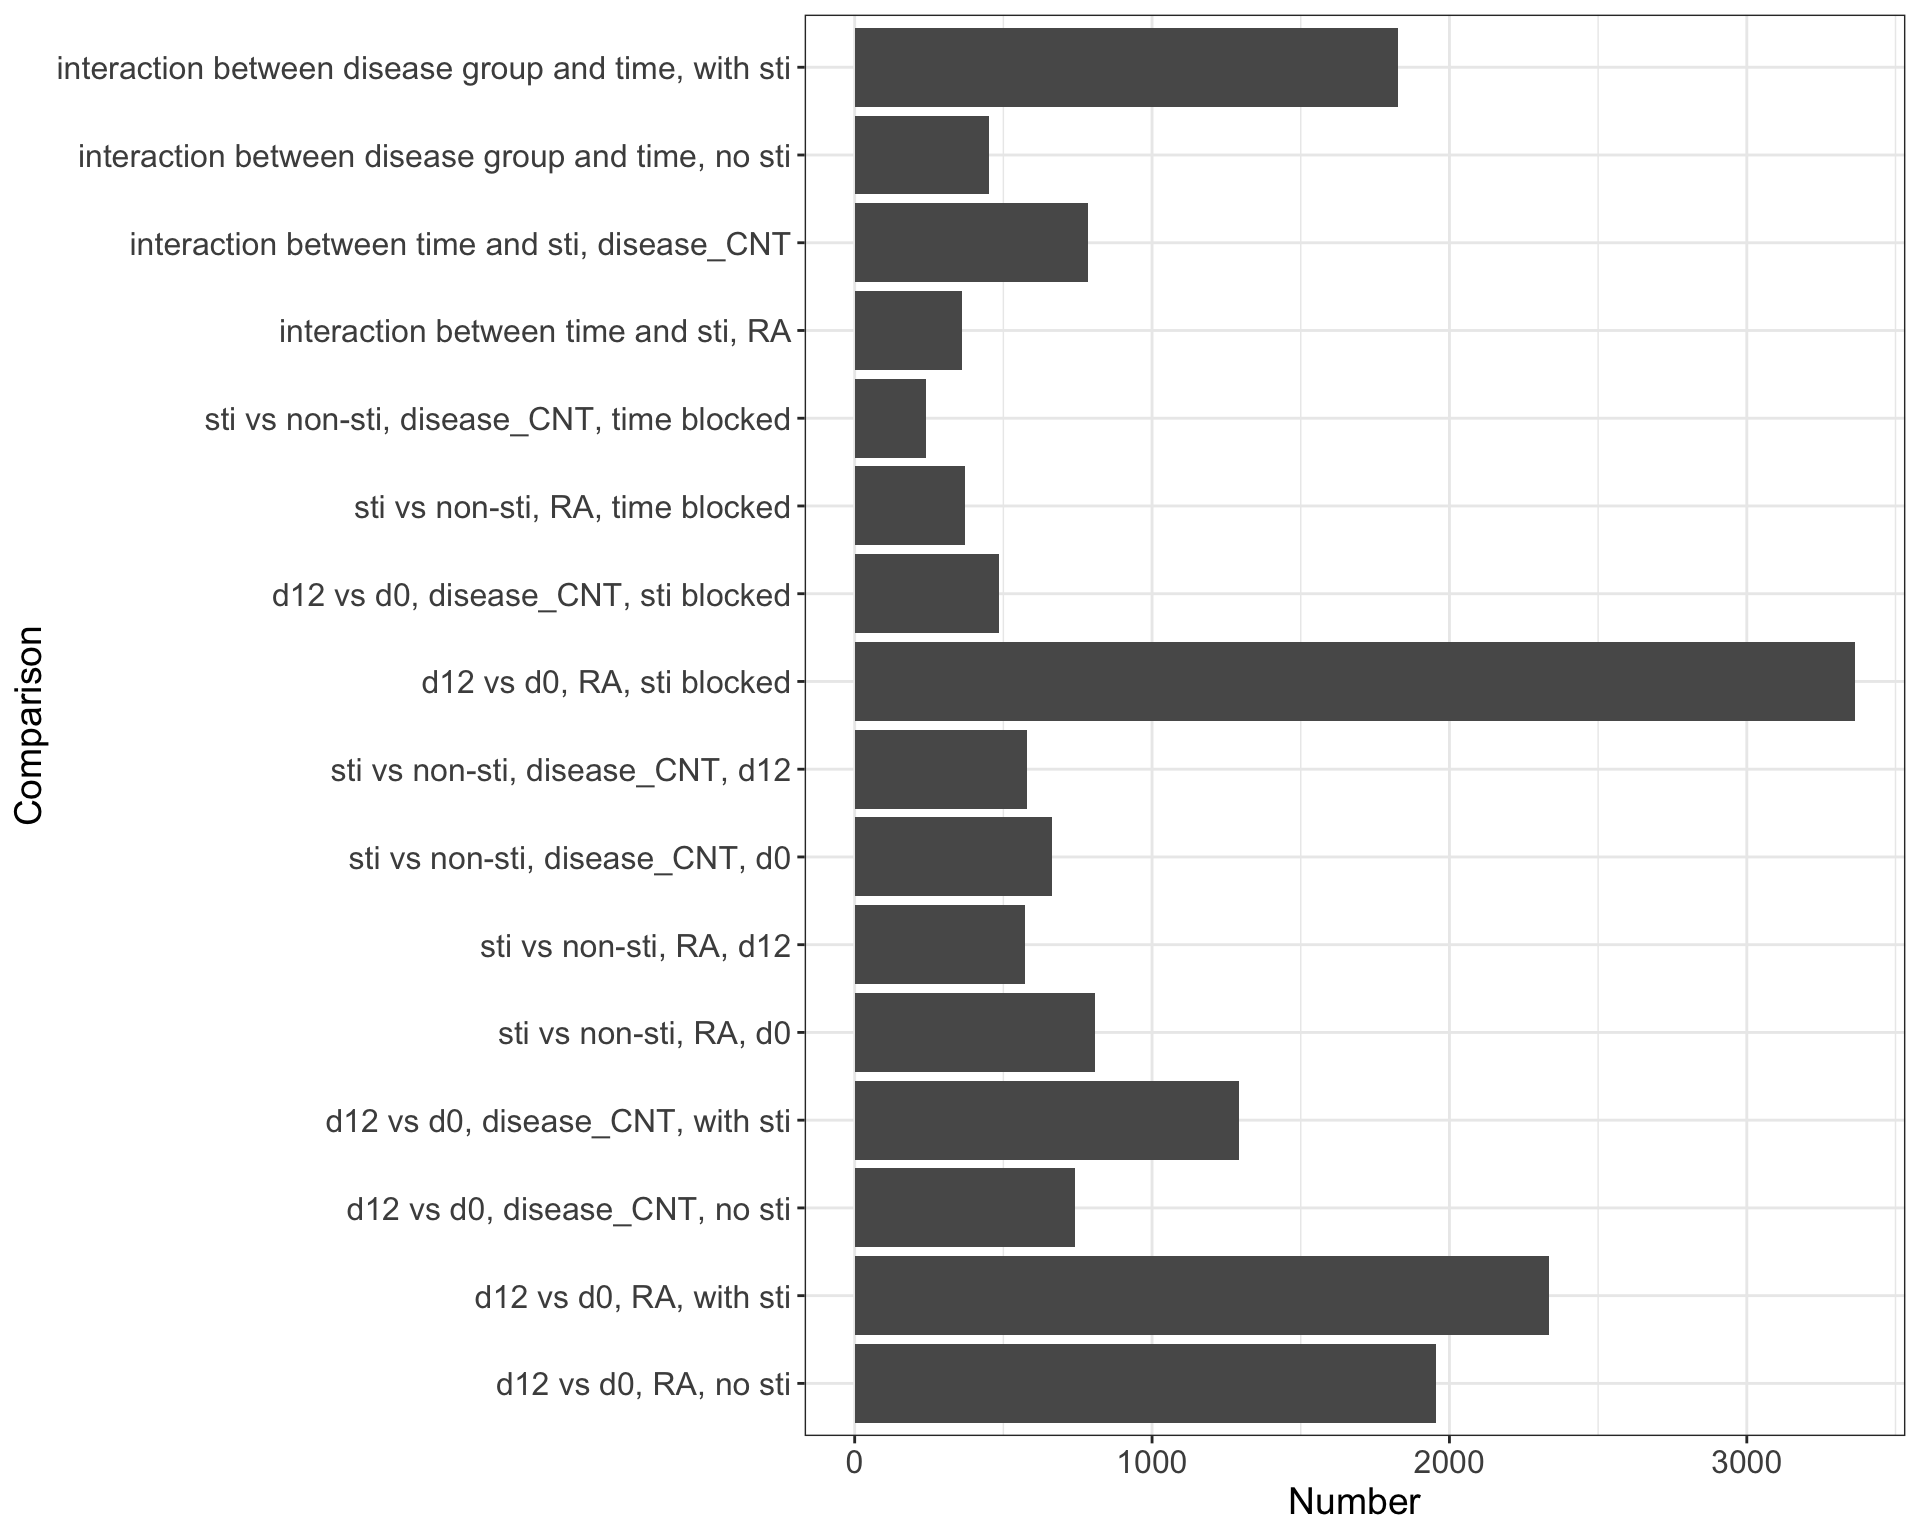
Number of significant associations with raw P.Value < 0.01
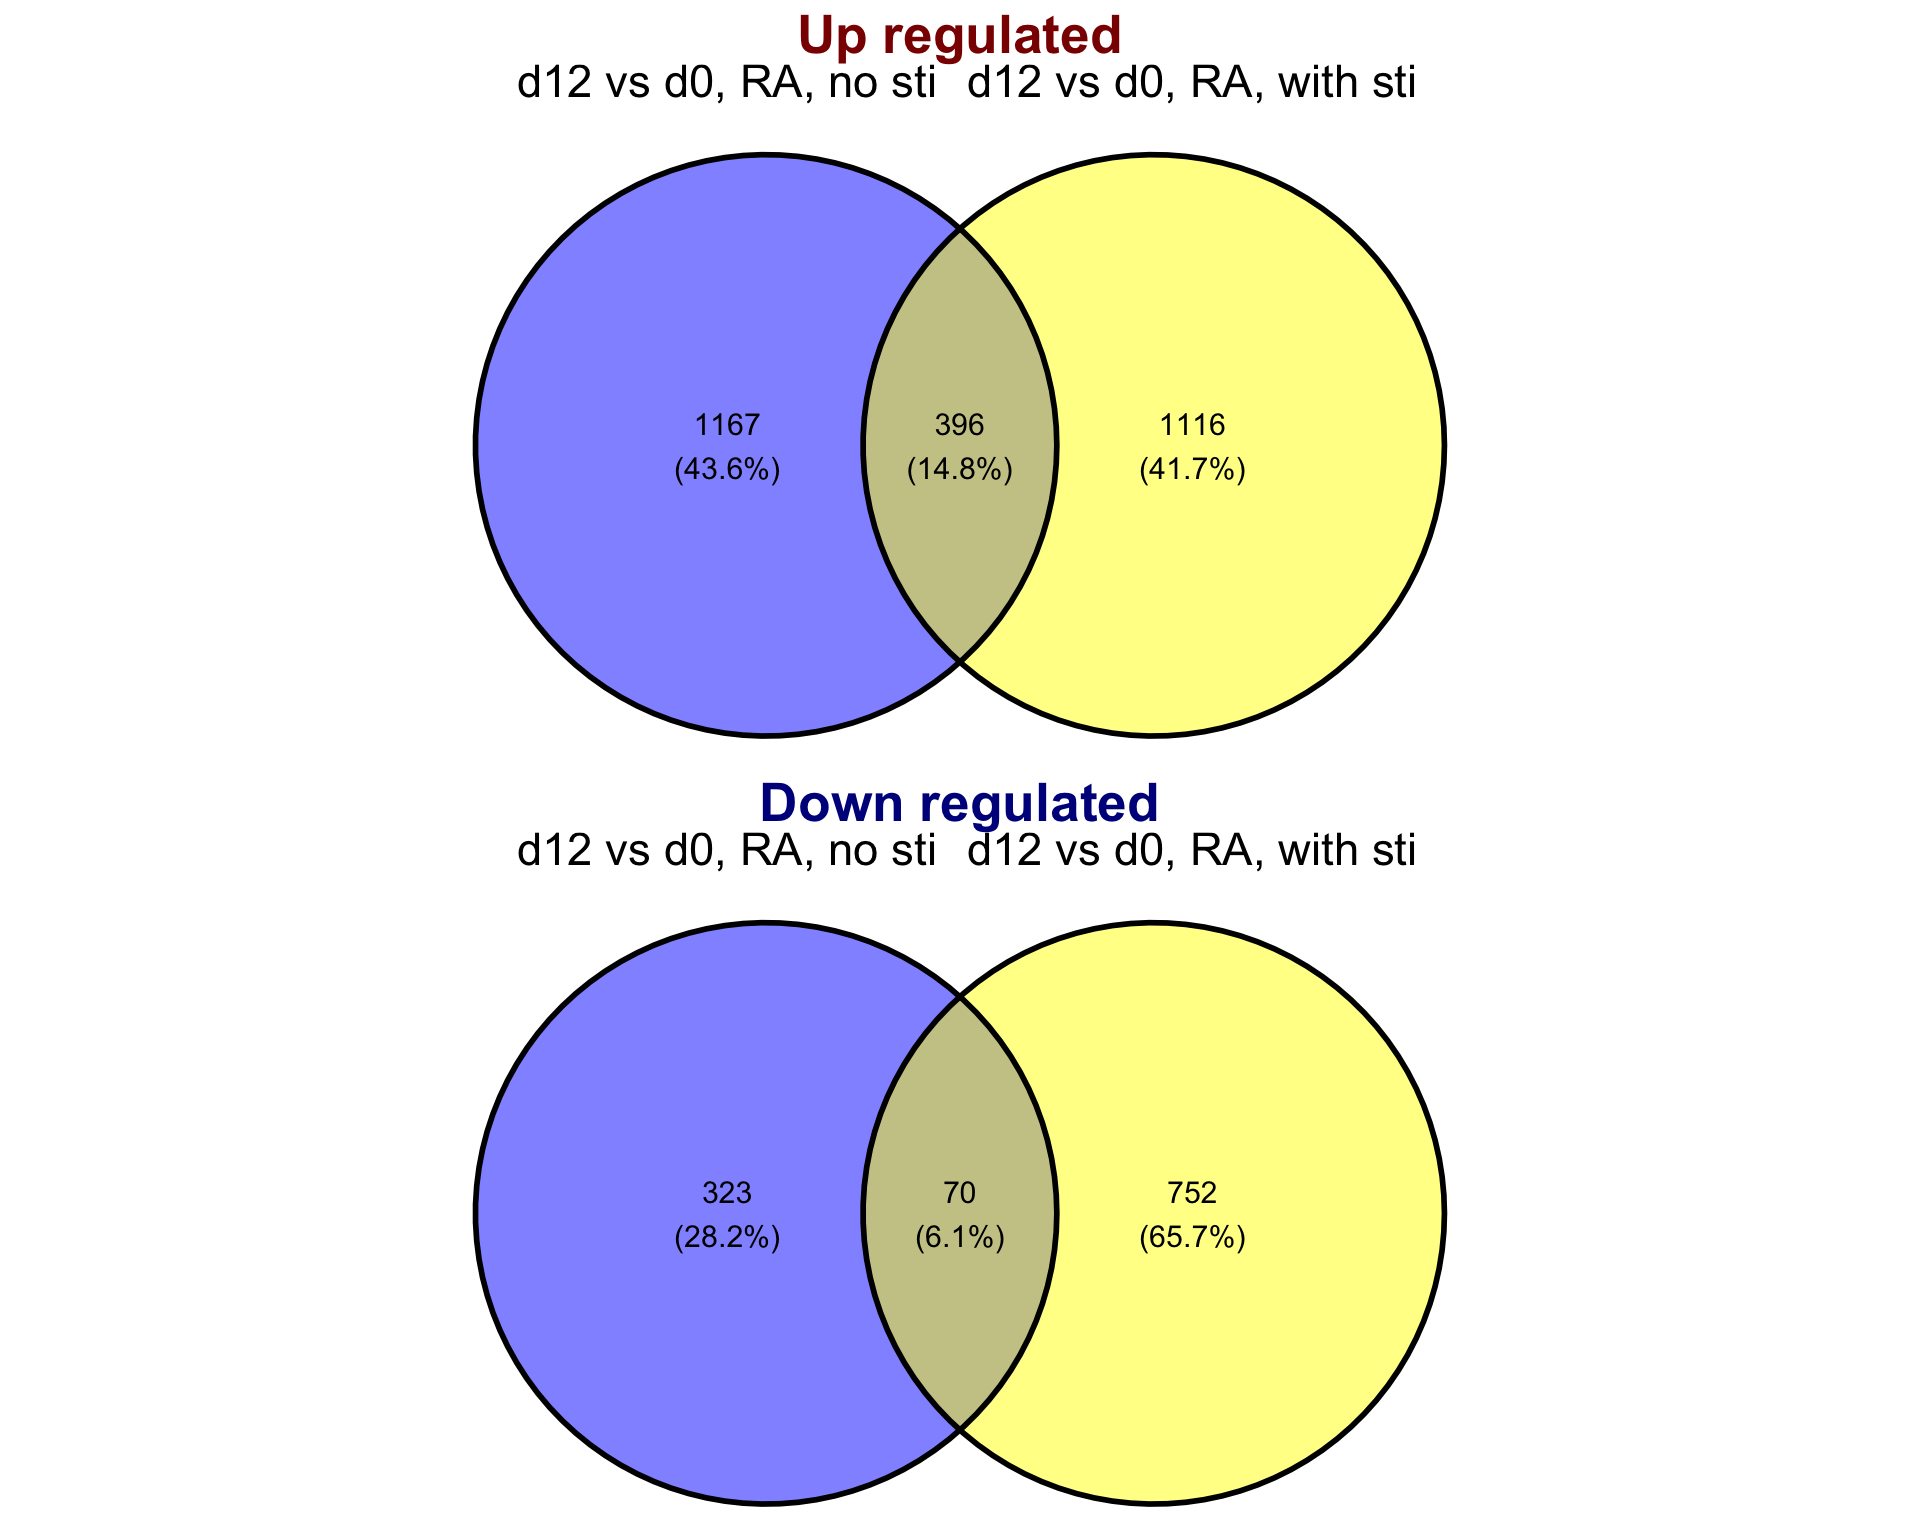
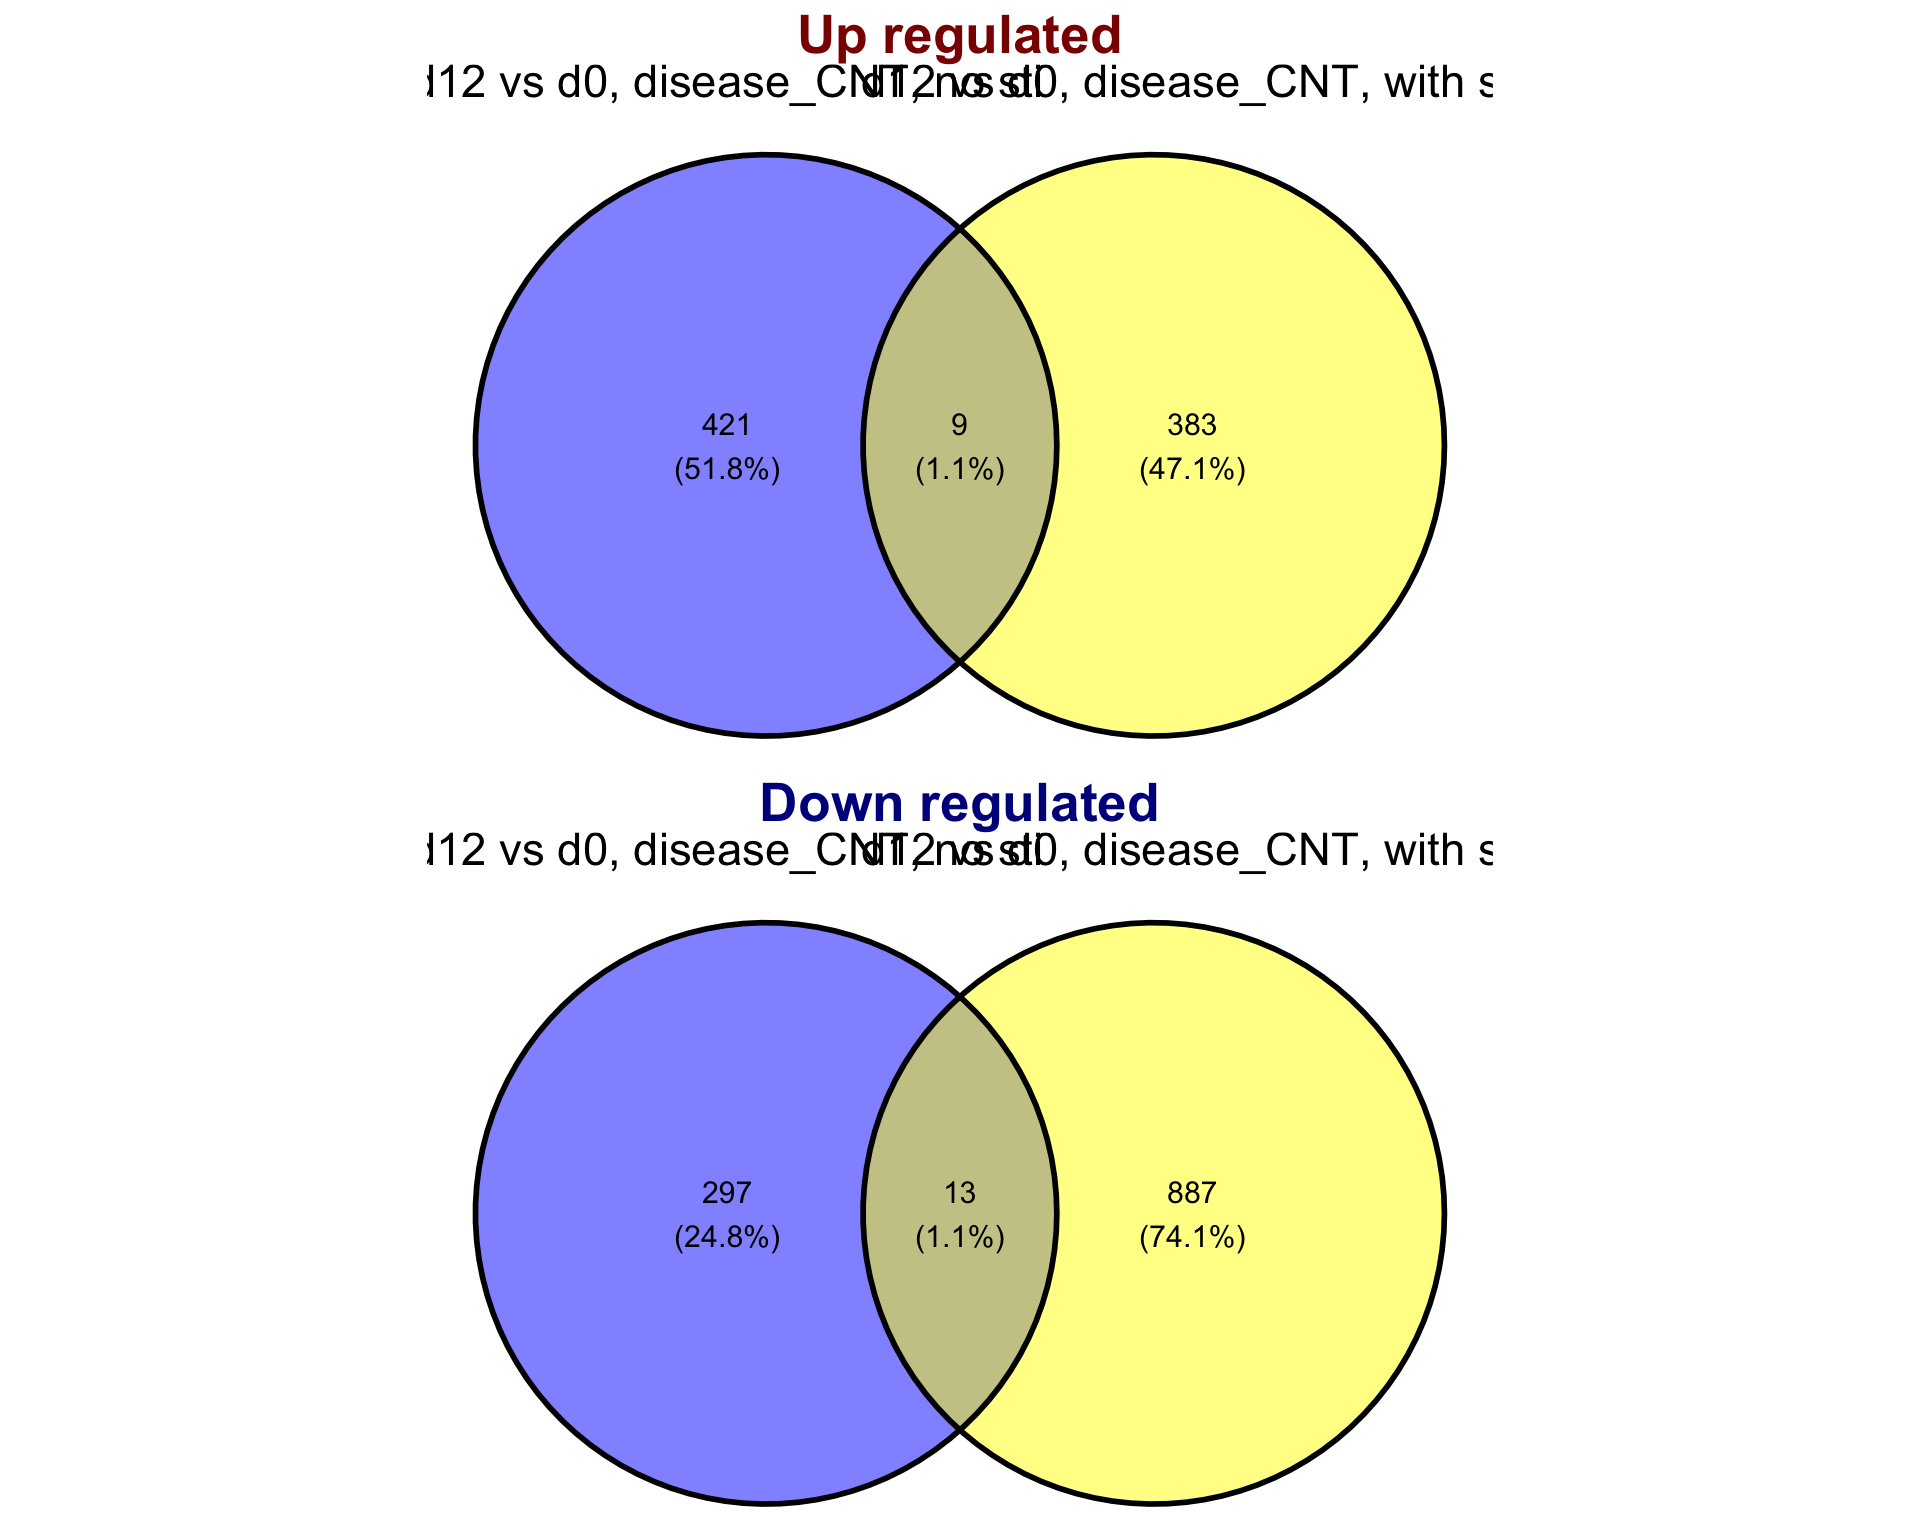
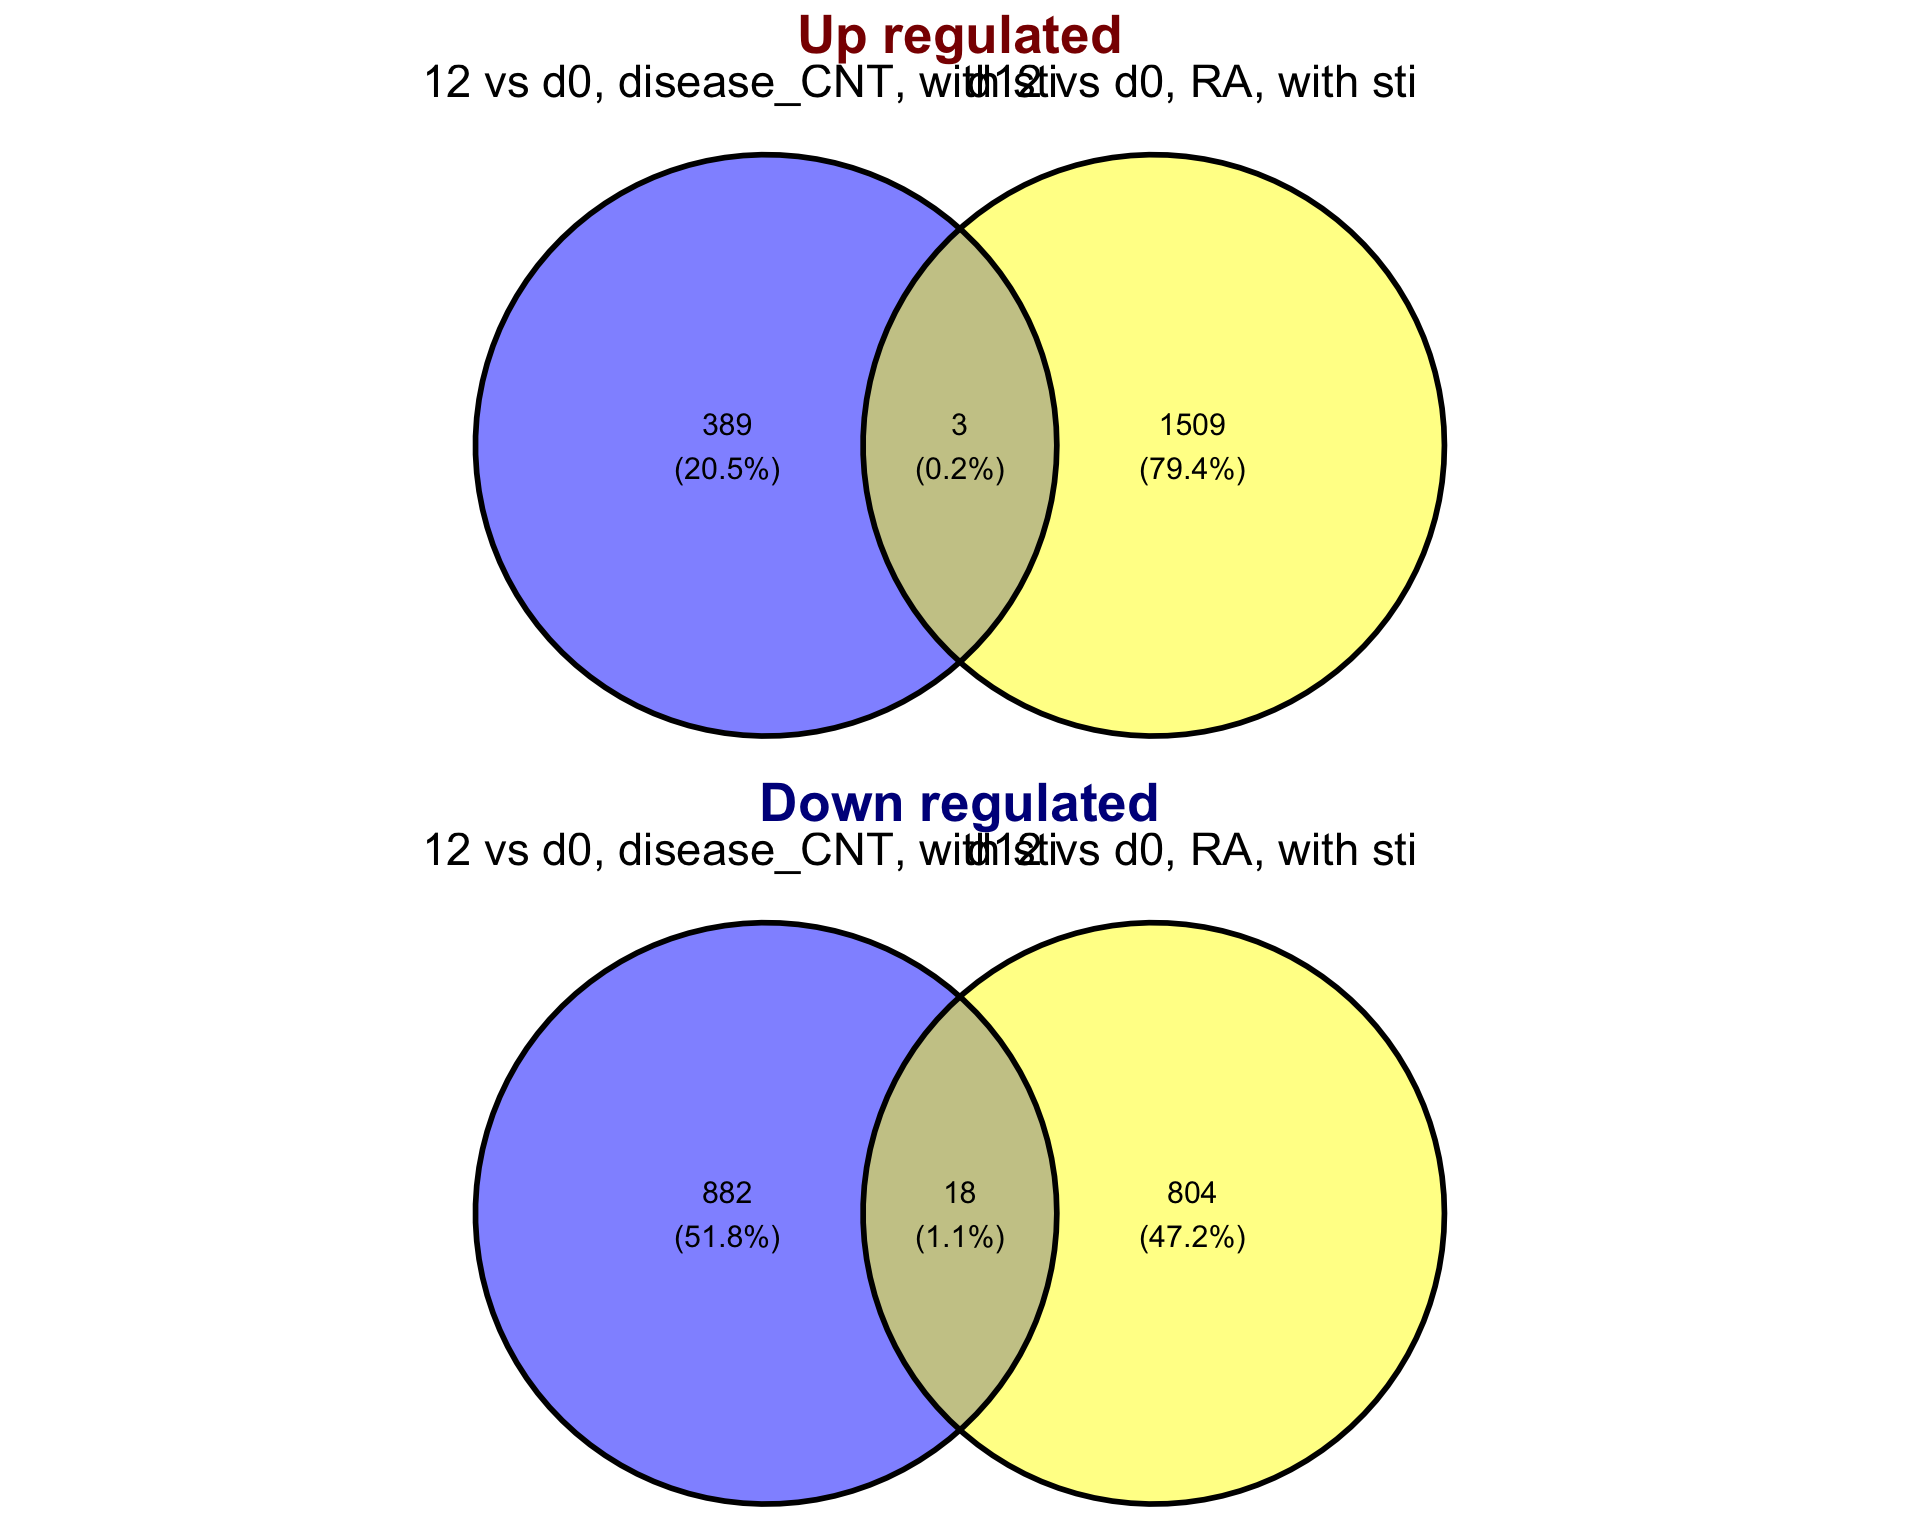
Compare the overlap of differential methylation CpGs with Venn diagram
In RA samples, d12 versus d0, compare with and without stimulation
In control samples, d12 versus d0, compare with and without stimulation
d12 versus d0, without stimulation, compare RA and CNT

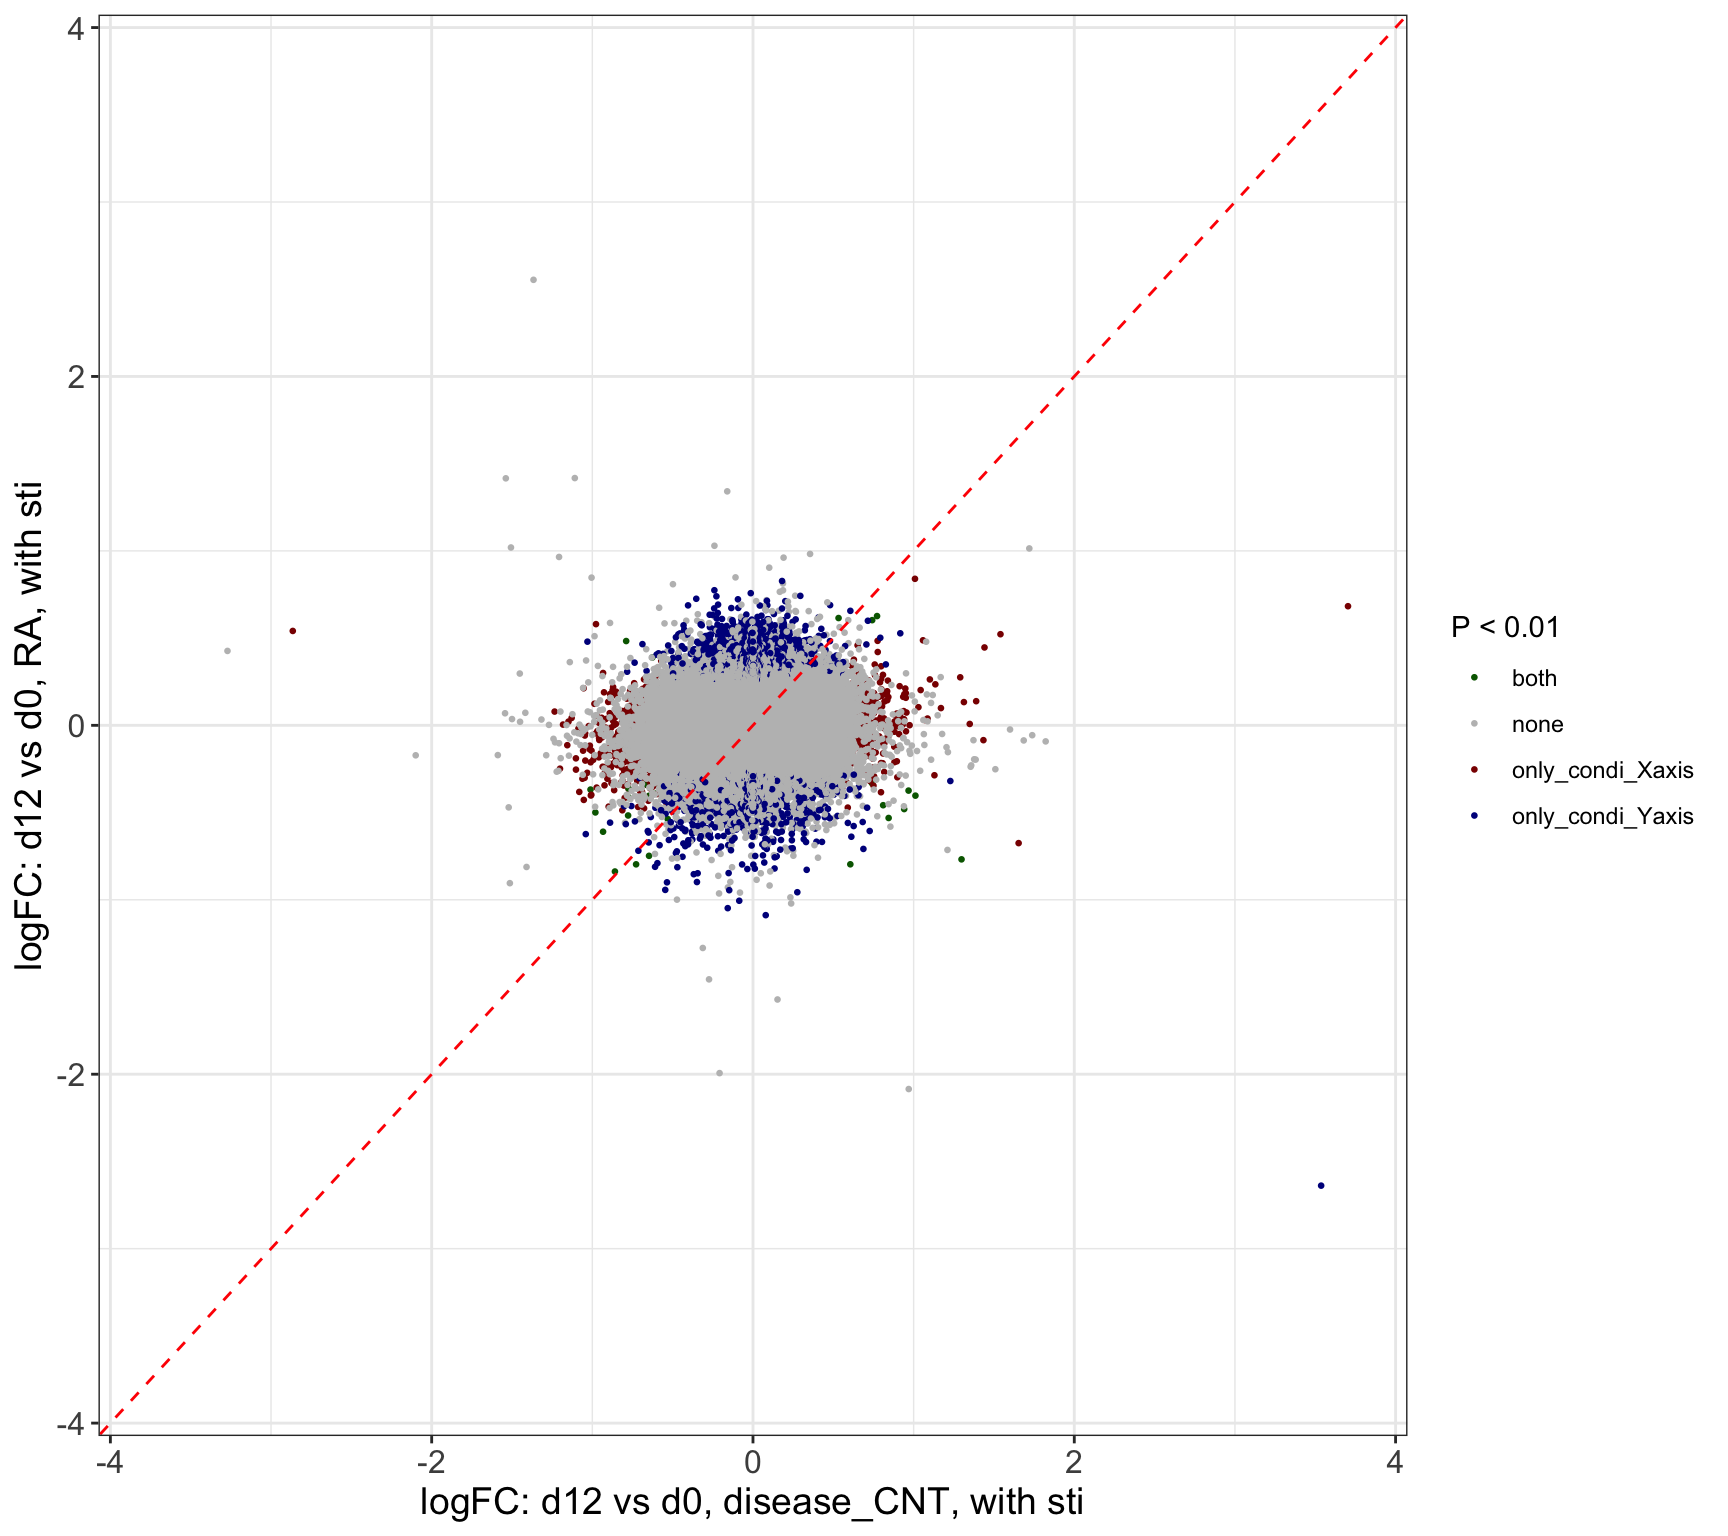
d12 versus d0, with stimulation, compare RA and CNT
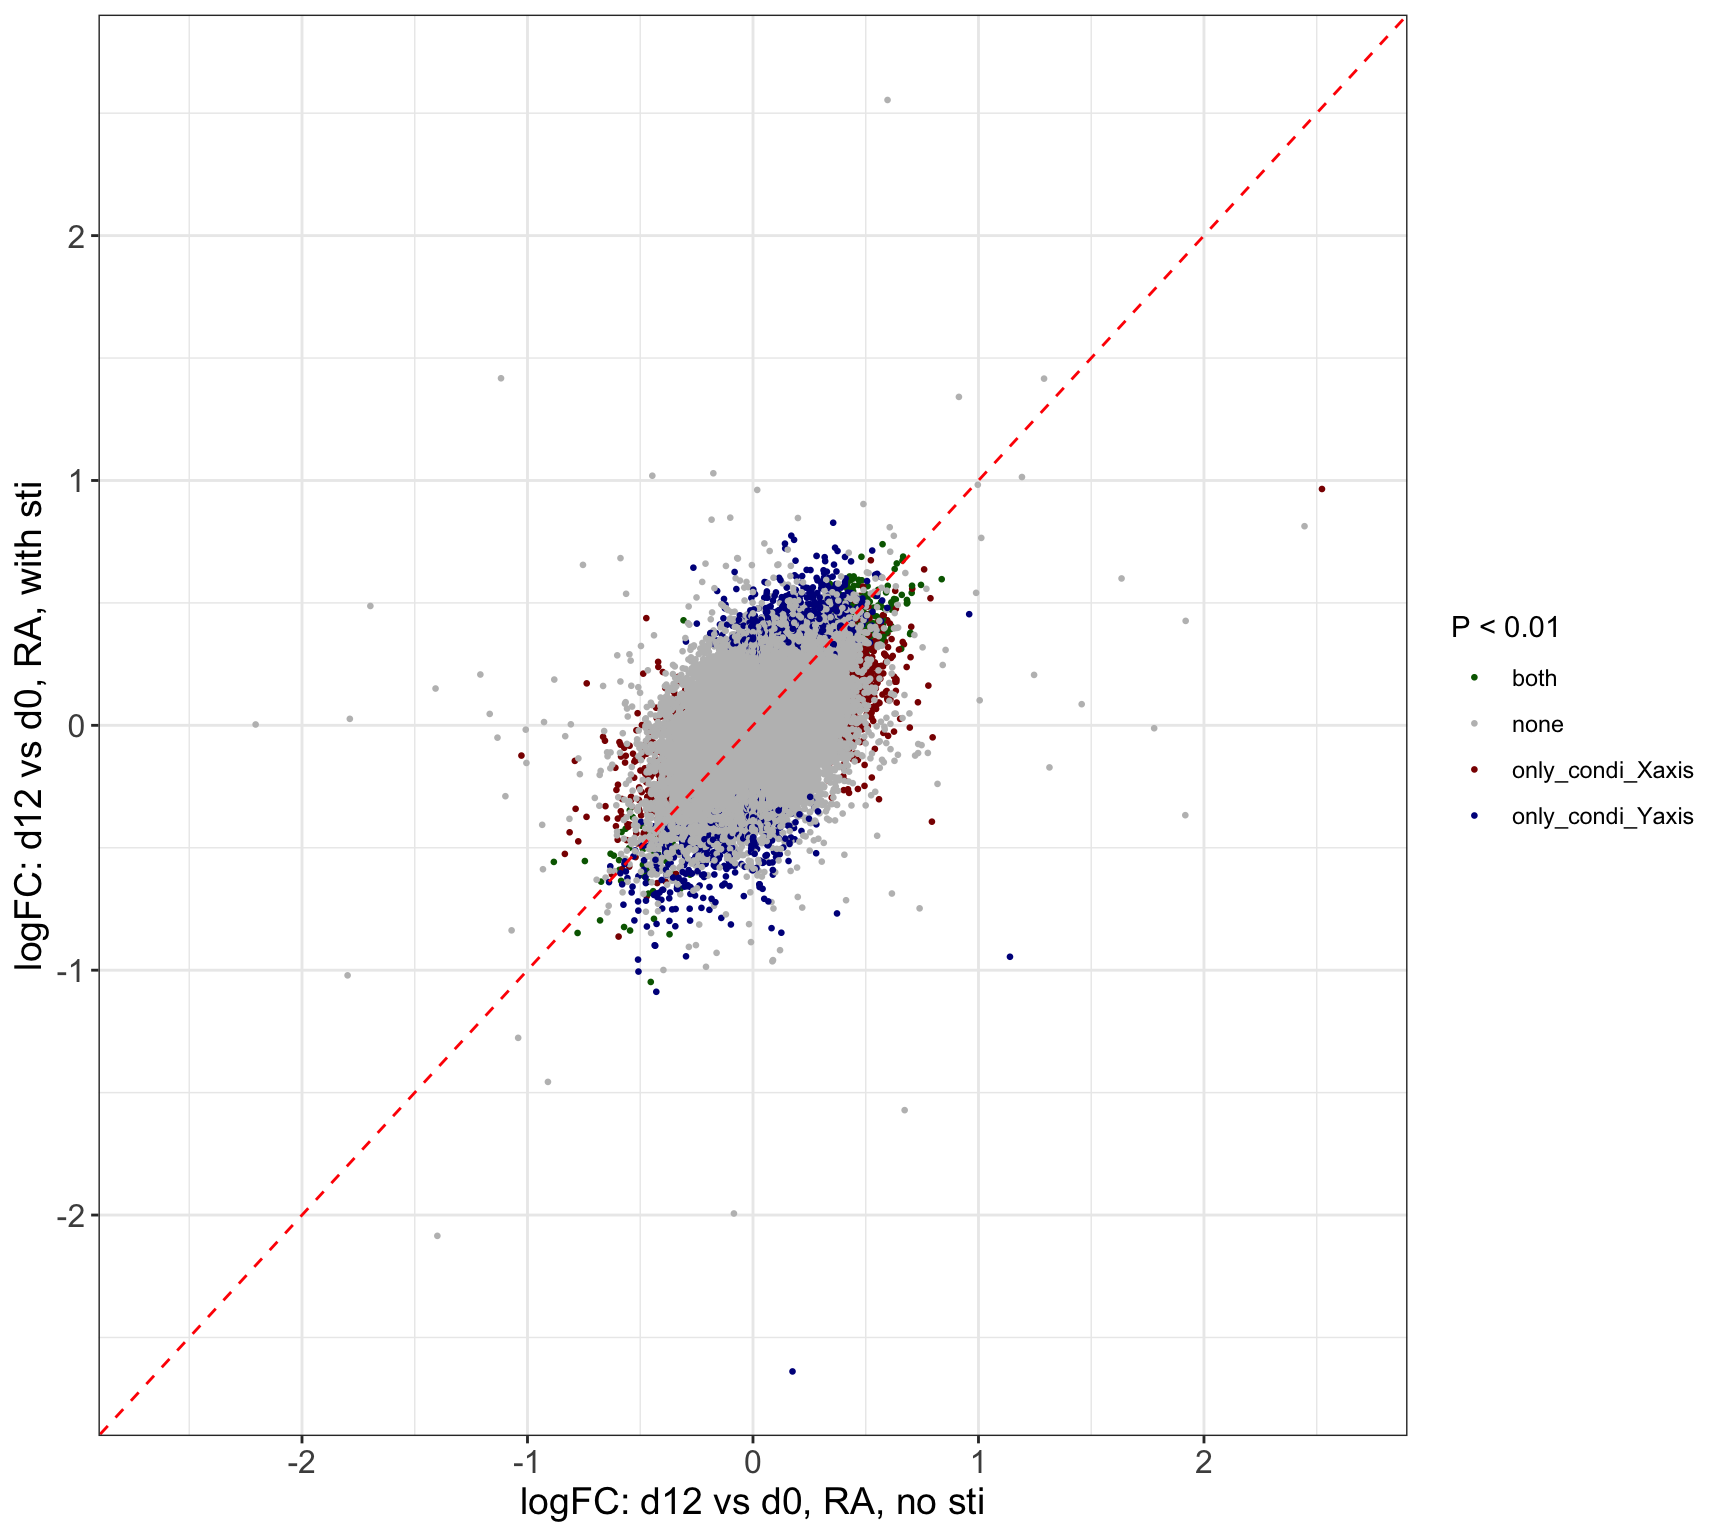
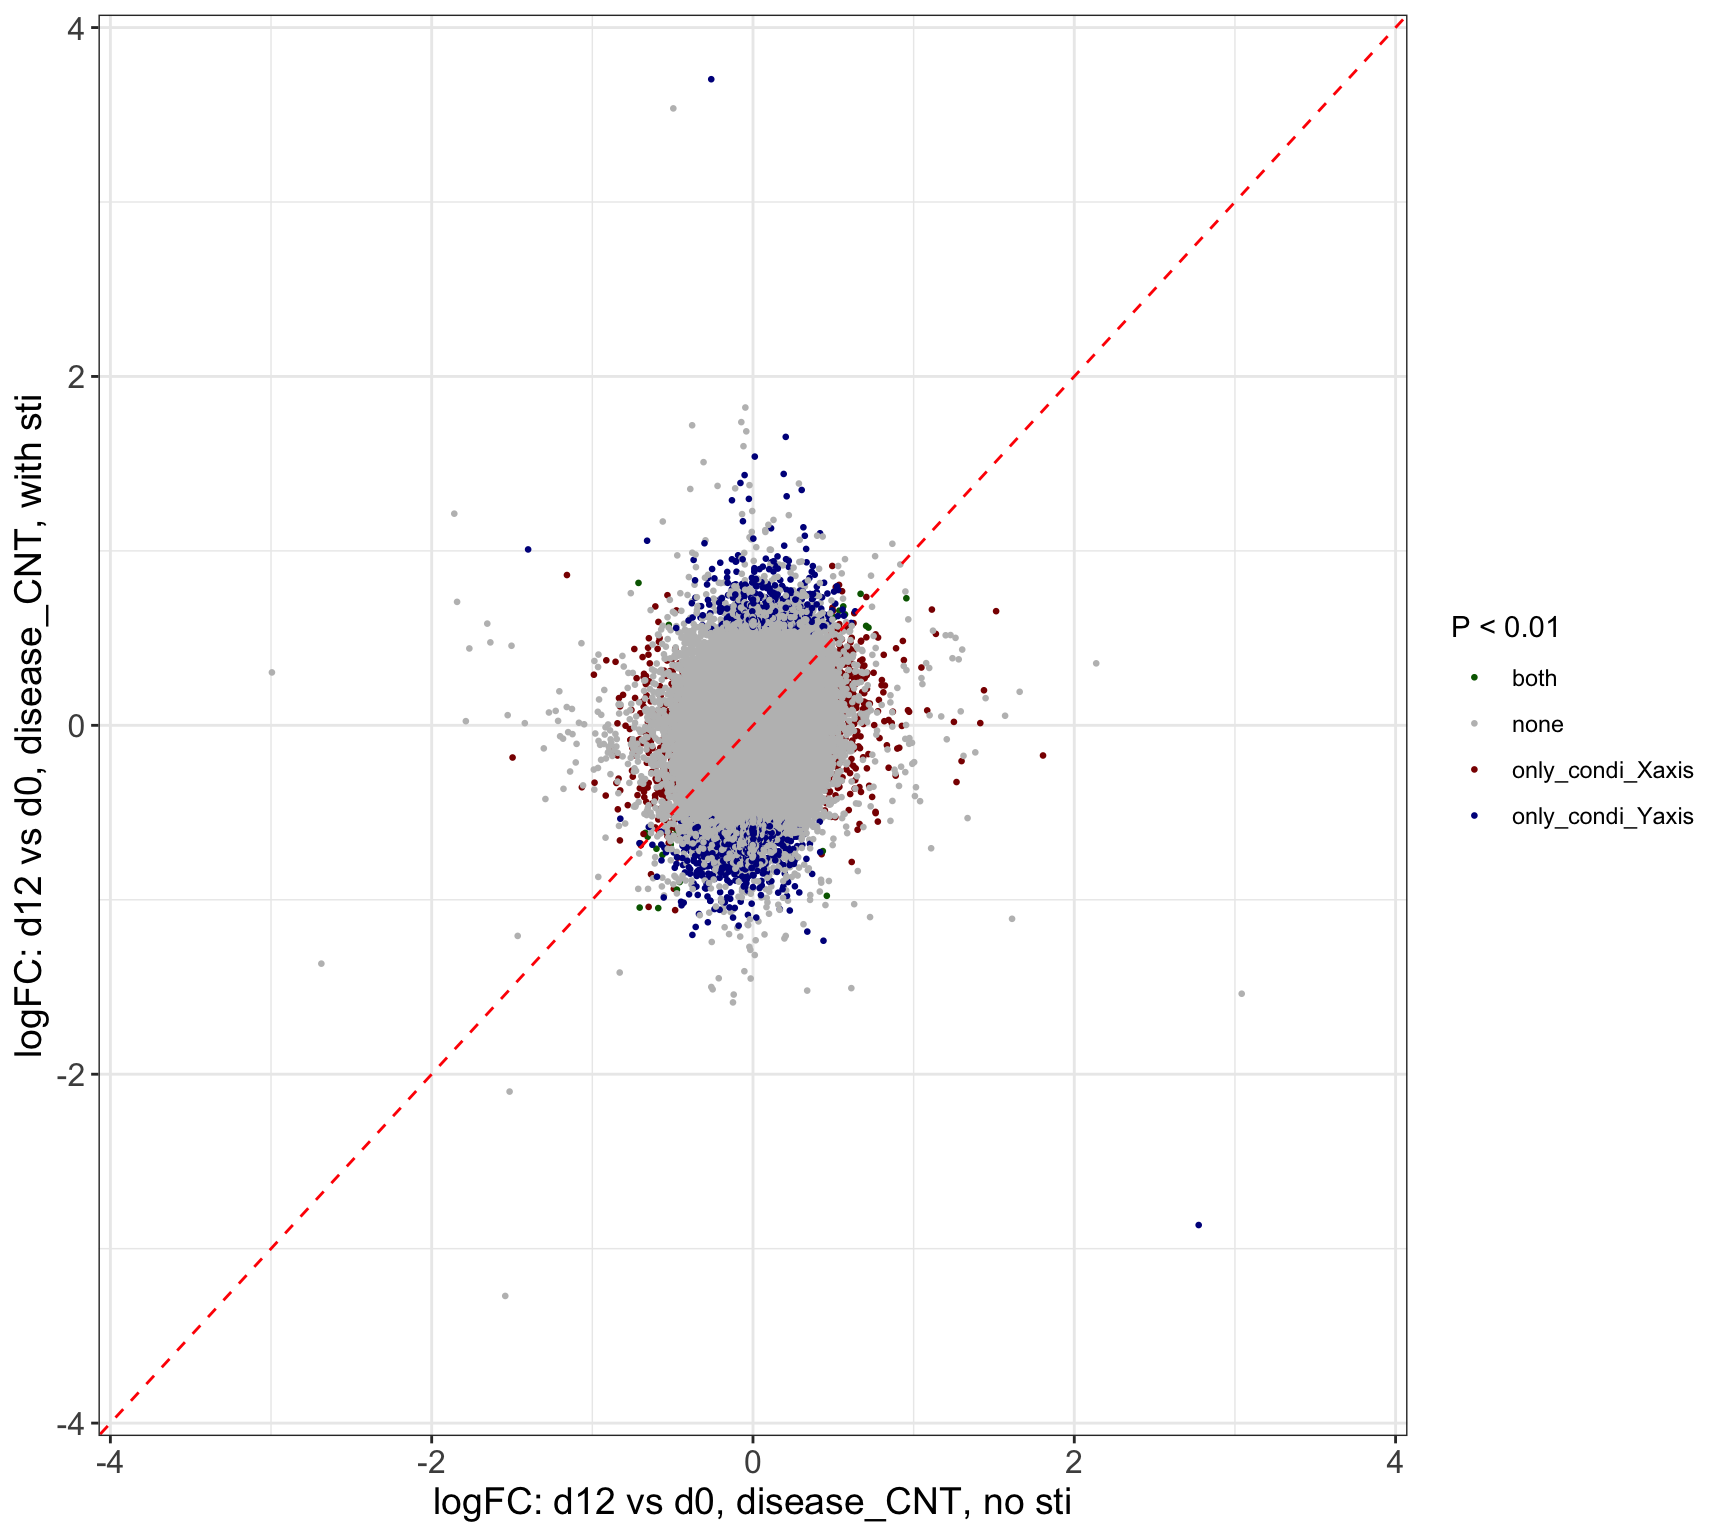
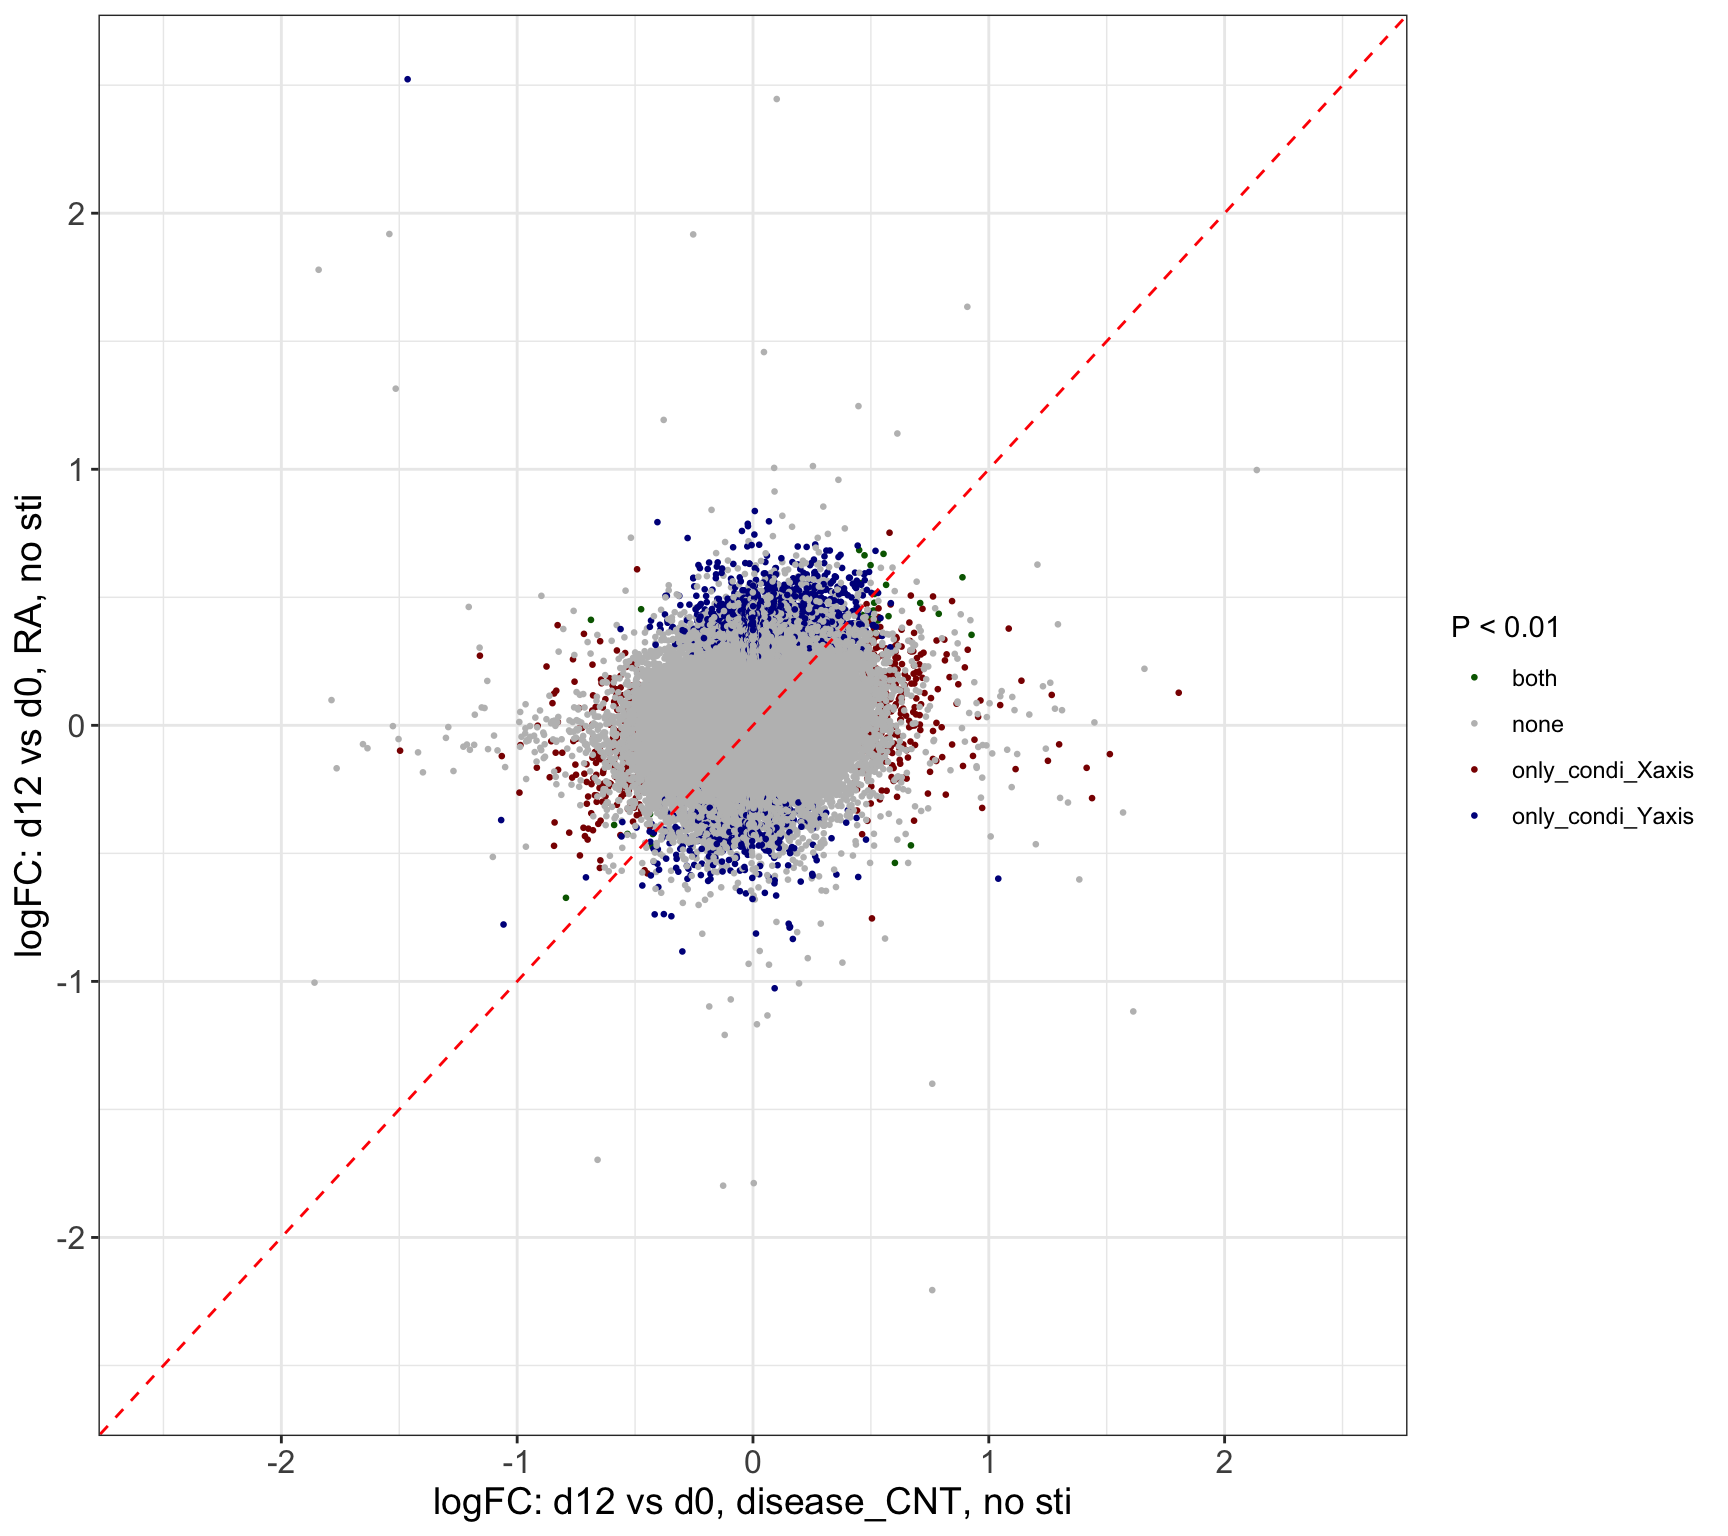
Scatter plot for comparison
In RA samples, d12 versus d0, compare with and without stimulation
In control samples, d12 versus d0, compare with and without stimulation
d12 versus d0, without stimulation, compare RA and CNT
d12 versus d0, with stimulation, compare RA and CNT
Visualize CpGs show interaction with disease group
No stimulation
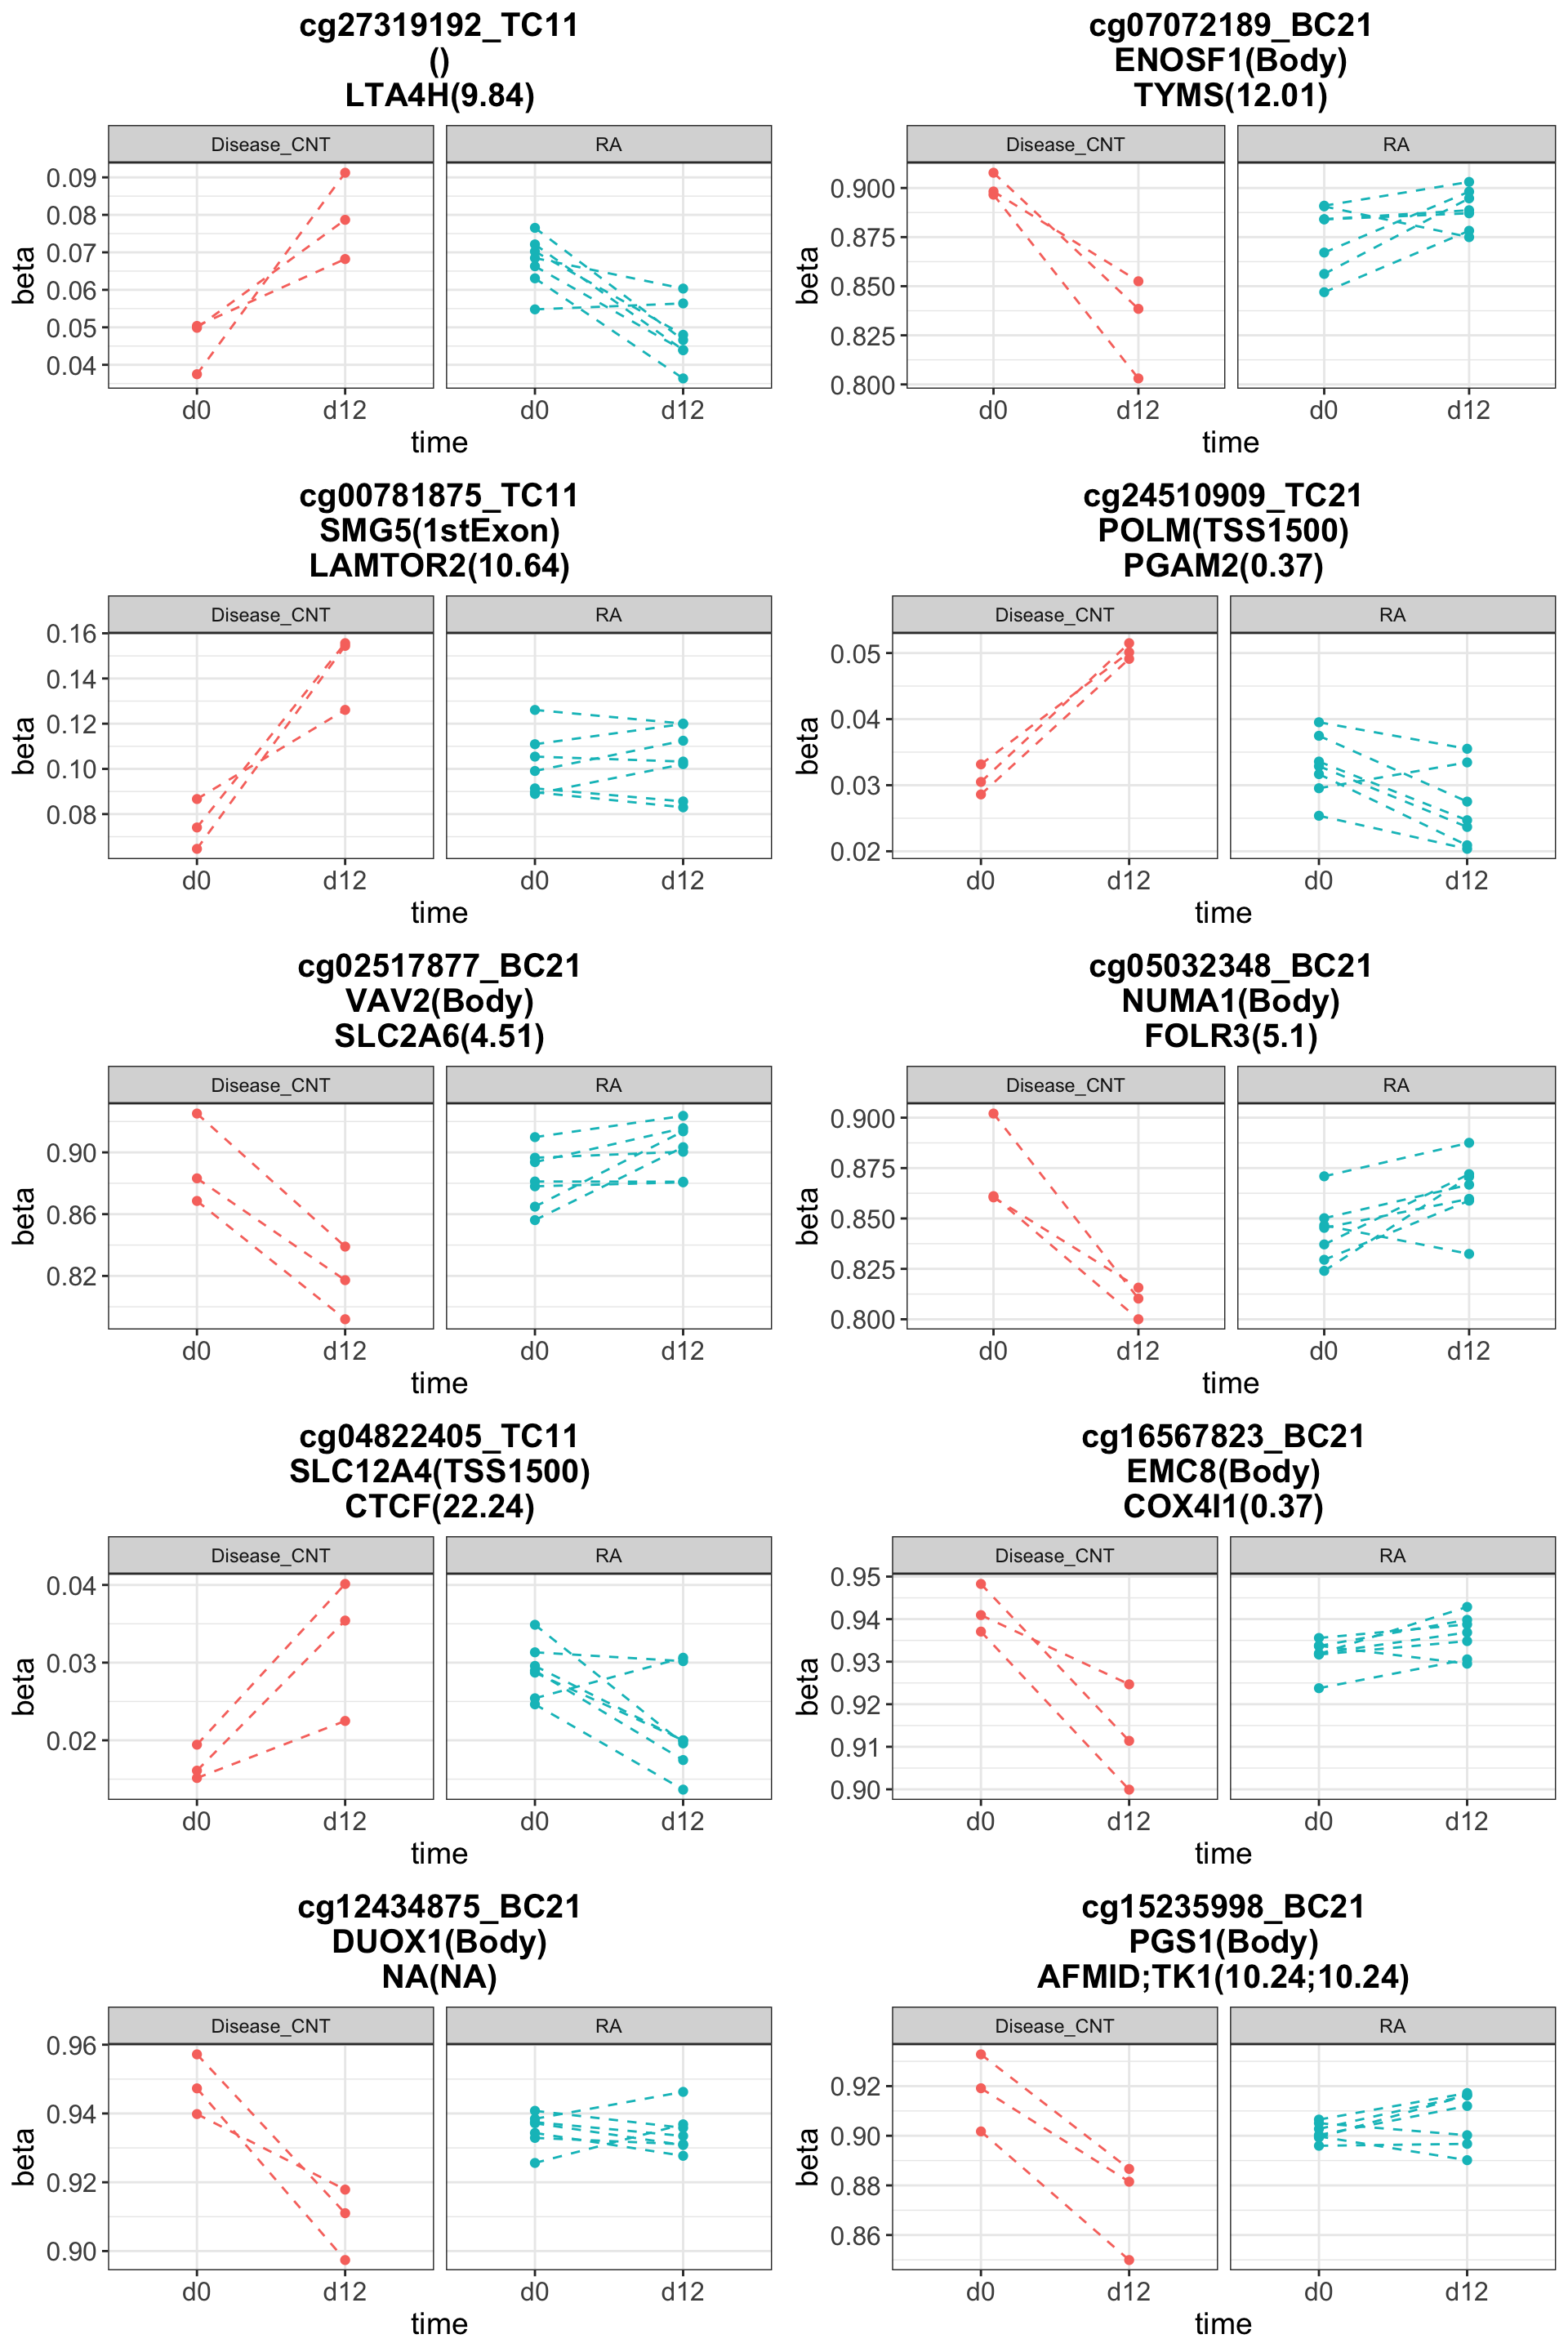
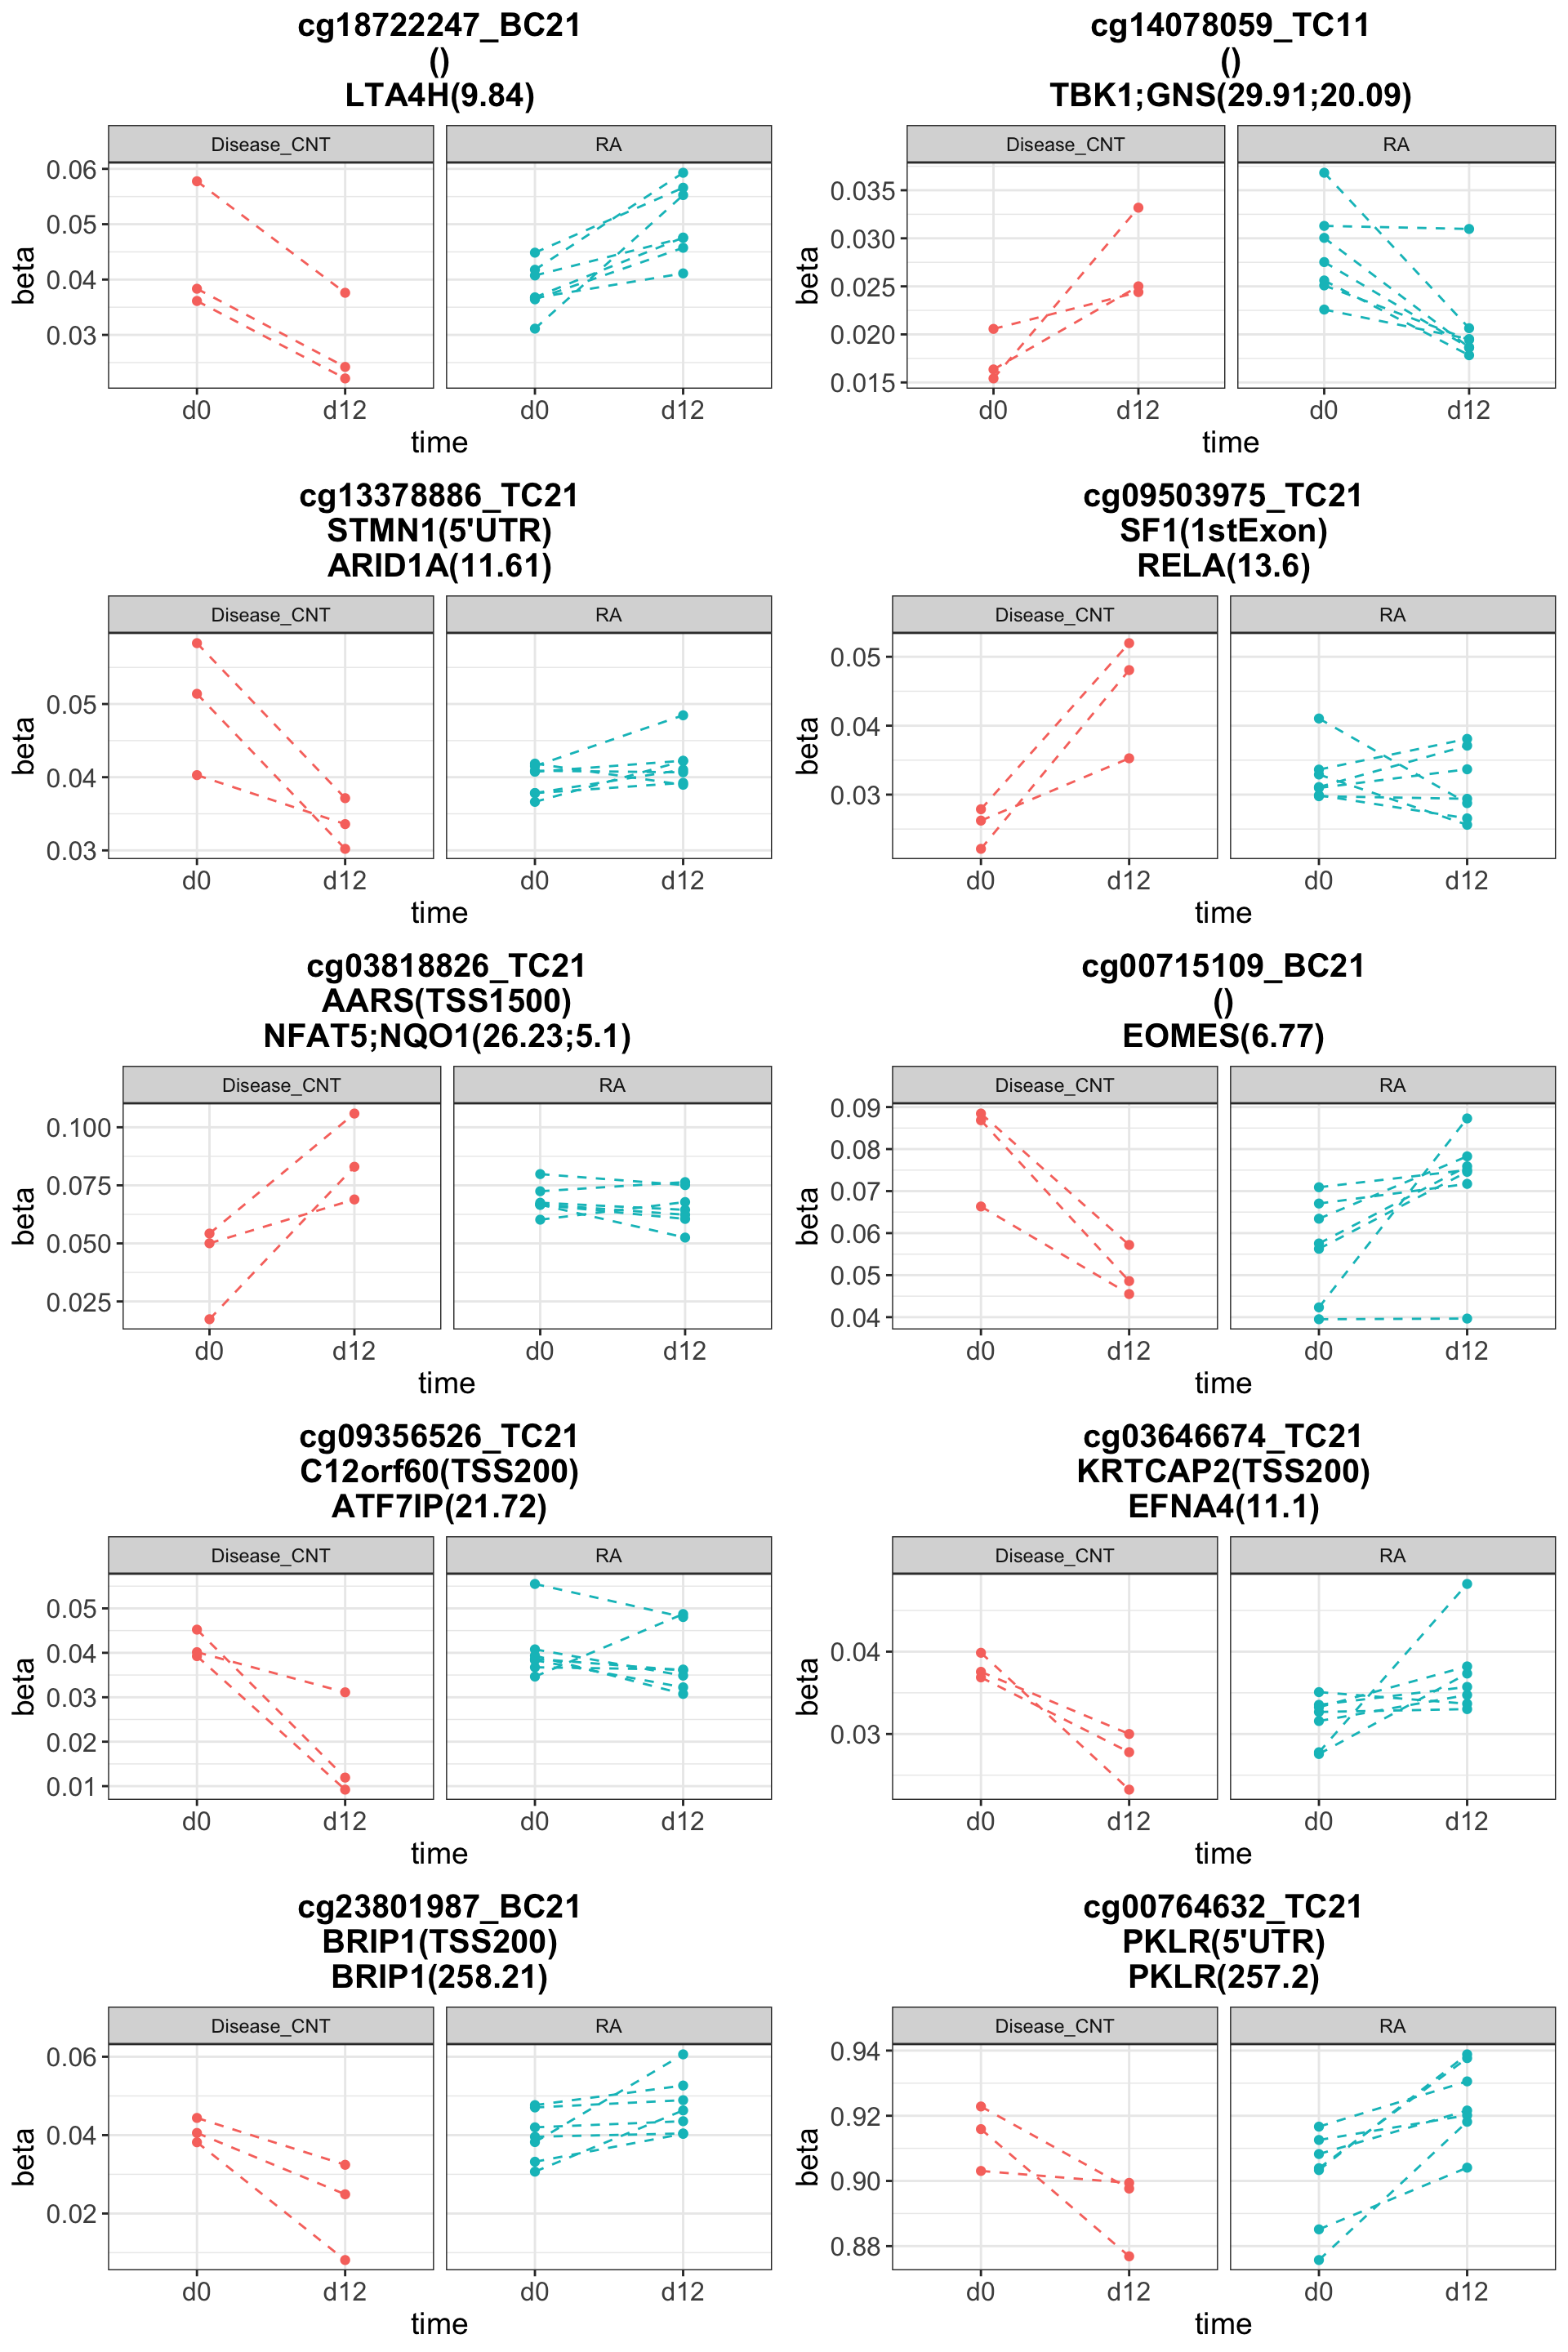 In the above plots, the first line in the title is the
mehtylation CpG id, the second line is the gene and gene region
annotations from Epic methylation array, the third line is the
annotations from GeneEnhancer. The number in the parenthesis is the
enhancer score, the higher the more confident.
In the above plots, the first line in the title is the
mehtylation CpG id, the second line is the gene and gene region
annotations from Epic methylation array, the third line is the
annotations from GeneEnhancer. The number in the parenthesis is the
enhancer score, the higher the more confident.
With stimulation
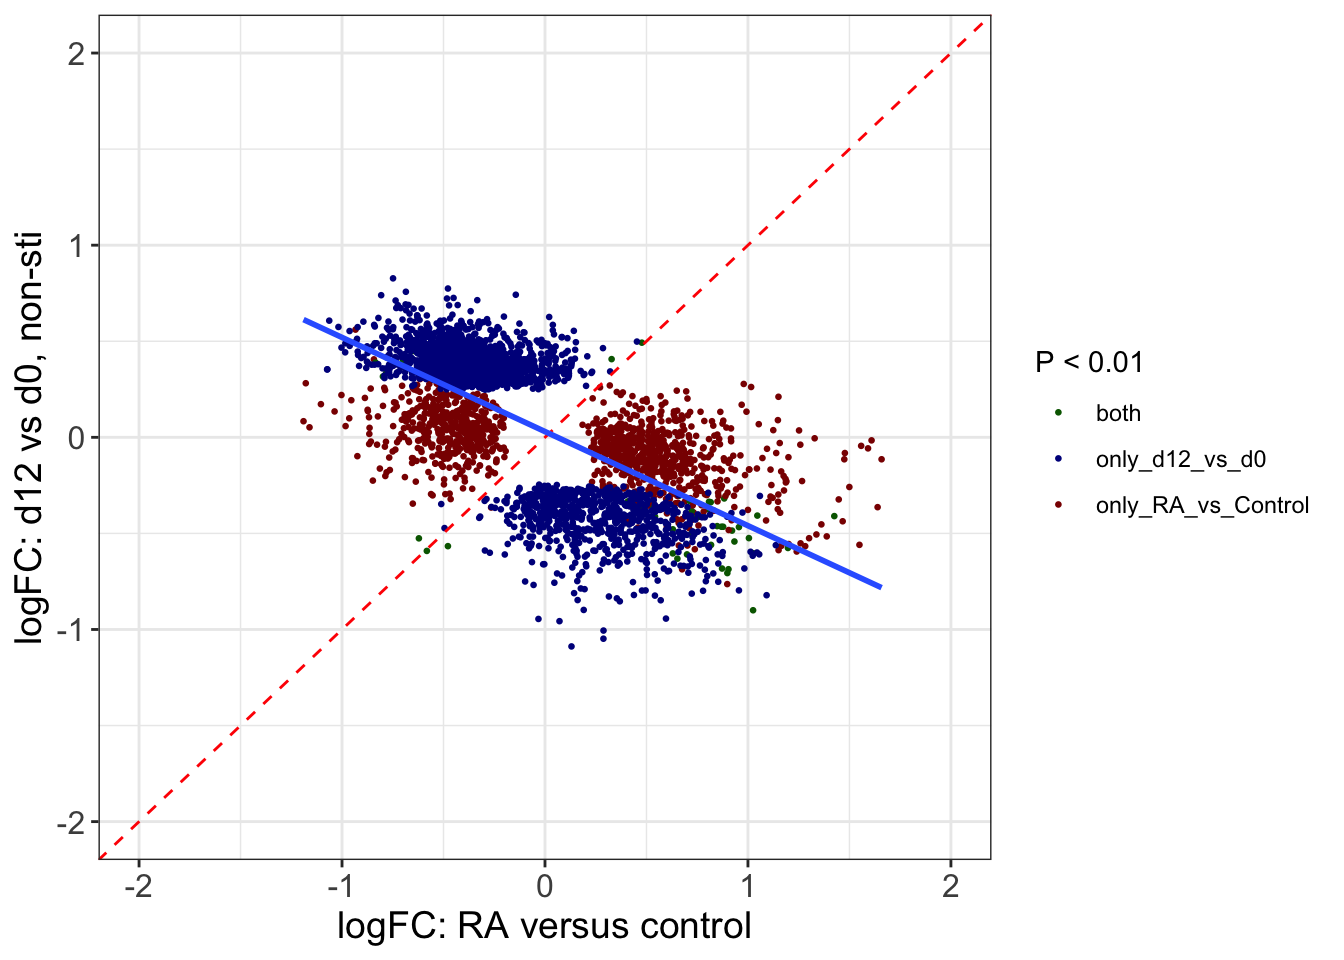
Whether keto diet in RA samples reverse the methylation change related to RA
Load diff CpG from RA versus control test
Non-stimulated samples
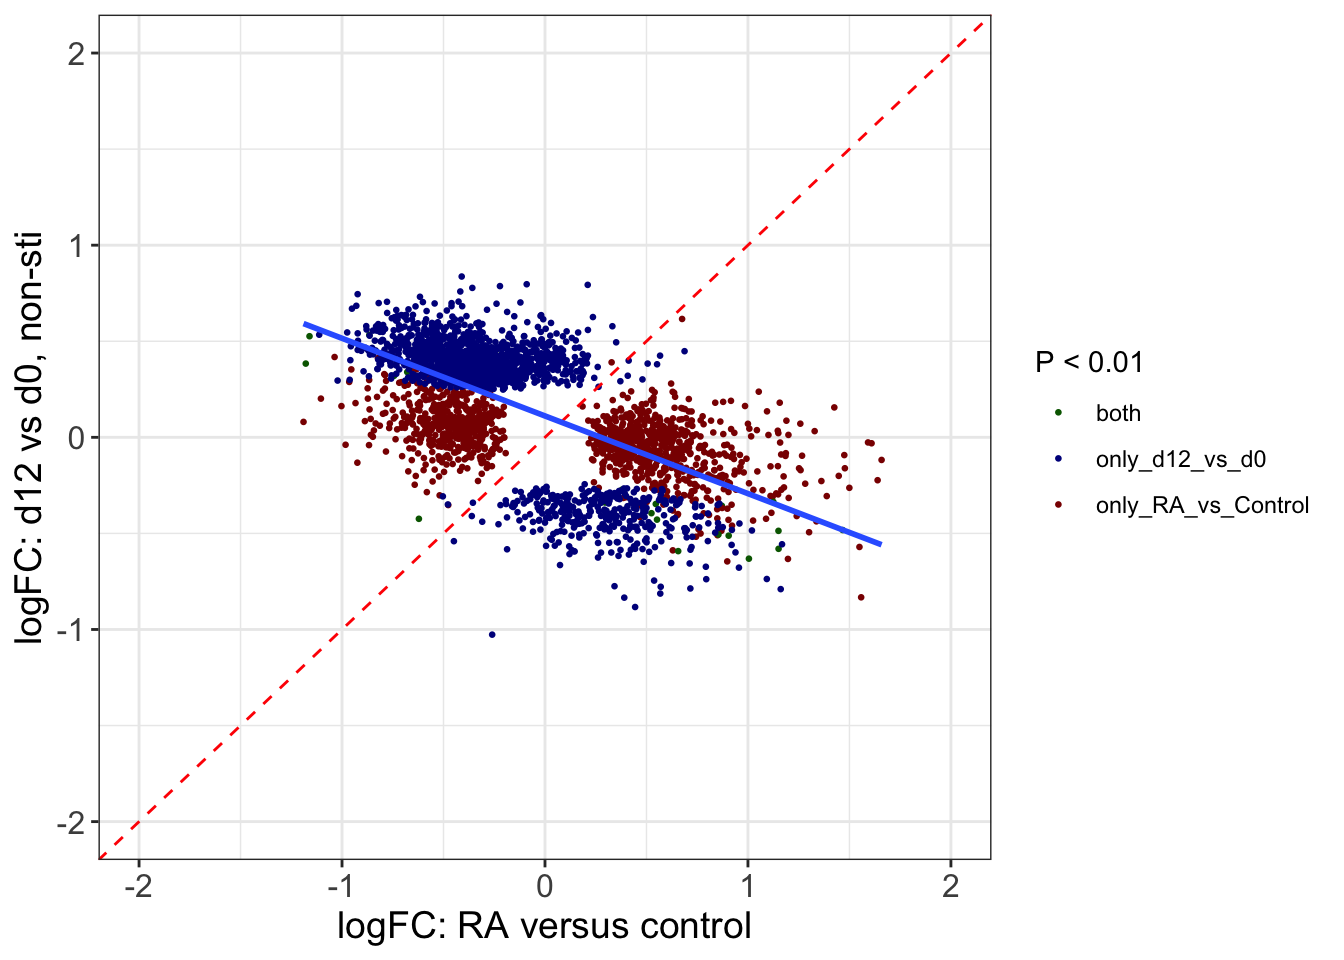 Correlation test of logFCs
    Pearson's product-moment correlation

data:  plotTab$xlab and plotTab$ylab
t = -46.017, df = 3148, p-value < 2.2e-16
alternative hypothesis: true correlation is not equal to 0
95 percent confidence interval:
 -0.6545814 -0.6128025
sample estimates:
       cor
-0.6341546
Stimulated samples
Correlation test for logFCs
    Pearson's product-moment correlation

data:  plotTab$xlab and plotTab$ylab
t = -51.628, df = 3496, p-value < 2.2e-16
alternative hypothesis: true correlation is not equal to 0
95 percent confidence interval:
 -0.6761301 -0.6385042
sample estimates:
       cor
-0.6577273
Whether keto diet in disease control samples reverse the methylation change related to RA
Non-stimulated samples
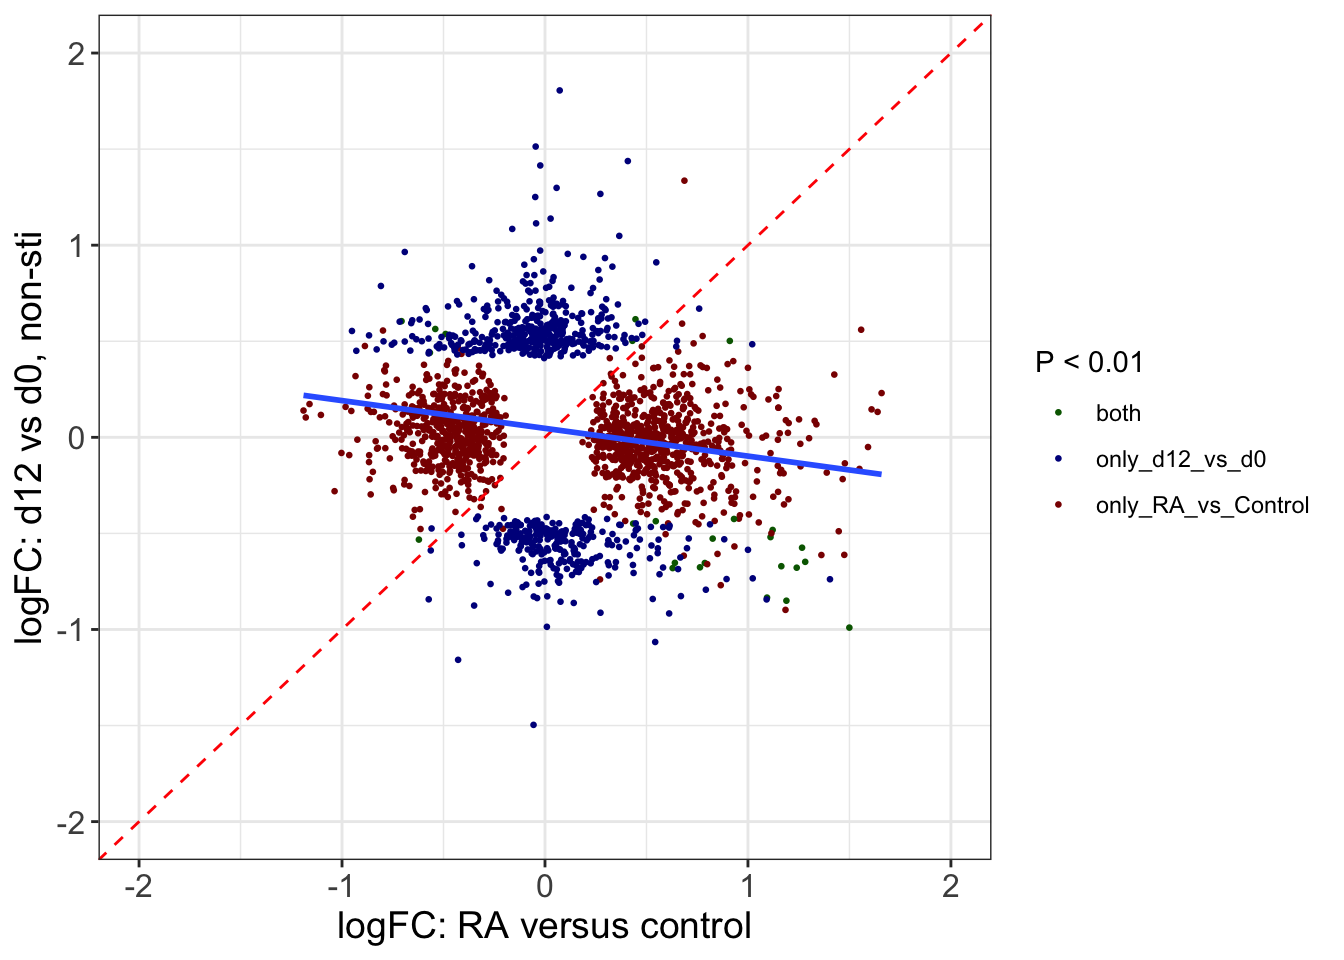 Correlation test for logFCs
    Pearson's product-moment correlation

data:  plotTab$xlab and plotTab$ylab
t = -8.1181, df = 1939, p-value = 8.326e-16
alternative hypothesis: true correlation is not equal to 0
95 percent confidence interval:
 -0.2239893 -0.1379242
sample estimates:
       cor
-0.1813039
Stimulated samples
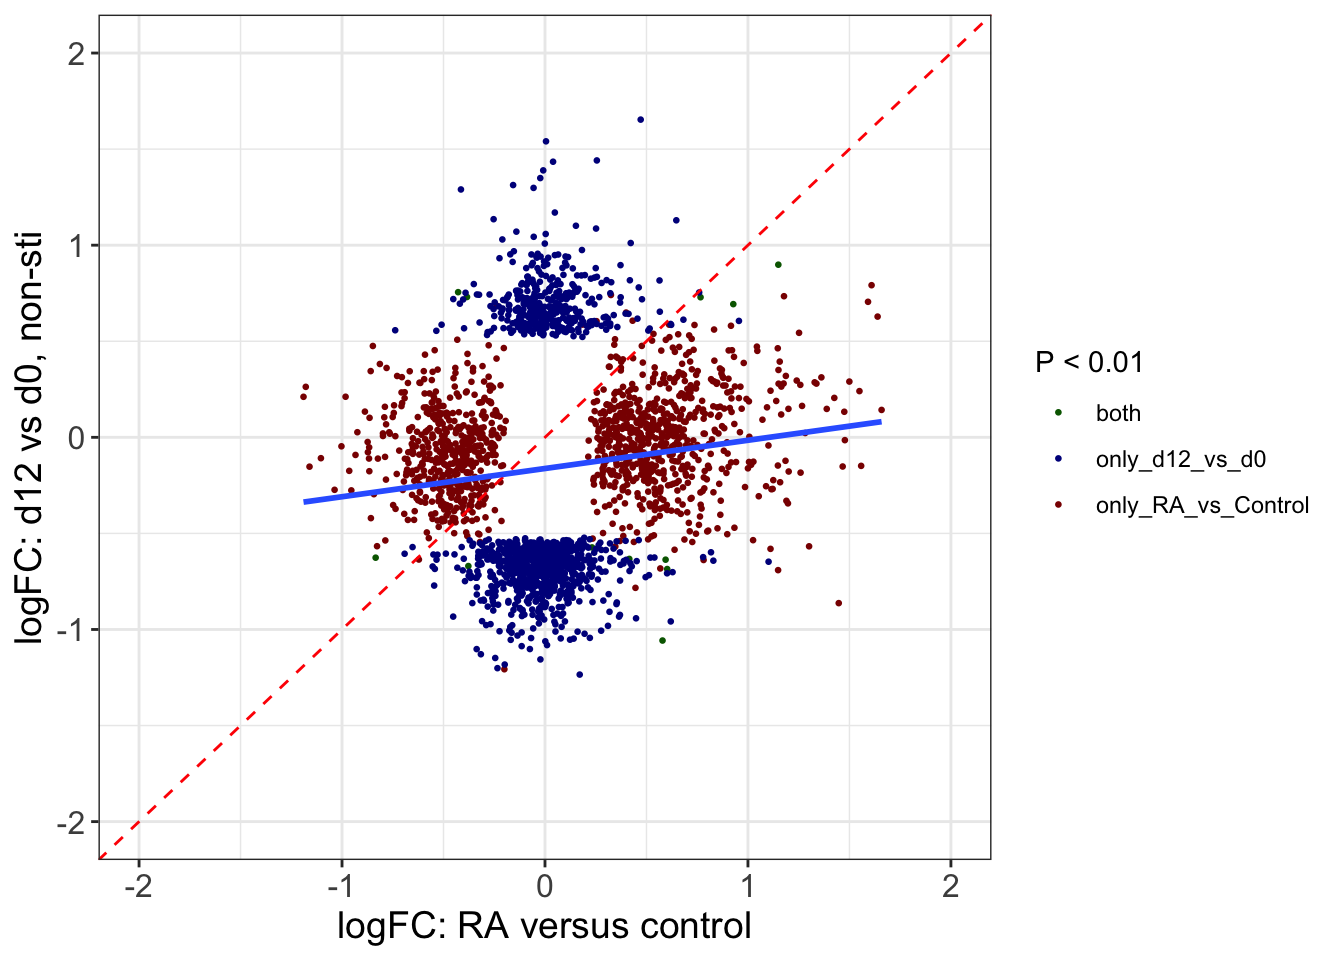 Correlation test for logFCs
    Pearson's product-moment correlation

data:  plotTab$xlab and plotTab$ylab
t = 6.2286, df = 2504, p-value = 5.503e-10
alternative hypothesis: true correlation is not equal to 0
95 percent confidence interval:
 0.0847732 0.1618917
sample estimates:
      cor
0.1235189
Visulaize the fold change of CpGs that show reversed trend
Table of selected probes
Those CpGs have reversed trend when compare the fold change of RA versus contro and day12 versus day0 (either stimulated or un-stimulated) in RA samples with keto diet.
Bar plot of logFC of top 20 candiates
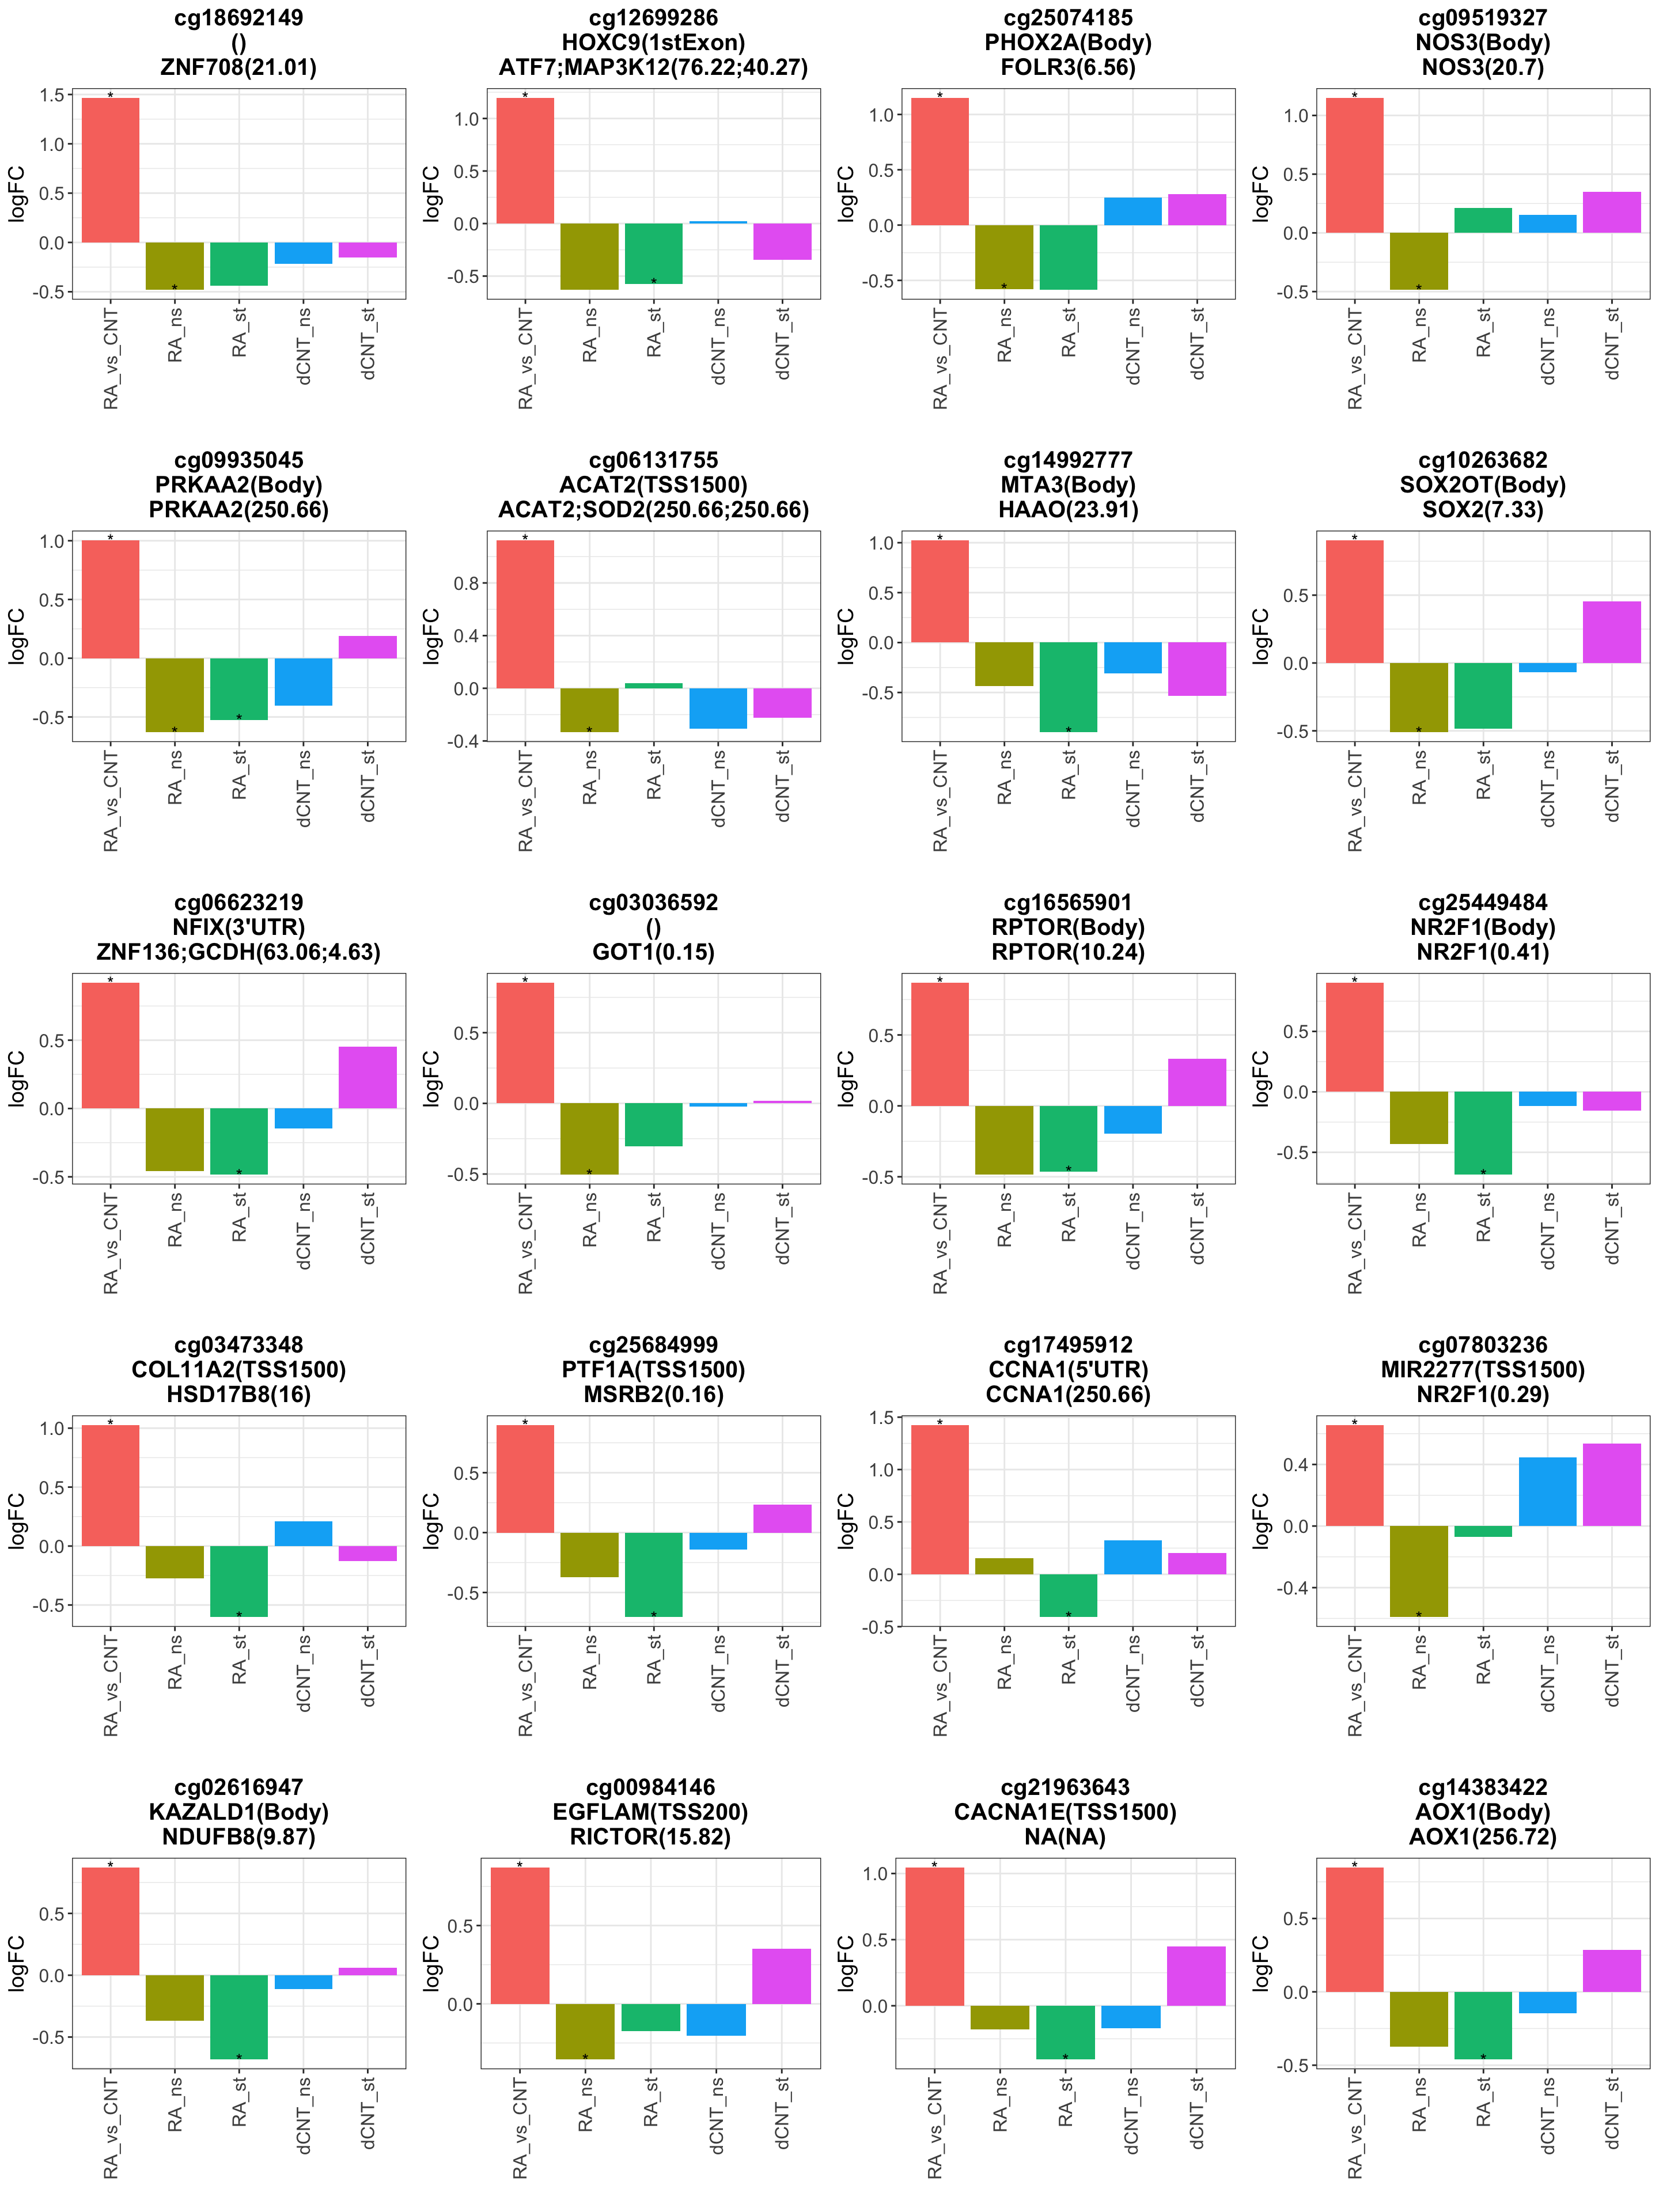 ** A star indicates P-Value < 0.01. The CpGs are ranked based on the
absolute difference between the fold change of RA_vs_dCNT and RA_ns
(day12 - day0 in unstimulated)**
** A star indicates P-Value < 0.01. The CpGs are ranked based on the
absolute difference between the fold change of RA_vs_dCNT and RA_ns
(day12 - day0 in unstimulated)**
R version 4.2.0 (2022-04-22)
Platform: x86_64-apple-darwin17.0 (64-bit)
Running under: macOS Big Sur/Monterey 10.16

Matrix products: default
BLAS:   /Library/Frameworks/R.framework/Versions/4.2/Resources/lib/libRblas.0.dylib
LAPACK: /Library/Frameworks/R.framework/Versions/4.2/Resources/lib/libRlapack.dylib

locale:
[1] en_US.UTF-8/en_US.UTF-8/en_US.UTF-8/C/en_US.UTF-8/en_US.UTF-8

attached base packages:
[1] stats4    stats     graphics  grDevices utils     datasets  methods
[8] base

other attached packages:
 [1] forcats_0.5.1               stringr_1.4.1
 [3] dplyr_1.1.4.9000            purrr_0.3.4
 [5] readr_2.1.2                 tidyr_1.2.0
 [7] tibble_3.2.1                ggplot2_3.4.1
 [9] tidyverse_1.3.2             pheatmap_1.0.12
[11] SummarizedExperiment_1.26.1 Biobase_2.56.0
[13] GenomicRanges_1.48.0        GenomeInfoDb_1.32.2
[15] IRanges_2.30.0              S4Vectors_0.34.0
[17] BiocGenerics_0.42.0         MatrixGenerics_1.8.1
[19] matrixStats_0.62.0          limma_3.52.2

loaded via a namespace (and not attached):
  [1] googledrive_2.0.0      colorspace_2.0-3       ellipsis_0.3.2
  [4] rprojroot_2.0.3        XVector_0.36.0         fs_1.5.2
  [7] rstudioapi_0.13        farver_2.1.1           DT_0.23
 [10] ggrepel_0.9.1          bit64_4.0.5            AnnotationDbi_1.58.0
 [13] fansi_1.0.6            lubridate_1.8.0        xml2_1.3.3
 [16] codetools_0.2-18       splines_4.2.0          cachem_1.0.6
 [19] knitr_1.39             jsonlite_1.8.3         workflowr_1.7.0
 [22] broom_1.0.0            annotate_1.74.0        dbplyr_2.2.1
 [25] png_0.1-7              ggvenn_0.1.9           compiler_4.2.0
 [28] httr_1.4.3             backports_1.4.1        assertthat_0.2.1
 [31] Matrix_1.5-4           fastmap_1.1.0          gargle_1.2.0
 [34] cli_3.6.2              later_1.3.0            htmltools_0.5.4
 [37] tools_4.2.0            gtable_0.3.0           glue_1.7.0
 [40] GenomeInfoDbData_1.2.8 Rcpp_1.0.9             cellranger_1.1.0
 [43] jquerylib_0.1.4        vctrs_0.6.5            Biostrings_2.64.0
 [46] nlme_3.1-158           crosstalk_1.2.0        xfun_0.31
 [49] rvest_1.0.2            lifecycle_1.0.4        XML_3.99-0.10
 [52] googlesheets4_1.0.0    edgeR_3.38.1           zlibbioc_1.42.0
 [55] scales_1.2.0           hms_1.1.1              promises_1.2.0.1
 [58] parallel_4.2.0         RColorBrewer_1.1-3     yaml_2.3.5
 [61] memoise_2.0.1          sass_0.4.2             stringi_1.7.8
 [64] RSQLite_2.2.15         highr_0.9              genefilter_1.78.0
 [67] BiocParallel_1.30.3    rlang_1.1.3            pkgconfig_2.0.3
 [70] bitops_1.0-7           evaluate_0.15          lattice_0.20-45
 [73] htmlwidgets_1.5.4      labeling_0.4.2         cowplot_1.1.1
 [76] bit_4.0.4              tidyselect_1.2.1       magrittr_2.0.3
 [79] R6_2.5.1               generics_0.1.3         DelayedArray_0.22.0
 [82] DBI_1.1.3              mgcv_1.8-40            pillar_1.9.0
 [85] haven_2.5.0            withr_3.0.0            survival_3.4-0
 [88] KEGGREST_1.36.3        RCurl_1.98-1.7         modelr_0.1.8
 [91] crayon_1.5.2           utf8_1.2.4             tzdb_0.3.0
 [94] rmarkdown_2.14         locfit_1.5-9.6         grid_4.2.0
 [97] readxl_1.4.0           sva_3.44.0             blob_1.2.3
[100] git2r_0.30.1           reprex_2.0.1           digest_0.6.30
[103] xtable_1.8-4           httpuv_1.6.6           munsell_0.5.0
[106] bslib_0.4.1