Differential methylation analysis between RA and control samples (including X chromosome but remove Y chromosome)
Junyan Lu
Last updated: 2024-04-08
Checks: 5 1
Knit directory: RA_Tcell_omics/analysis/
This reproducible R Markdown analysis was created with workflowr (version 1.7.0). The Checks tab describes the reproducibility checks that were applied when the results were created. The Past versions tab lists the development history.
Great job! The global environment was empty. Objects defined in the global environment can affect the analysis in your R Markdown file in unknown ways. For reproduciblity it’s best to always run the code in an empty environment.
The command set.seed(20221110) was run prior to running
the code in the R Markdown file. Setting a seed ensures that any results
that rely on randomness, e.g. subsampling or permutations, are
reproducible.
Great job! Recording the operating system, R version, and package versions is critical for reproducibility.
Nice! There were no cached chunks for this analysis, so you can be confident that you successfully produced the results during this run.
Great job! Using relative paths to the files within your workflowr project makes it easier to run your code on other machines.
Tracking code development and connecting the code version to the
results is critical for reproducibility. To start using Git, open the
Terminal and type git init in your project directory.
This project is not being versioned with Git. To obtain the full
reproducibility benefits of using workflowr, please see
?wflow_start.
Load libraries
Global variables
Load and preprocess datasets
Load omics data
Get unique symbol
Remove probes on sex chromosomes
Remove CpGs not associated with known genes
Save table for interested methylation probes
Correlation between average methylation level and phenotype
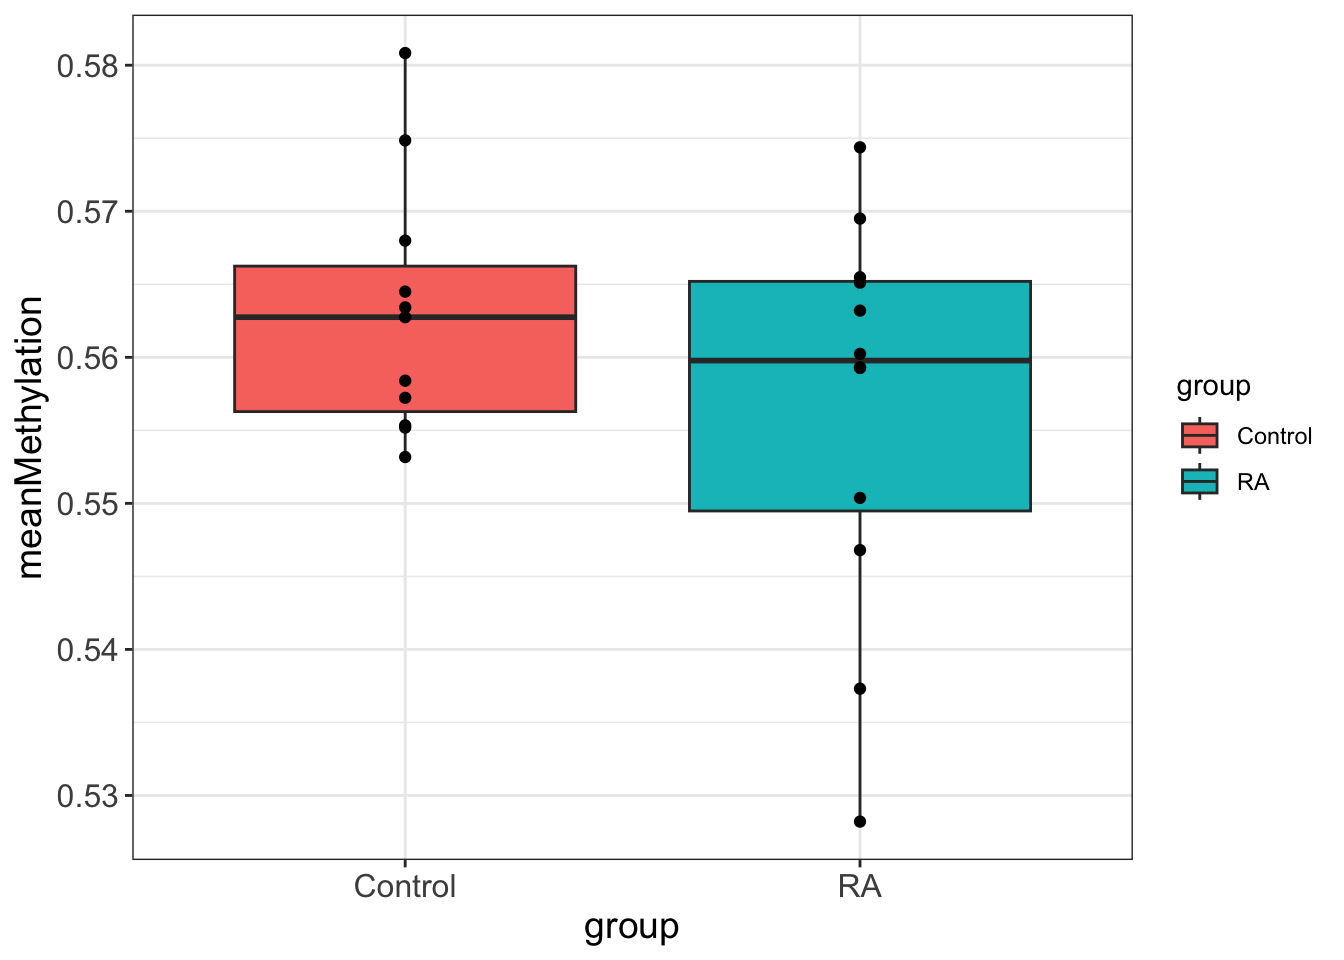
    Two Sample t-test

data:  meanMethylation by group
t = 1.3468, df = 21, p-value = 0.1924
alternative hypothesis: true difference in means between group Control and group RA is not equal to 0
95 percent confidence interval:
 -0.003516213  0.016440056
sample estimates:
mean in group Control      mean in group RA
            0.5630603             0.5565984
On the overall methylation level, there’s no strong trend that RA samples have higher methylation.
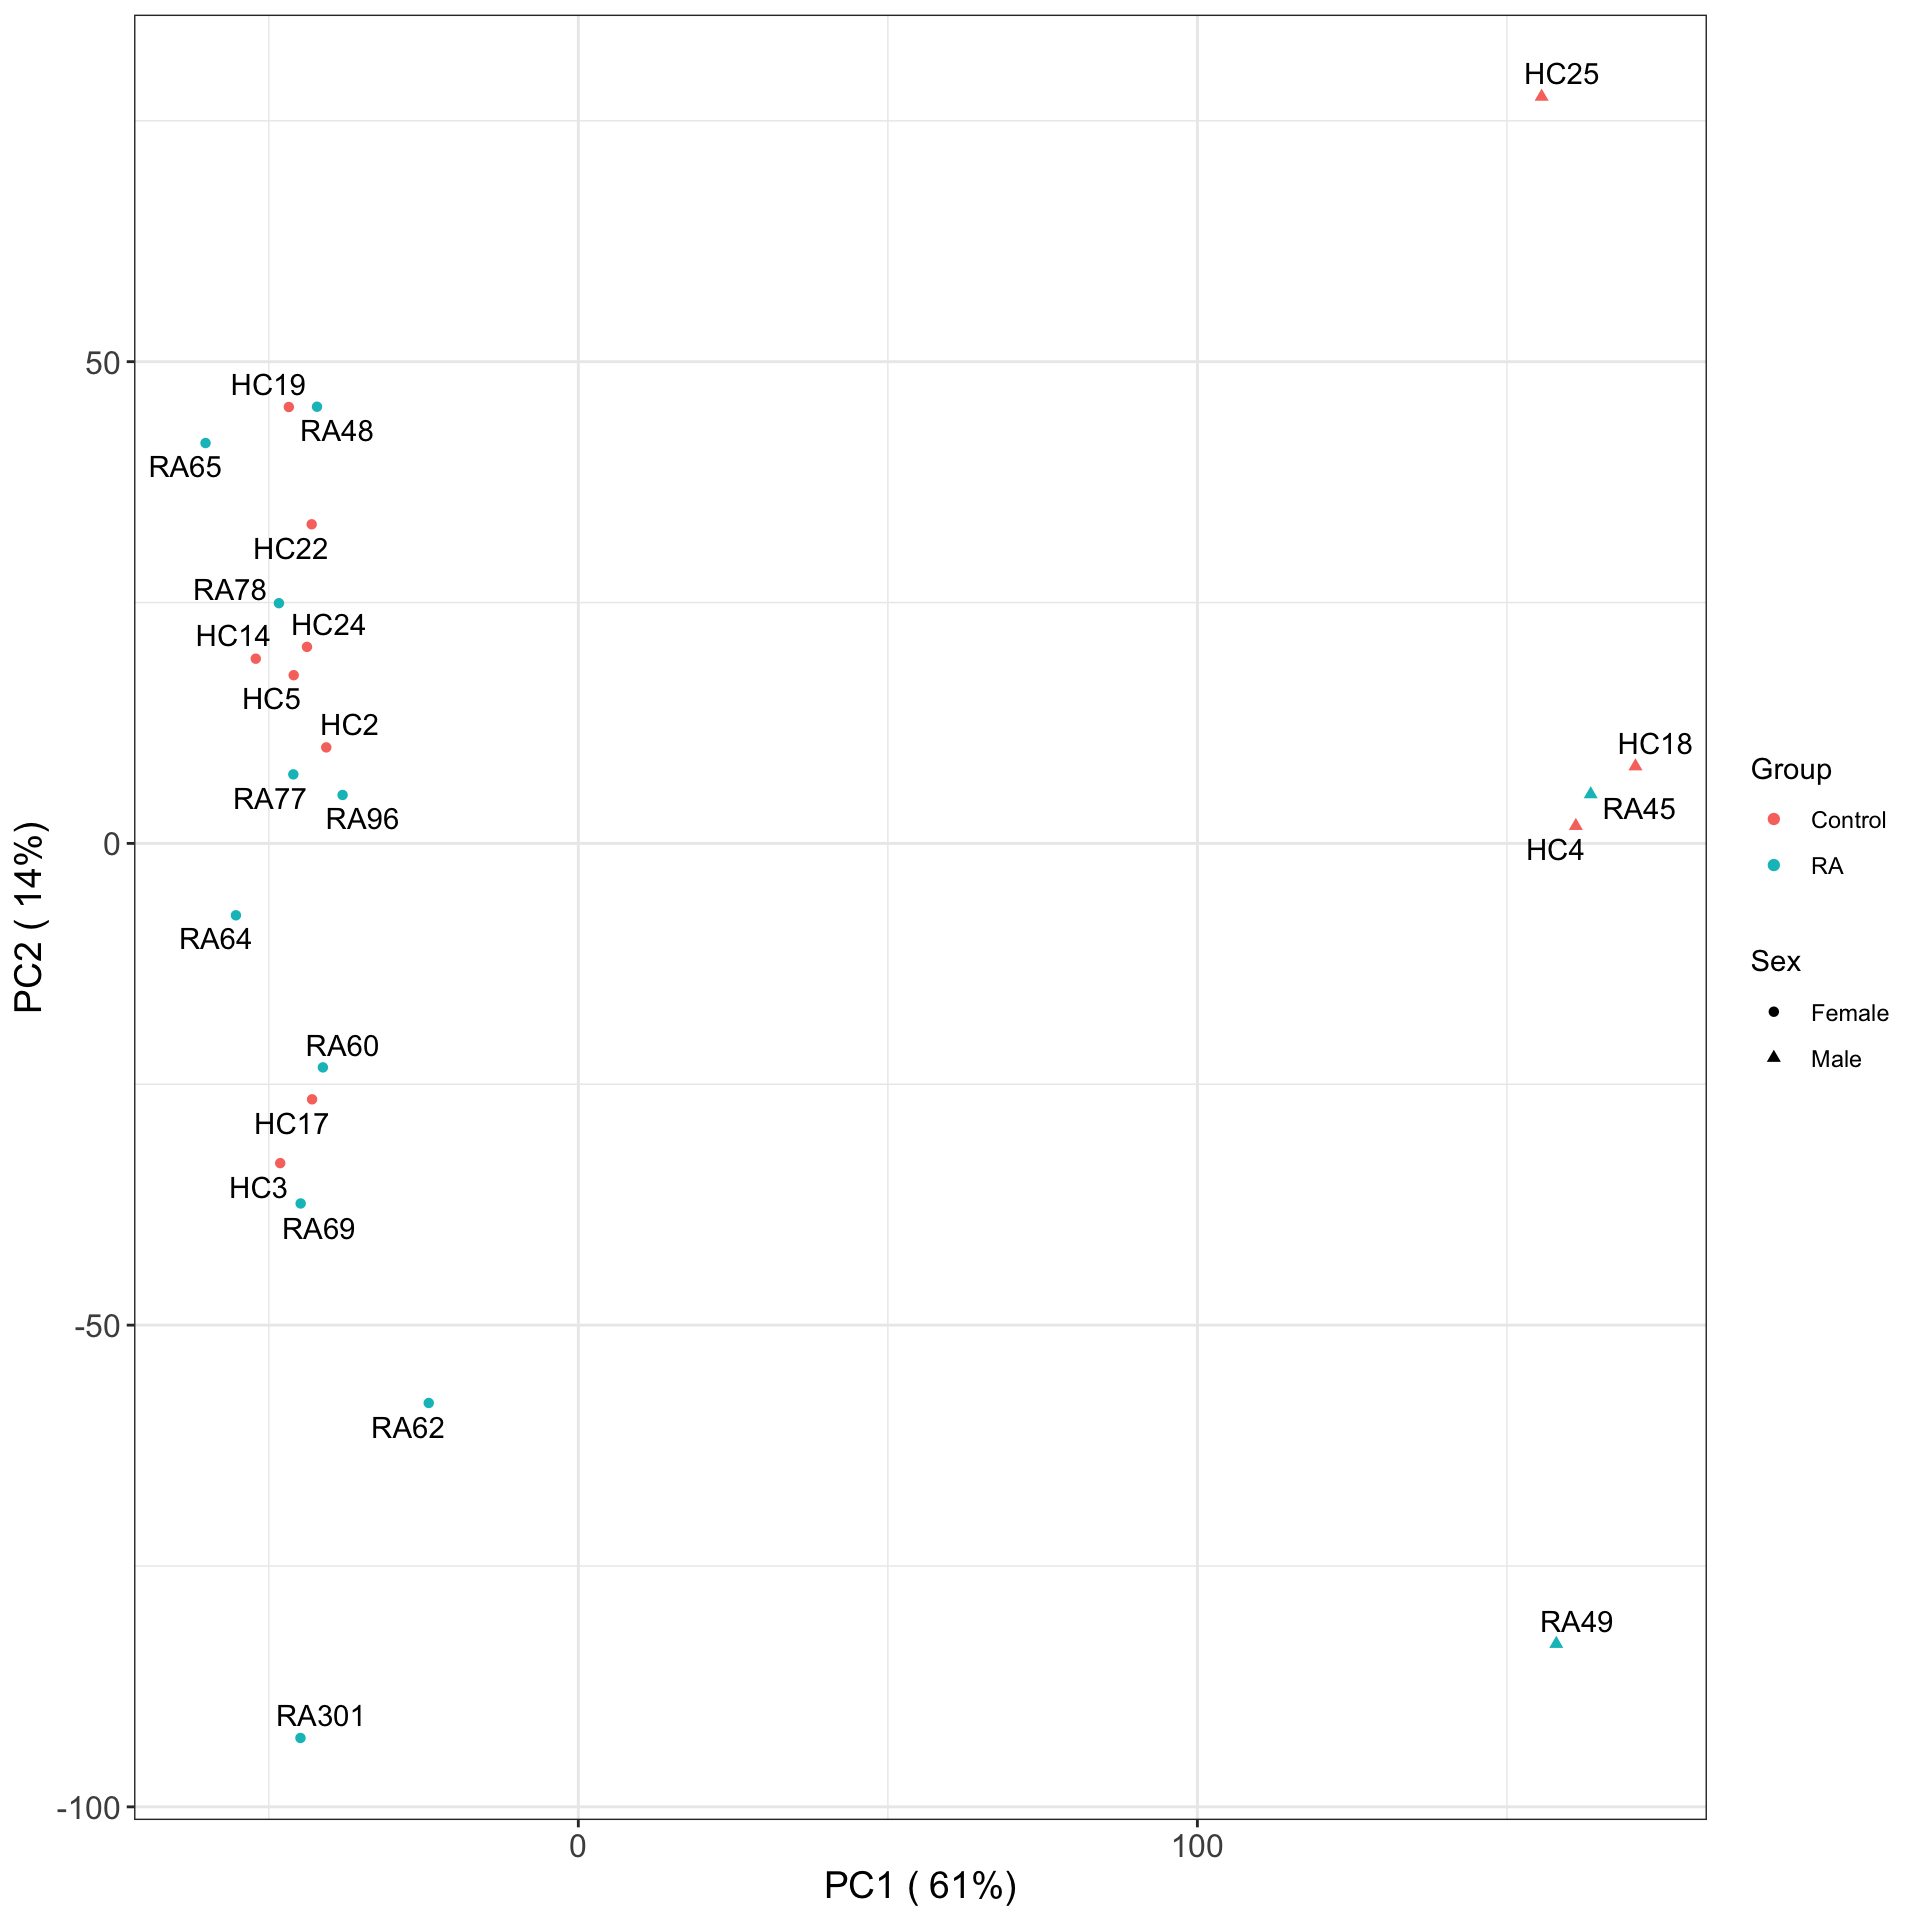
PCA analysis
Calculate PCA
PCA plots
PC1 versus PC2
PC2 versus PC3
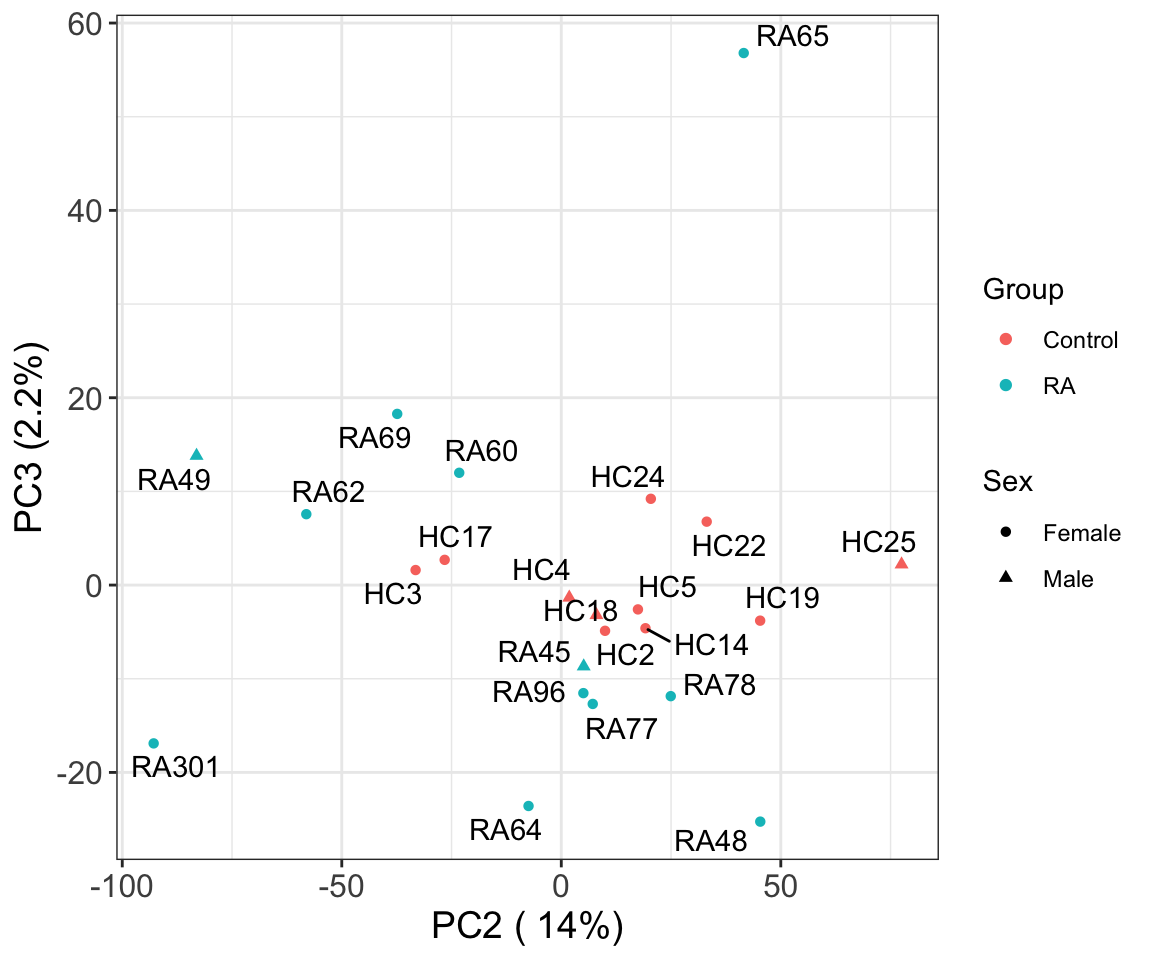
Associate PCs with disease
# A tibble: 23 × 3
# Groups:   pc [23]
   pc     estimate p.value
   <chr>     <dbl>   <dbl>
 1 PC4    1.59e+ 1  0.0133
 2 PC9    1.09e+ 1  0.0468
 3 PC2    3.01e+ 1  0.0802
 4 PC12  -8.90e+ 0  0.0852
 5 PC10   7.02e+ 0  0.202
 6 PC23  -6.00e-14  0.319
 7 PC5    5.95e+ 0  0.342
 8 PC16  -4.39e+ 0  0.371
 9 PC6   -5.09e+ 0  0.406
10 PC13  -3.57e+ 0  0.495
# ℹ 13 more rows
The first three principal components can separate RA with control samples, to some degree.
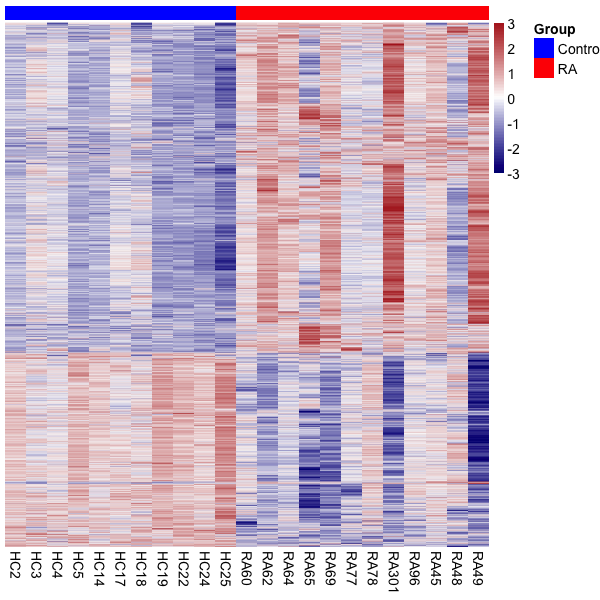
Differentially methylated CpGs
Prepare data
Process methylation dataset
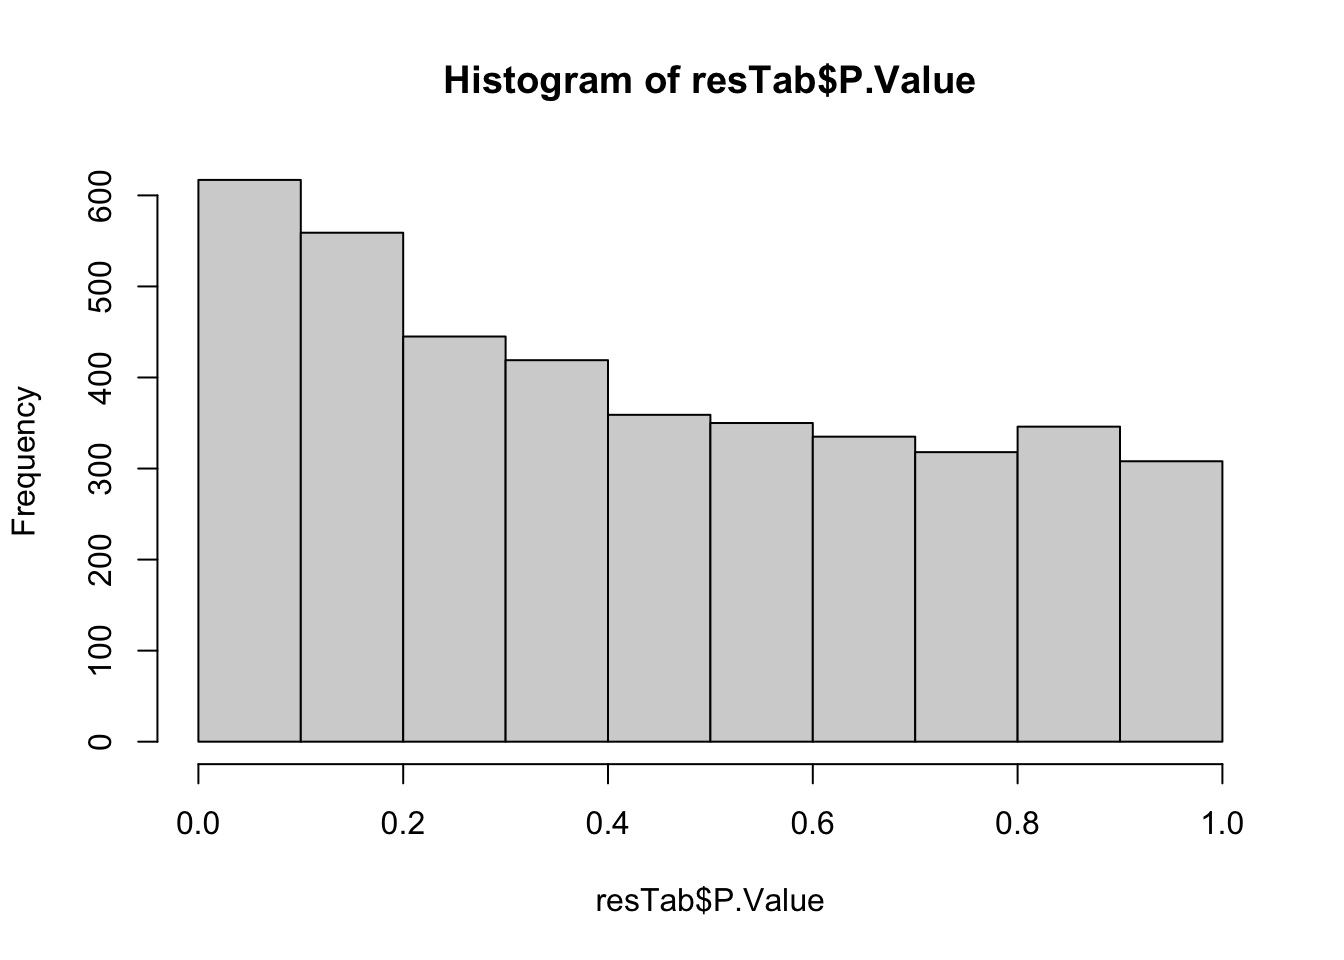
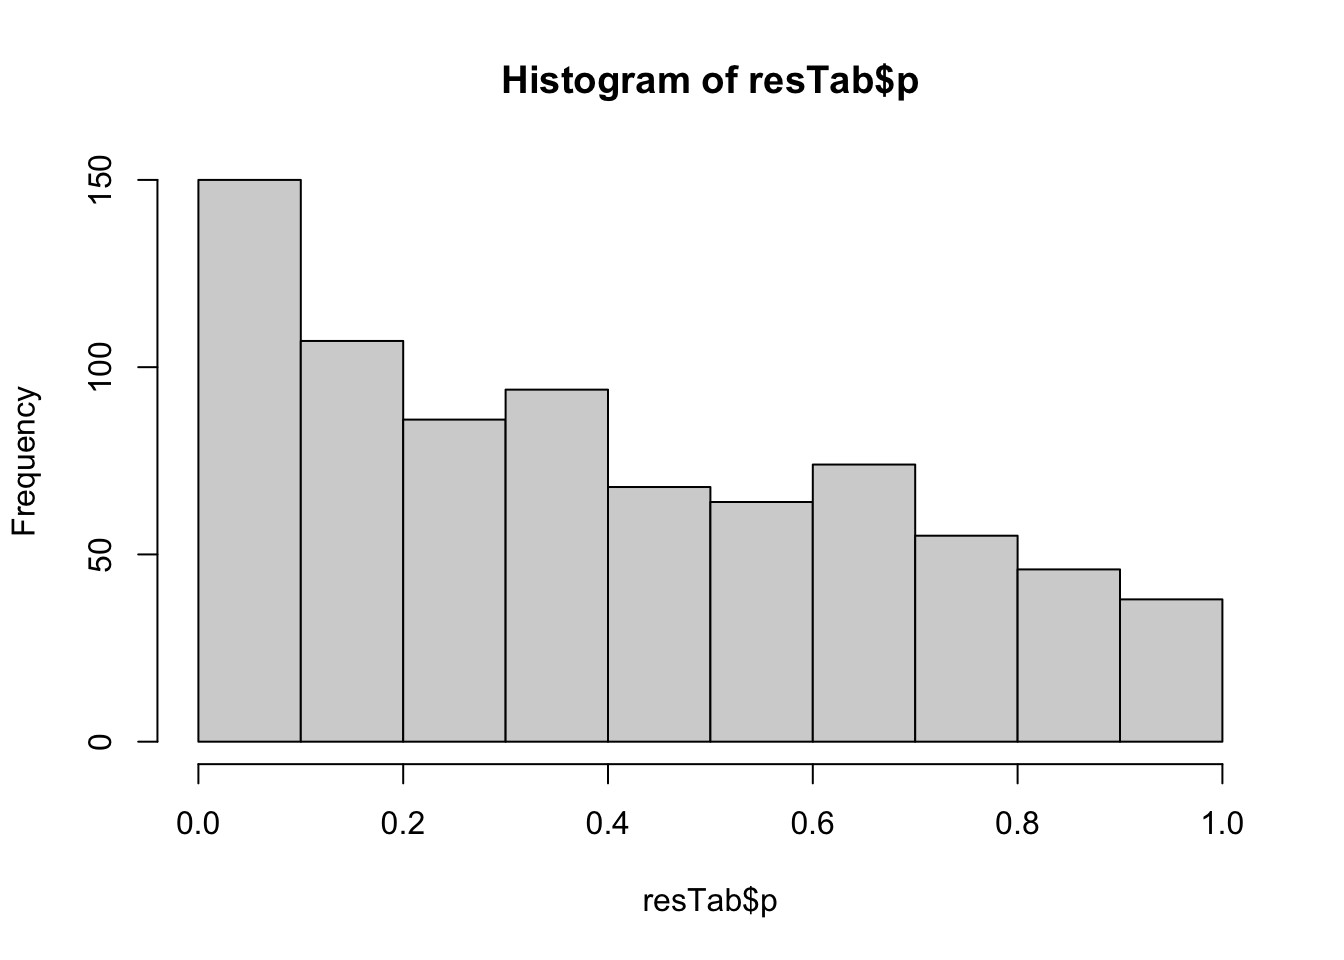
[1] 572165 23Differential methylation using limma
Add mean difference of beta values
Save the full table as excel file
Number of hypermethylation and hypomethylation
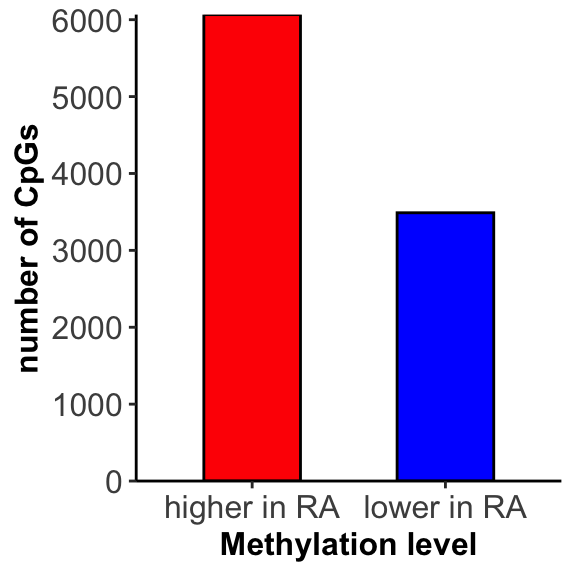
Visualize results
Top 1000 associated probes
Visualize top 20 associations
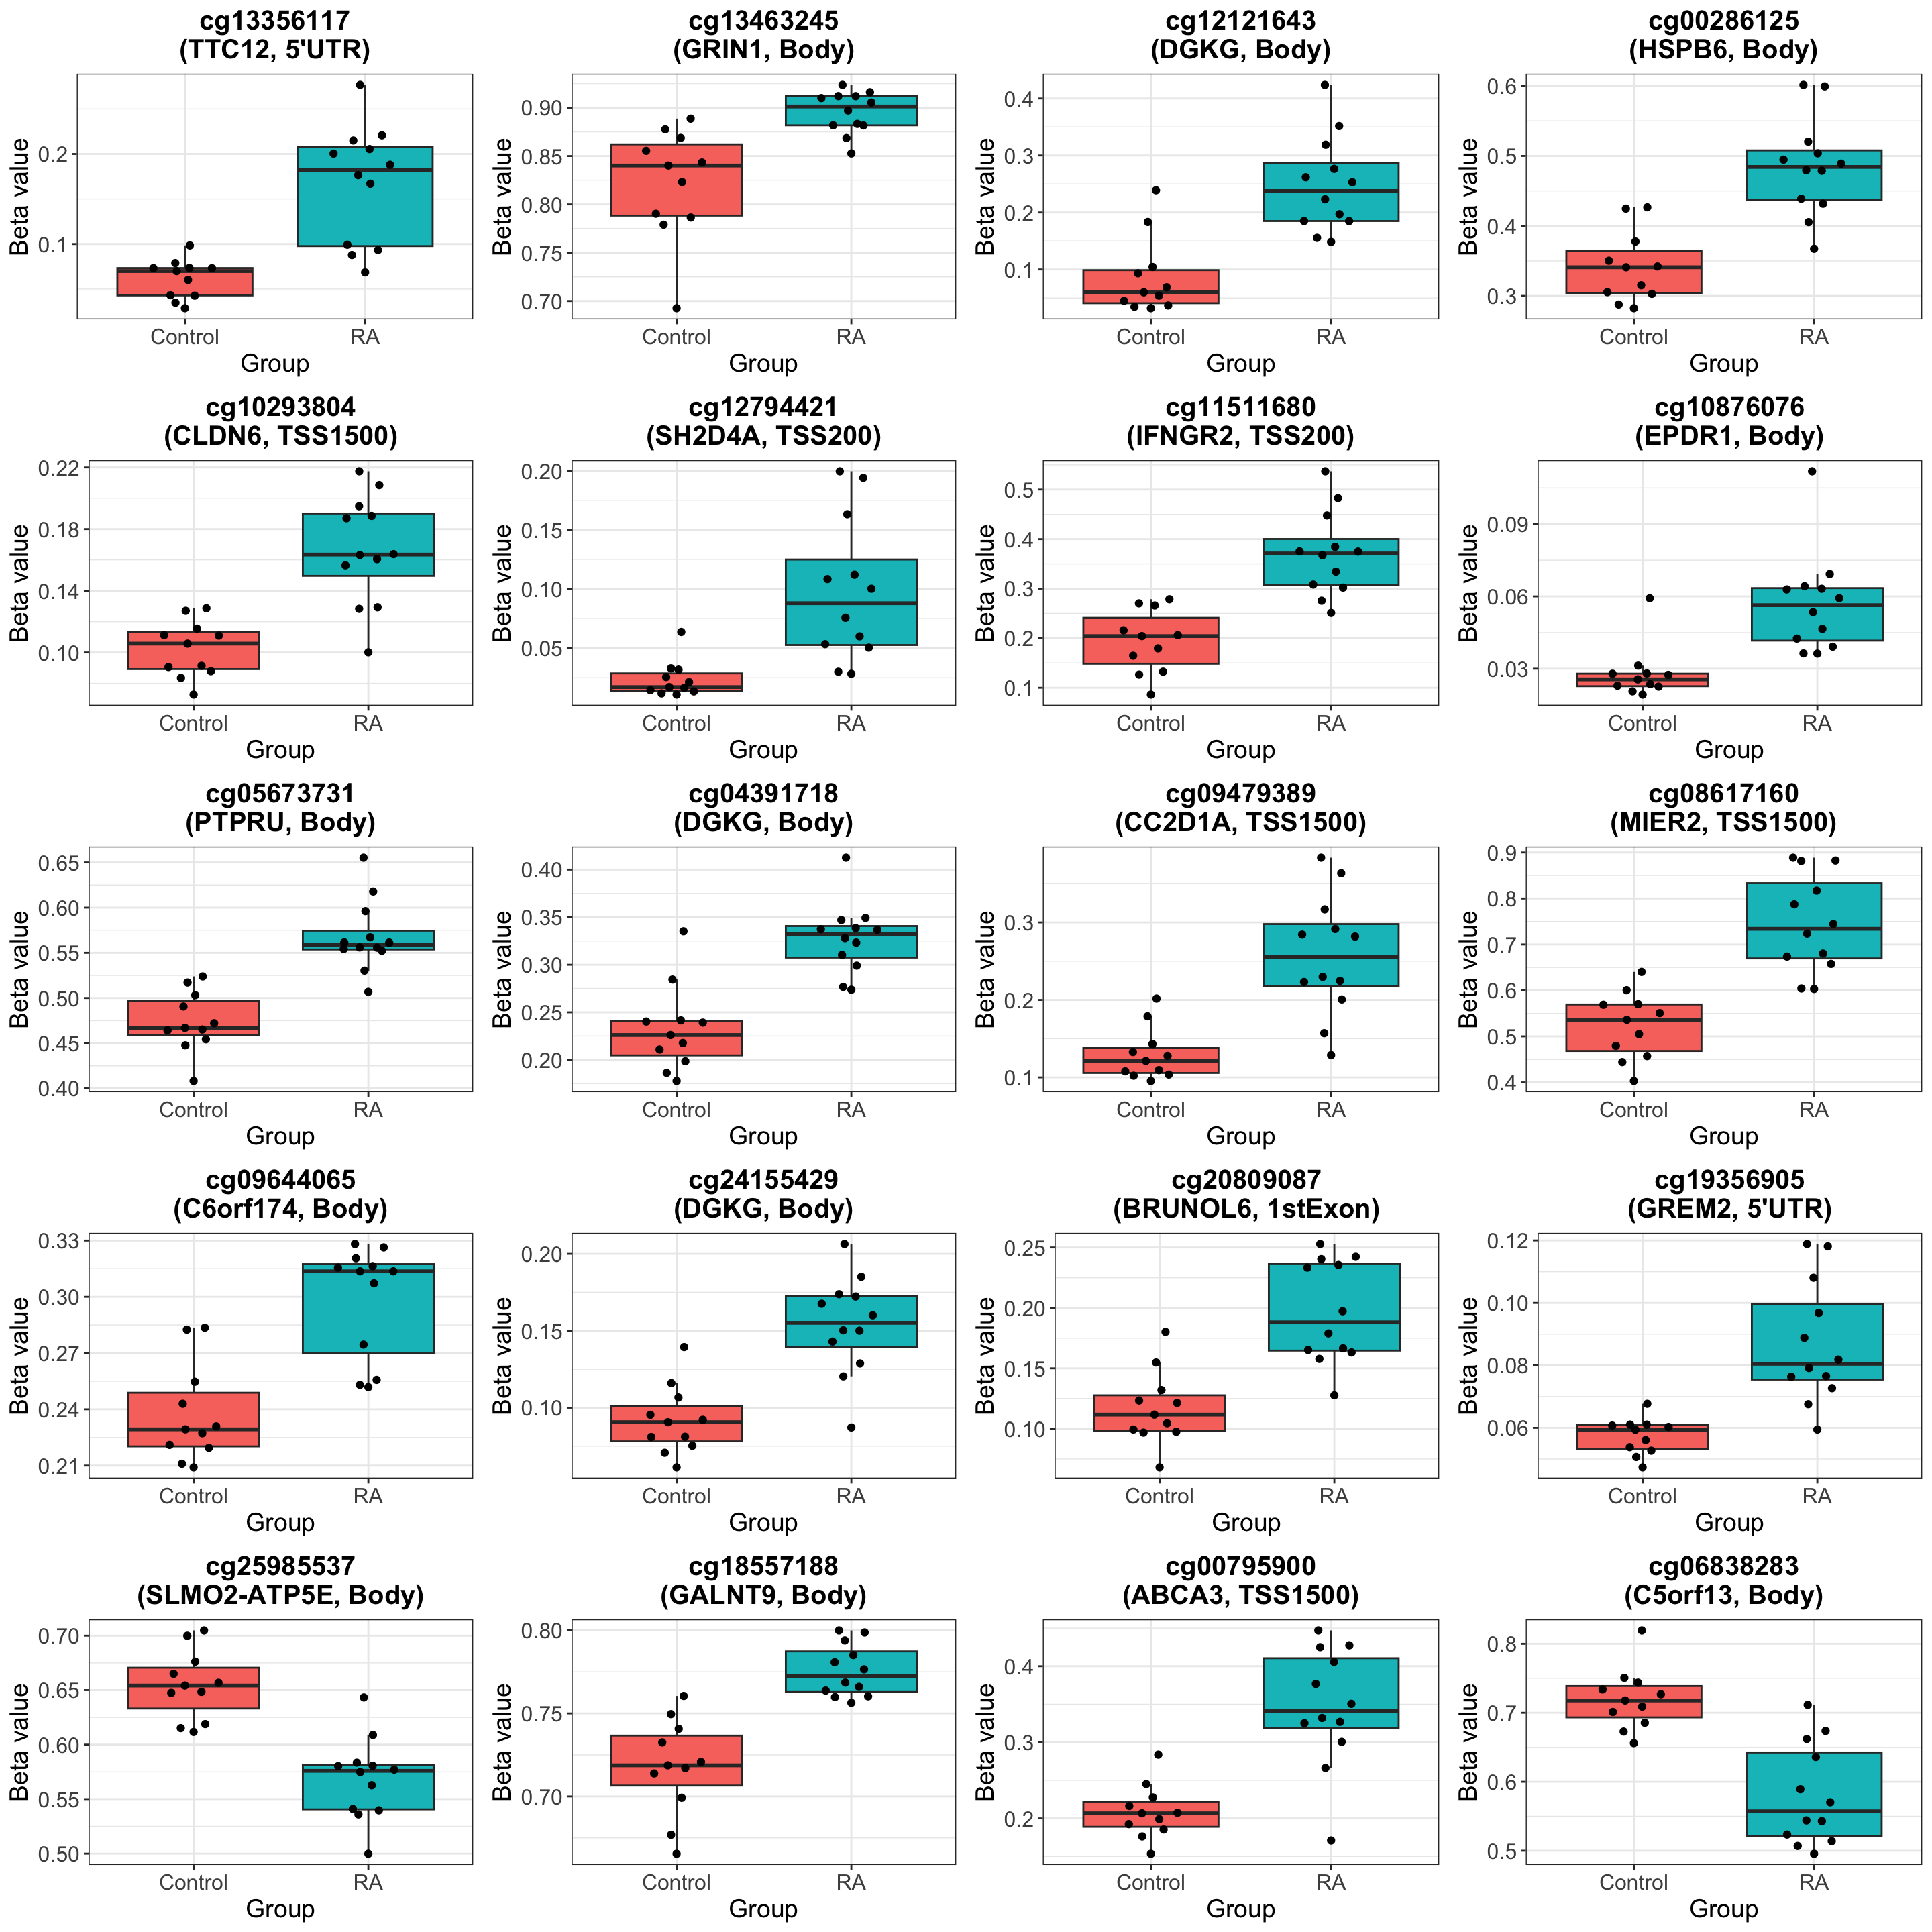 The top hit seems interesting: https://pubmed.ncbi.nlm.nih.gov/18759932/
Number of associated CpGs per gene
Visualize selected probes in genes
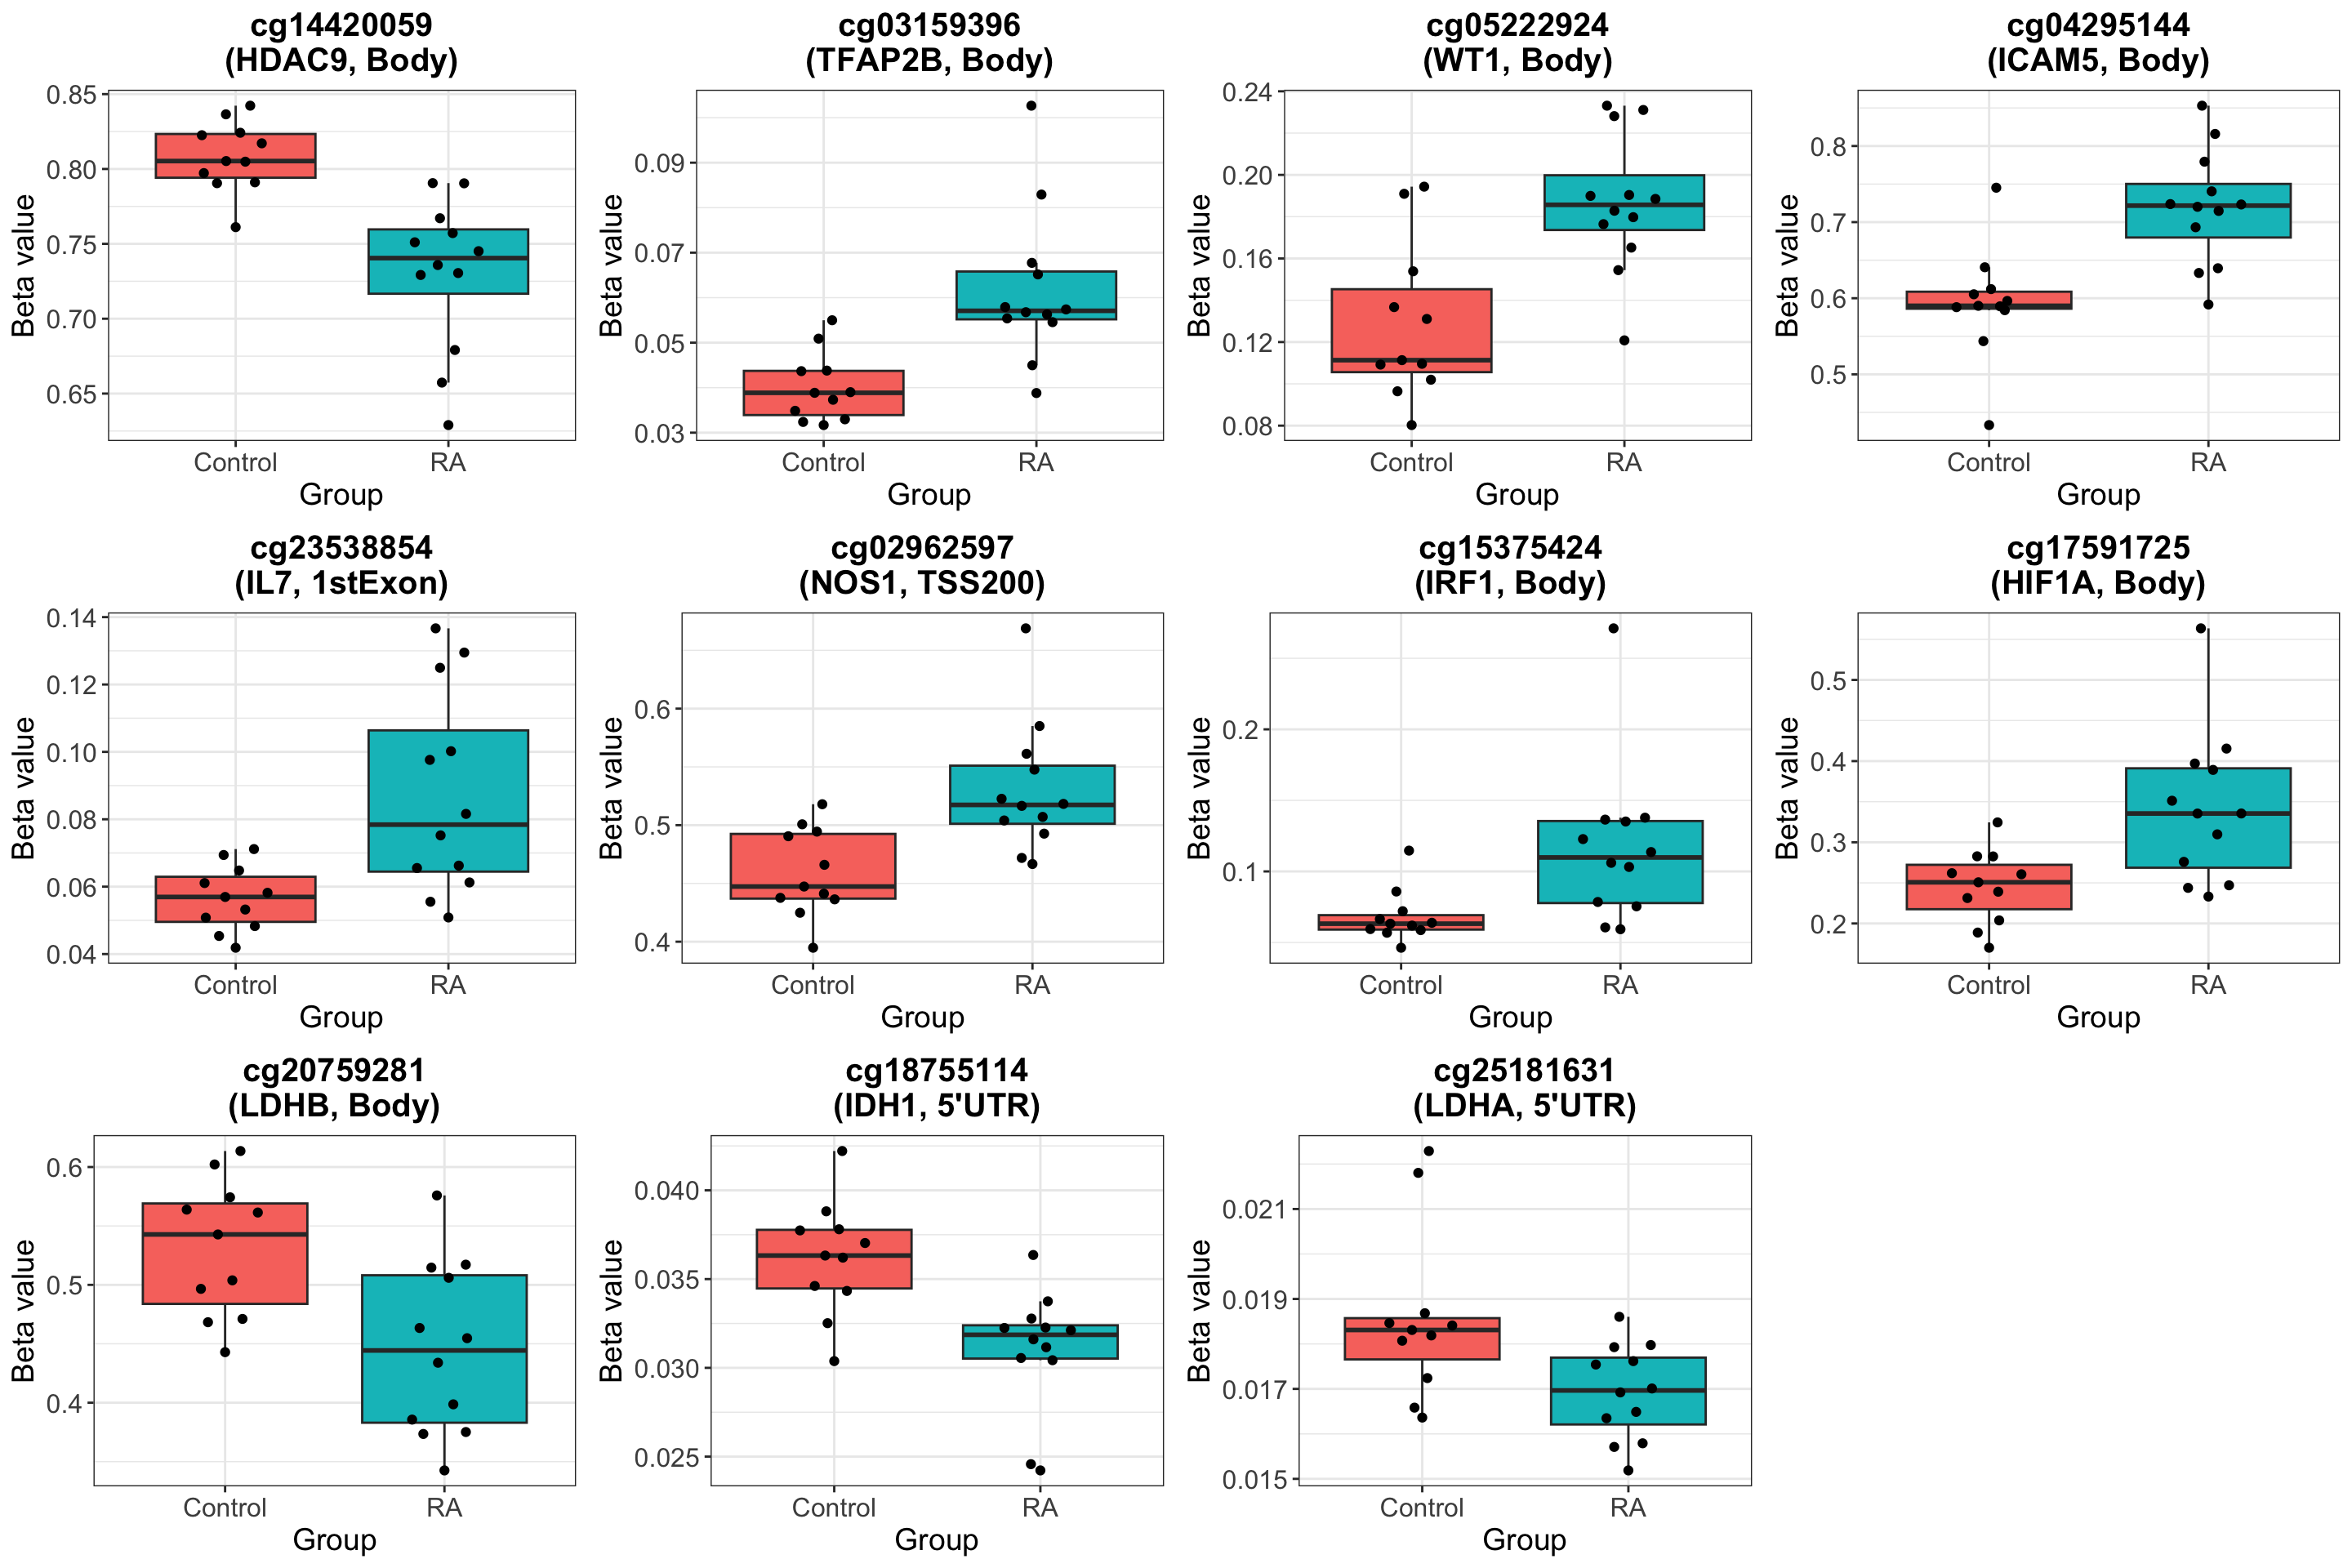
Look at specified gene list
Prepare data
Probes on sex chromosomes are not removed, as some genes in the list are from chrX and chrY
Fix some names
Check if the names are present
Genes not detected
[1] "PHD" "ATP5F1D" "ATP5ME" "NDUF?" Add all DGKs and NDUFs
Visualize results
Visualize top 20 associations
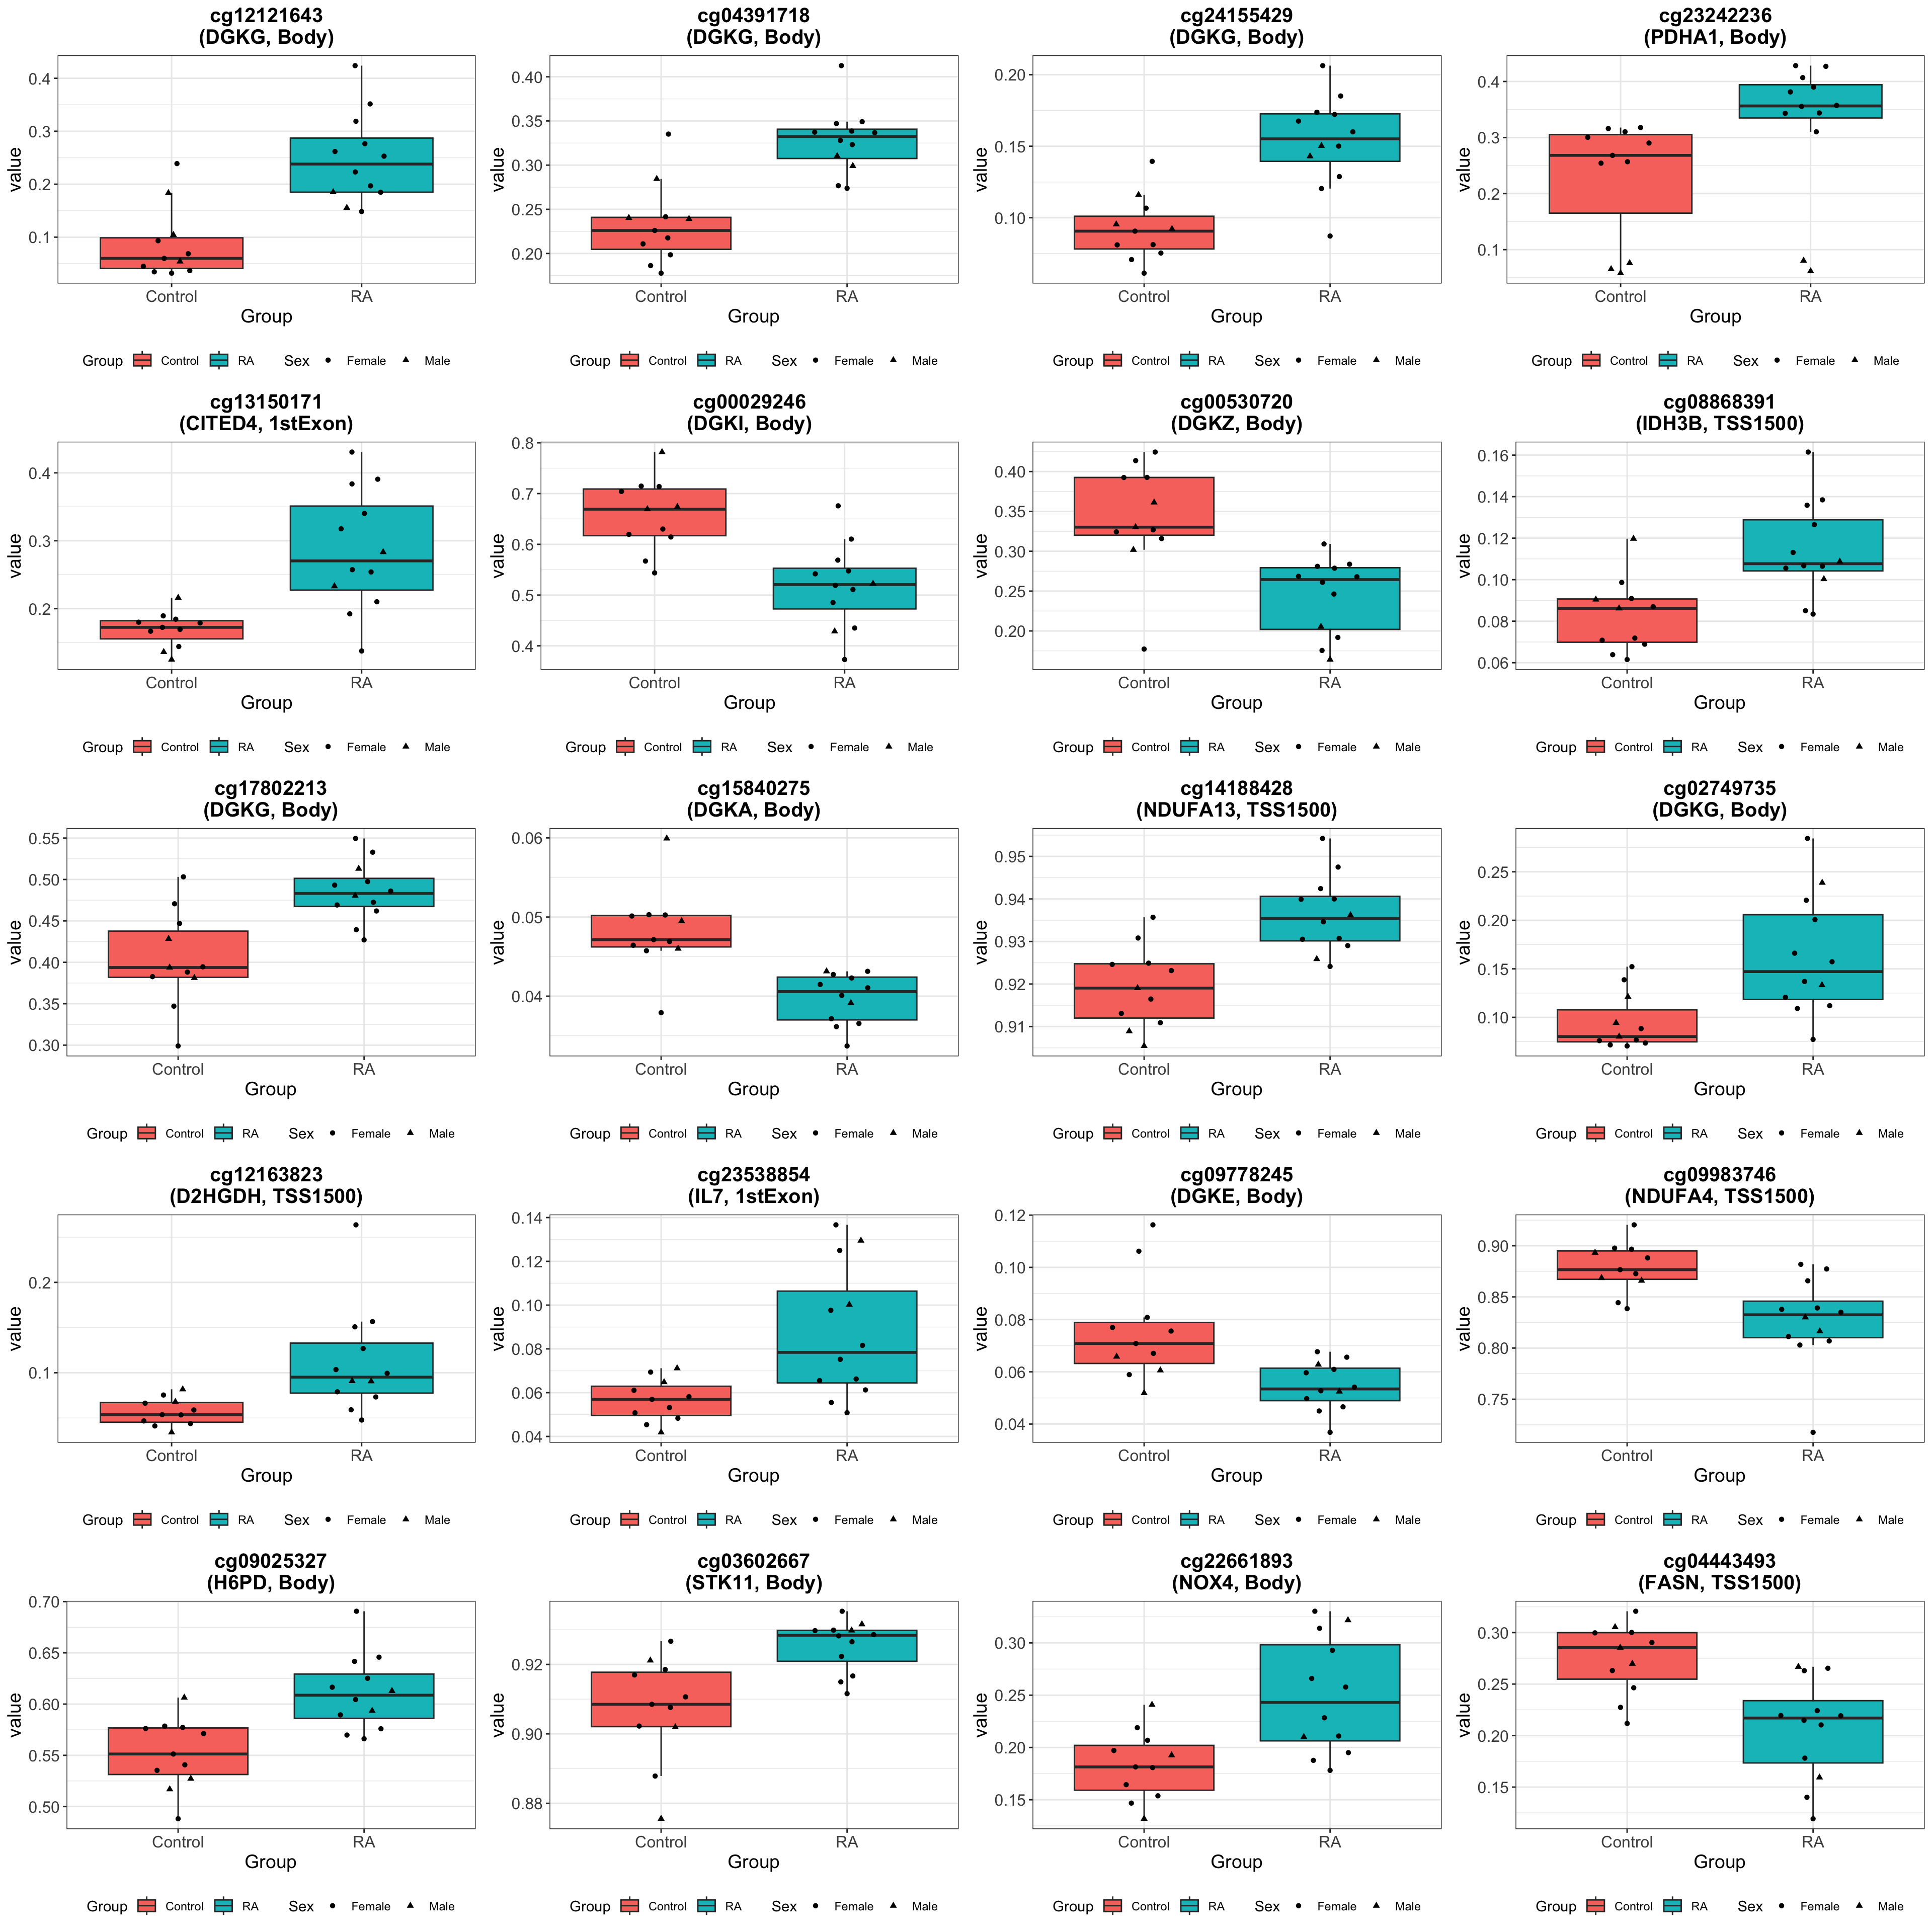
Number of associated CpGs per gene
Correlating methylation signature with protein and phosphoprotein expression
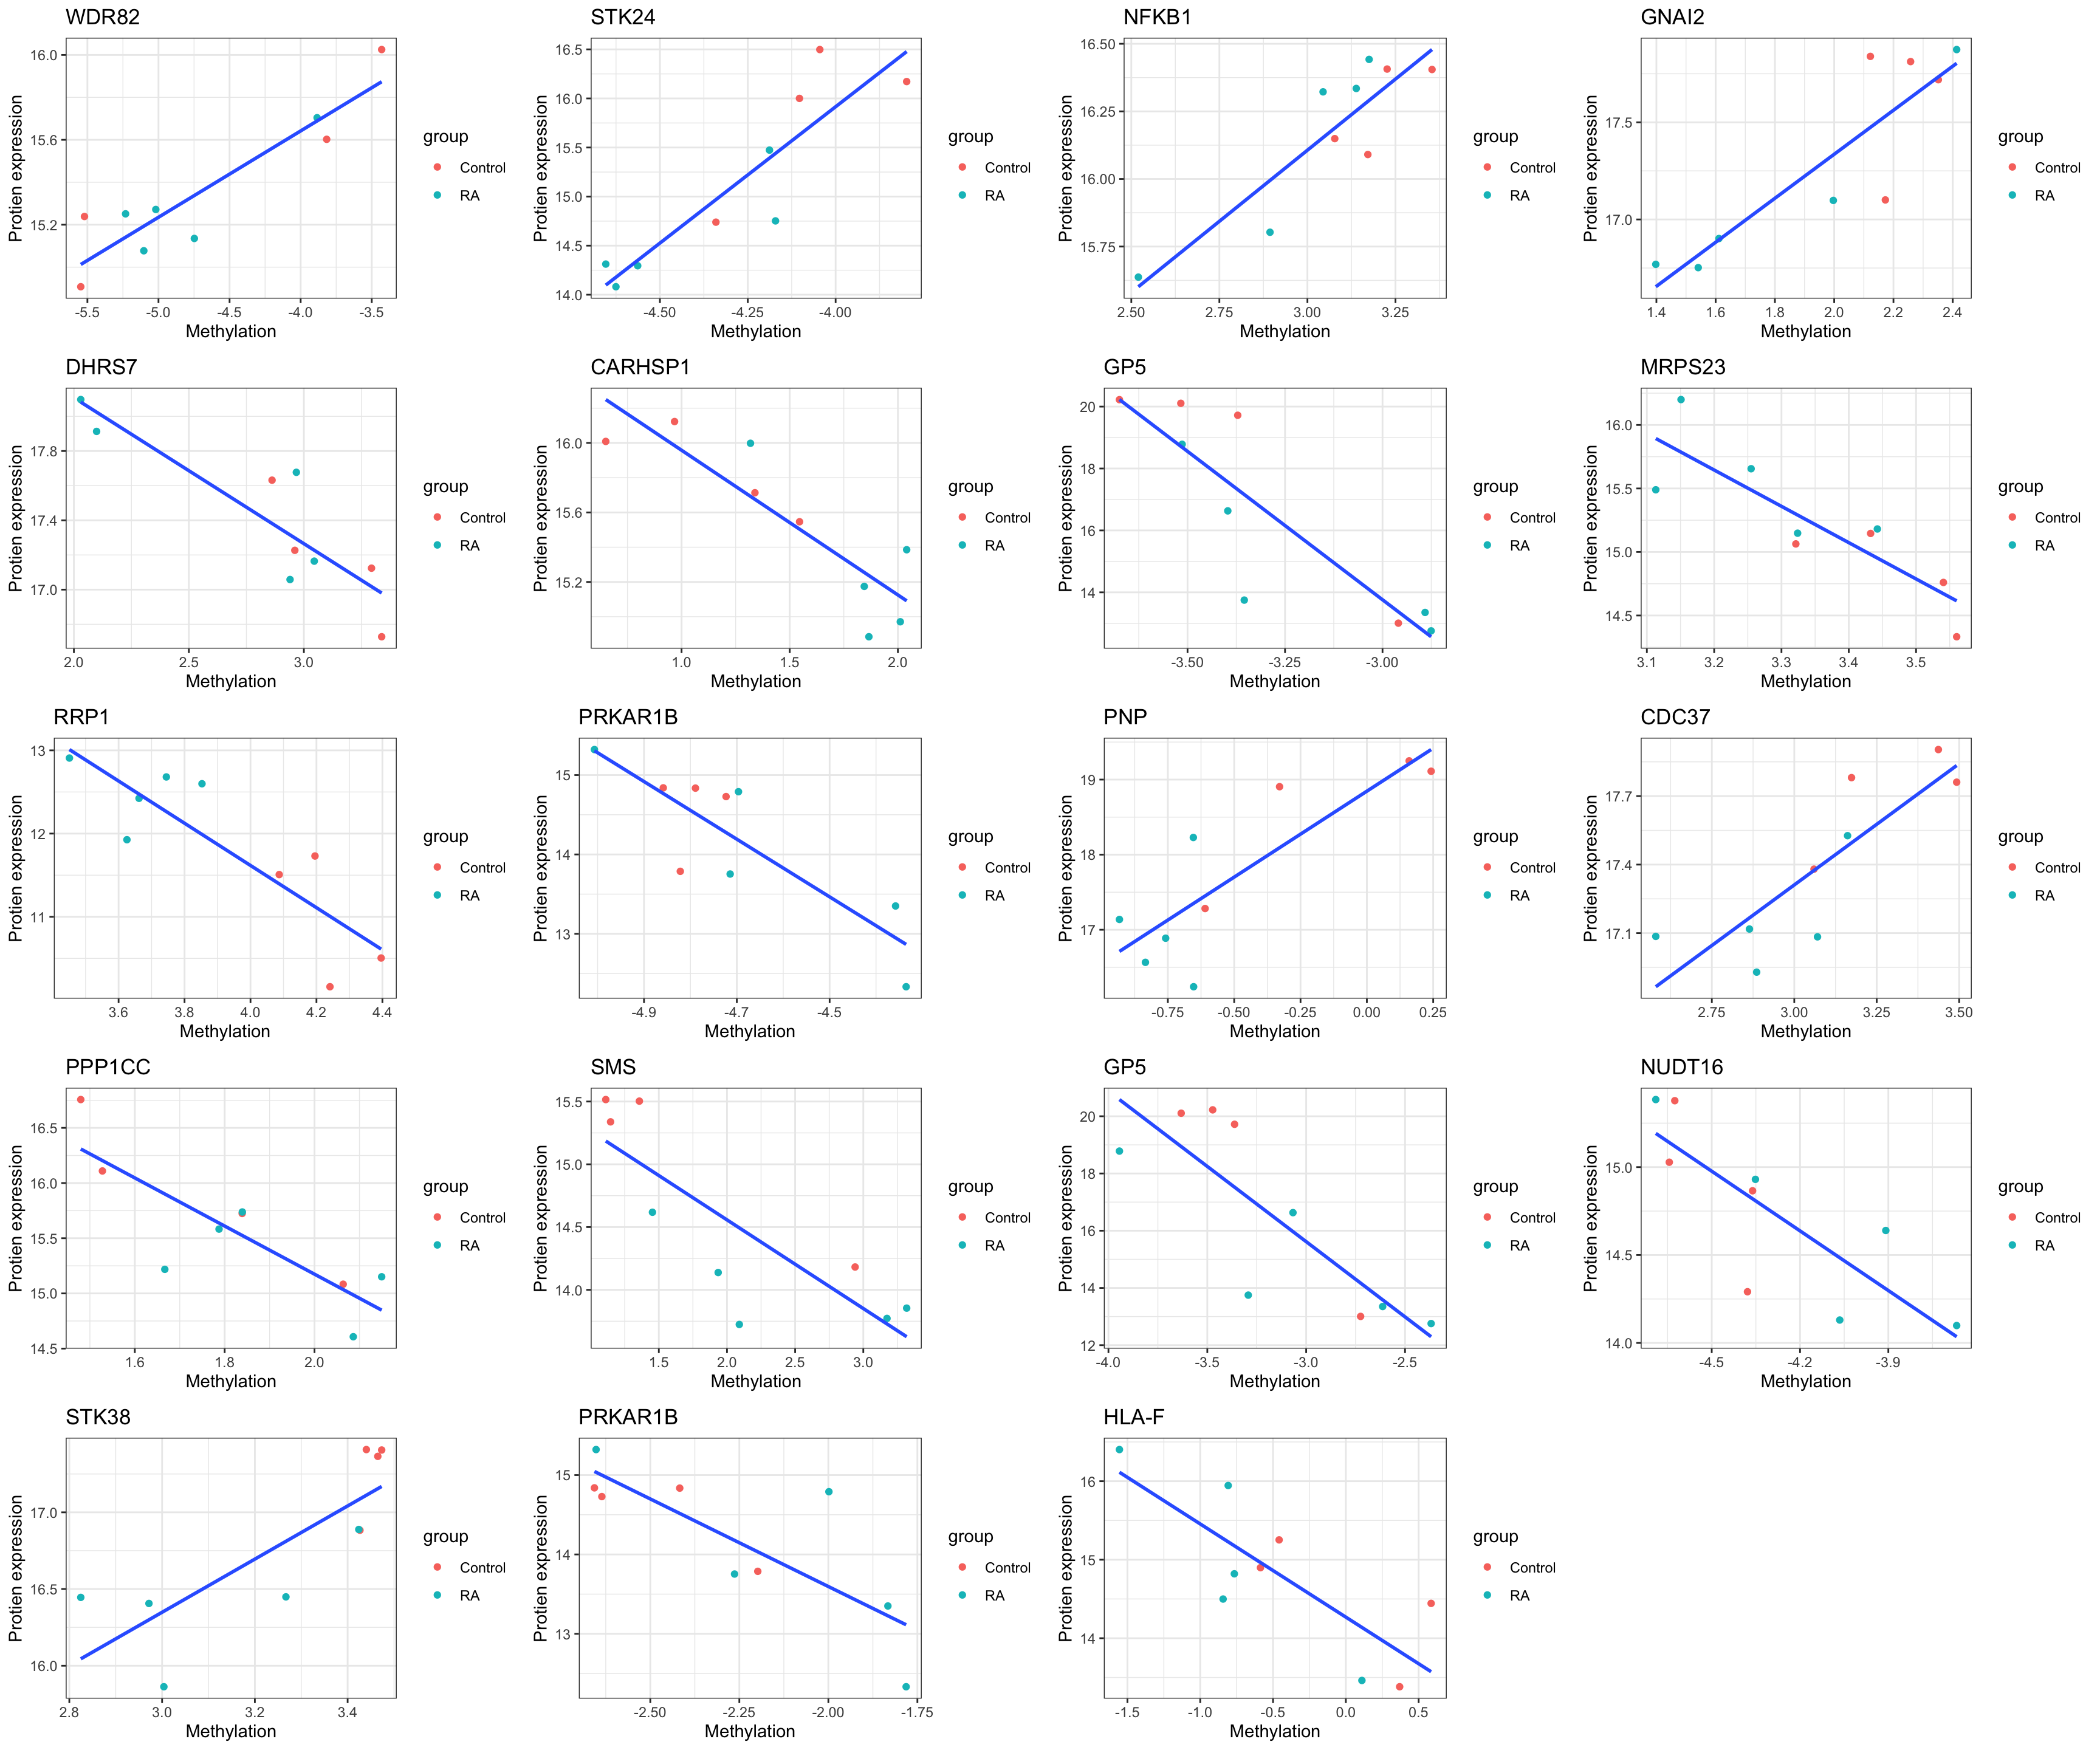
Correlate methylation with protein abundance
Because of small sample size, only focus on cis-regulations
 No strong associations
Significant associations with p < 0.01
Plot
Methylations associations with DNMT1_S143 phosphorylation
DMST1_S143 phosphorylation showed association with phenotype and may reflect the activity of DMNT1 protein
[1] 572171 5How many are known to be associated with the phenotype?
FALSE  TRUE
14581   130
Table of CpGs that associated with DNMT1_S143 phosphorylation and also RA phenotype
Among above CpGs, any of them also associate with protein expression?
# A tibble: 0 × 10
# ℹ 10 variables: methID <chr>, logFC <dbl>, AveExpr <dbl>, t <dbl>,
#   P.Value <dbl>, adj.P.Val <dbl>, B <dbl>, symbol <chr>, site <chr>,
#   ifGroup <lgl>
Unfortunately no.
R version 4.2.0 (2022-04-22)
Platform: x86_64-apple-darwin17.0 (64-bit)
Running under: macOS Big Sur/Monterey 10.16

Matrix products: default
BLAS:   /Library/Frameworks/R.framework/Versions/4.2/Resources/lib/libRblas.0.dylib
LAPACK: /Library/Frameworks/R.framework/Versions/4.2/Resources/lib/libRlapack.dylib

locale:
[1] en_US.UTF-8/en_US.UTF-8/en_US.UTF-8/C/en_US.UTF-8/en_US.UTF-8

attached base packages:
[1] stats4    stats     graphics  grDevices utils     datasets  methods
[8] base

other attached packages:
 [1] BiocParallel_1.30.3         MultiAssayExperiment_1.22.0
 [3] forcats_0.5.1               stringr_1.4.1
 [5] dplyr_1.1.4.9000            purrr_0.3.4
 [7] readr_2.1.2                 tidyr_1.2.0
 [9] tibble_3.2.1                ggplot2_3.4.1
[11] tidyverse_1.3.2             pheatmap_1.0.12
[13] SummarizedExperiment_1.26.1 Biobase_2.56.0
[15] GenomicRanges_1.48.0        GenomeInfoDb_1.32.2
[17] IRanges_2.30.0              S4Vectors_0.34.0
[19] BiocGenerics_0.42.0         MatrixGenerics_1.8.1
[21] matrixStats_0.62.0          limma_3.52.2

loaded via a namespace (and not attached):
  [1] ggbeeswarm_0.6.0       googledrive_2.0.0      colorspace_2.0-3
  [4] ellipsis_0.3.2         rprojroot_2.0.3        XVector_0.36.0
  [7] fs_1.5.2               rstudioapi_0.13        farver_2.1.1
 [10] DT_0.23                ggrepel_0.9.1          bit64_4.0.5
 [13] AnnotationDbi_1.58.0   fansi_1.0.6            lubridate_1.8.0
 [16] xml2_1.3.3             codetools_0.2-18       splines_4.2.0
 [19] cachem_1.0.6           knitr_1.39             jsonlite_1.8.3
 [22] workflowr_1.7.0        broom_1.0.0            annotate_1.74.0
 [25] dbplyr_2.2.1           png_0.1-7              compiler_4.2.0
 [28] httr_1.4.3             backports_1.4.1        assertthat_0.2.1
 [31] Matrix_1.5-4           fastmap_1.1.0          gargle_1.2.0
 [34] cli_3.6.2              later_1.3.0            htmltools_0.5.4
 [37] tools_4.2.0            gtable_0.3.0           glue_1.7.0
 [40] GenomeInfoDbData_1.2.8 Rcpp_1.0.9             cellranger_1.1.0
 [43] jquerylib_0.1.4        vctrs_0.6.5            Biostrings_2.64.0
 [46] writexl_1.4.0          nlme_3.1-158           crosstalk_1.2.0
 [49] xfun_0.31              rvest_1.0.2            lifecycle_1.0.4
 [52] XML_3.99-0.10          googlesheets4_1.0.0    zlibbioc_1.42.0
 [55] scales_1.2.0           ragg_1.2.2             hms_1.1.1
 [58] promises_1.2.0.1       parallel_4.2.0         RColorBrewer_1.1-3
 [61] yaml_2.3.5             memoise_2.0.1          sass_0.4.2
 [64] stringi_1.7.8          RSQLite_2.2.15         highr_0.9
 [67] genefilter_1.78.0      systemfonts_1.0.4      rlang_1.1.3
 [70] pkgconfig_2.0.3        bitops_1.0-7           evaluate_0.15
 [73] lattice_0.20-45        htmlwidgets_1.5.4      labeling_0.4.2
 [76] cowplot_1.1.1          bit_4.0.4              tidyselect_1.2.1
 [79] magrittr_2.0.3         R6_2.5.1               generics_0.1.3
 [82] DelayedArray_0.22.0    DBI_1.1.3              mgcv_1.8-40
 [85] pillar_1.9.0           haven_2.5.0            withr_3.0.0
 [88] survival_3.4-0         KEGGREST_1.36.3        RCurl_1.98-1.7
 [91] modelr_0.1.8           crayon_1.5.2           utf8_1.2.4
 [94] tzdb_0.3.0             rmarkdown_2.14         grid_4.2.0
 [97] readxl_1.4.0           blob_1.2.3             git2r_0.30.1
[100] reprex_2.0.1           digest_0.6.30          xtable_1.8-4
[103] httpuv_1.6.6           textshaping_0.3.6      munsell_0.5.0
[106] beeswarm_0.4.0         vipor_0.4.5            bslib_0.4.1