Preprocessing of methylation data
Junyan Lu
Last updated: 2024-05-21
Checks: 5 1
Knit directory: RA_Tcell_omics/analysis/
This reproducible R Markdown analysis was created with workflowr (version 1.7.0). The Checks tab describes the reproducibility checks that were applied when the results were created. The Past versions tab lists the development history.
Great job! The global environment was empty. Objects defined in the global environment can affect the analysis in your R Markdown file in unknown ways. For reproduciblity it’s best to always run the code in an empty environment.
The command set.seed(20221110) was run prior to running
the code in the R Markdown file. Setting a seed ensures that any results
that rely on randomness, e.g. subsampling or permutations, are
reproducible.
Great job! Recording the operating system, R version, and package versions is critical for reproducibility.
Nice! There were no cached chunks for this analysis, so you can be confident that you successfully produced the results during this run.
Great job! Using relative paths to the files within your workflowr project makes it easier to run your code on other machines.
Tracking code development and connecting the code version to the
results is critical for reproducibility. To start using Git, open the
Terminal and type git init in your project directory.
This project is not being versioned with Git. To obtain the full
reproducibility benefits of using workflowr, please see
?wflow_start.
Load packages
library(minfi)Loading required package: BiocGenerics
Attaching package: 'BiocGenerics'The following objects are masked from 'package:stats':
IQR, mad, sd, var, xtabsThe following objects are masked from 'package:base':
anyDuplicated, append, as.data.frame, basename, cbind, colnames,
dirname, do.call, duplicated, eval, evalq, Filter, Find, get, grep,
grepl, intersect, is.unsorted, lapply, Map, mapply, match, mget,
order, paste, pmax, pmax.int, pmin, pmin.int, Position, rank,
rbind, Reduce, rownames, sapply, setdiff, sort, table, tapply,
union, unique, unsplit, which.max, which.minLoading required package: GenomicRangesLoading required package: stats4Loading required package: S4Vectors
Attaching package: 'S4Vectors'The following objects are masked from 'package:base':
expand.grid, I, unnameLoading required package: IRangesLoading required package: GenomeInfoDbLoading required package: SummarizedExperimentLoading required package: MatrixGenericsLoading required package: matrixStats
Attaching package: 'MatrixGenerics'The following objects are masked from 'package:matrixStats':
colAlls, colAnyNAs, colAnys, colAvgsPerRowSet, colCollapse,
colCounts, colCummaxs, colCummins, colCumprods, colCumsums,
colDiffs, colIQRDiffs, colIQRs, colLogSumExps, colMadDiffs,
colMads, colMaxs, colMeans2, colMedians, colMins, colOrderStats,
colProds, colQuantiles, colRanges, colRanks, colSdDiffs, colSds,
colSums2, colTabulates, colVarDiffs, colVars, colWeightedMads,
colWeightedMeans, colWeightedMedians, colWeightedSds,
colWeightedVars, rowAlls, rowAnyNAs, rowAnys, rowAvgsPerColSet,
rowCollapse, rowCounts, rowCummaxs, rowCummins, rowCumprods,
rowCumsums, rowDiffs, rowIQRDiffs, rowIQRs, rowLogSumExps,
rowMadDiffs, rowMads, rowMaxs, rowMeans2, rowMedians, rowMins,
rowOrderStats, rowProds, rowQuantiles, rowRanges, rowRanks,
rowSdDiffs, rowSds, rowSums2, rowTabulates, rowVarDiffs, rowVars,
rowWeightedMads, rowWeightedMeans, rowWeightedMedians,
rowWeightedSds, rowWeightedVarsLoading required package: BiobaseWelcome to Bioconductor
Vignettes contain introductory material; view with
'browseVignettes()'. To cite Bioconductor, see
'citation("Biobase")', and for packages 'citation("pkgname")'.
Attaching package: 'Biobase'The following object is masked from 'package:MatrixGenerics':
rowMediansThe following objects are masked from 'package:matrixStats':
anyMissing, rowMediansLoading required package: BiostringsLoading required package: XVector
Attaching package: 'Biostrings'The following object is masked from 'package:base':
strsplitLoading required package: bumphunterLoading required package: foreachLoading required package: iteratorsLoading required package: parallelLoading required package: locfitlocfit 1.5-9.6 2022-07-11Setting options('download.file.method.GEOquery'='auto')Setting options('GEOquery.inmemory.gpl'=FALSE)library(SummarizedExperiment)
library(ggplot2)
library(tidyverse)── Attaching packages
───────────────────────────────────────
tidyverse 1.3.2 ──✔ tibble 3.2.1 ✔ dplyr 1.1.4.9000
✔ tidyr 1.2.0 ✔ stringr 1.4.1
✔ readr 2.1.2 ✔ forcats 0.5.1
✔ purrr 0.3.4
── Conflicts ────────────────────────────────────────── tidyverse_conflicts() ──
✖ purrr::accumulate() masks foreach::accumulate()
✖ dplyr::collapse() masks Biostrings::collapse(), IRanges::collapse()
✖ dplyr::combine() masks minfi::combine(), Biobase::combine(), BiocGenerics::combine()
✖ purrr::compact() masks XVector::compact()
✖ dplyr::count() masks matrixStats::count()
✖ dplyr::desc() masks IRanges::desc()
✖ tidyr::expand() masks S4Vectors::expand()
✖ dplyr::filter() masks stats::filter()
✖ dplyr::first() masks S4Vectors::first()
✖ dplyr::lag() masks stats::lag()
✖ purrr::none() masks locfit::none()
✖ ggplot2::Position() masks BiocGenerics::Position(), base::Position()
✖ purrr::reduce() masks GenomicRanges::reduce(), IRanges::reduce()
✖ dplyr::rename() masks S4Vectors::rename()
✖ dplyr::slice() masks XVector::slice(), IRanges::slice()
✖ purrr::when() masks foreach::when()Prepare sample sheet
File list
fileList <- list.files("../data/", pattern = ".idat", recursive = T, full.names = T)
length(fileList)
[1] 46Read sample annotation
sampleAnno <- readxl::read_xlsx("../data/Methylation/samplesheet_2022-272-IL_METUHE_N=23.xlsx", skip  = 8) %>%
    select(Sample_ID, Sample_Name, SentrixBarcode_A, SentrixPosition_A, Gender) %>%
    dplyr::rename(Slide = SentrixBarcode_A,
                  Array = SentrixPosition_A) %>%
    mutate(Slide = as.character(Slide))
New names:
• `Replicate` -> `Replicate...11`
• `Parent1` -> `Parent1...12`
• `Parent2` -> `Parent2...13`
• `Replicate` -> `Replicate...15`
• `Parent1` -> `Parent1...16`
• `Parent2` -> `Parent2...17`dim(sampleAnno)[1] 23 5Create sample sheet
sampleSheet <- tibble(Basename = fileList) %>%
    mutate(Basename = str_remove(Basename, "_Grn.idat|_Red.idat")) %>%
    distinct(Basename) %>%
    mutate(Array = str_extract(Basename, "(?<=_)R0.+"),
           Slide = str_extract(Basename, "(?<=METUHE/).*(?=/)")) %>%
    left_join(sampleAnno, by = c("Slide","Array")) %>%
    mutate(Group = ifelse(str_detect(Sample_Name, "RA"),"RA","Control"))
dim(sampleSheet)
[1] 23 7Fixing sex annotation
sampleSheet[sampleSheet$Sample_Name == "RA301",]$Gender = "Female" #based on a later data table "MultiOmics Patien Data.xlsx"
sampleSheet[sampleSheet$Sample_Name == "RA77",]$Gender = "Female" #based on a later data table "MultiOmics Patien Data.xlsx"and PCA, although in this table , it's male

sampleSheet[sampleSheet$Sample_Name == "HC5",]$Gender = "Female" #In both meta tables, it's male, but based on PCA, it's clearly a female sample
Reading IDAT files
RGSet <- read.metharray.exp(targets = sampleSheet)Normalisation of raw intensity measurements
The function preprocessFunnorm implements the functional normalization algorithm developed in (Jean-Philippe Fortin et al. 2014). Briefly, it uses the internal control probes present on the array to infer between-array technical variation. It is particularly useful for studies comparing conditions with known large-scale differences, such as cancer/normal studies, or between-tissue studies. It has been shown that for such studies, functional normalization outperforms other existing approaches (Jean-Philippe Fortin et al. 2014). By default, the function applies the preprocessNoob function as a first step for background substraction, and uses the first two principal components of the control probes to infer the unwanted variation.
GRSet <- preprocessFunnorm(RGSet)[preprocessFunnorm] Background and dye bias correction with noobLoading required package: IlluminaHumanMethylationEPICmanifestLoading required package: IlluminaHumanMethylationEPICanno.ilm10b4.hg19[preprocessFunnorm] Mapping to genome[preprocessFunnorm] Quantile extraction[preprocessFunnorm] NormalizationCheck normalization results
densityPlot(getBeta(RGSet), sampGroups=RGSet$Sample_Name,
            main="Normalized", legend=FALSE)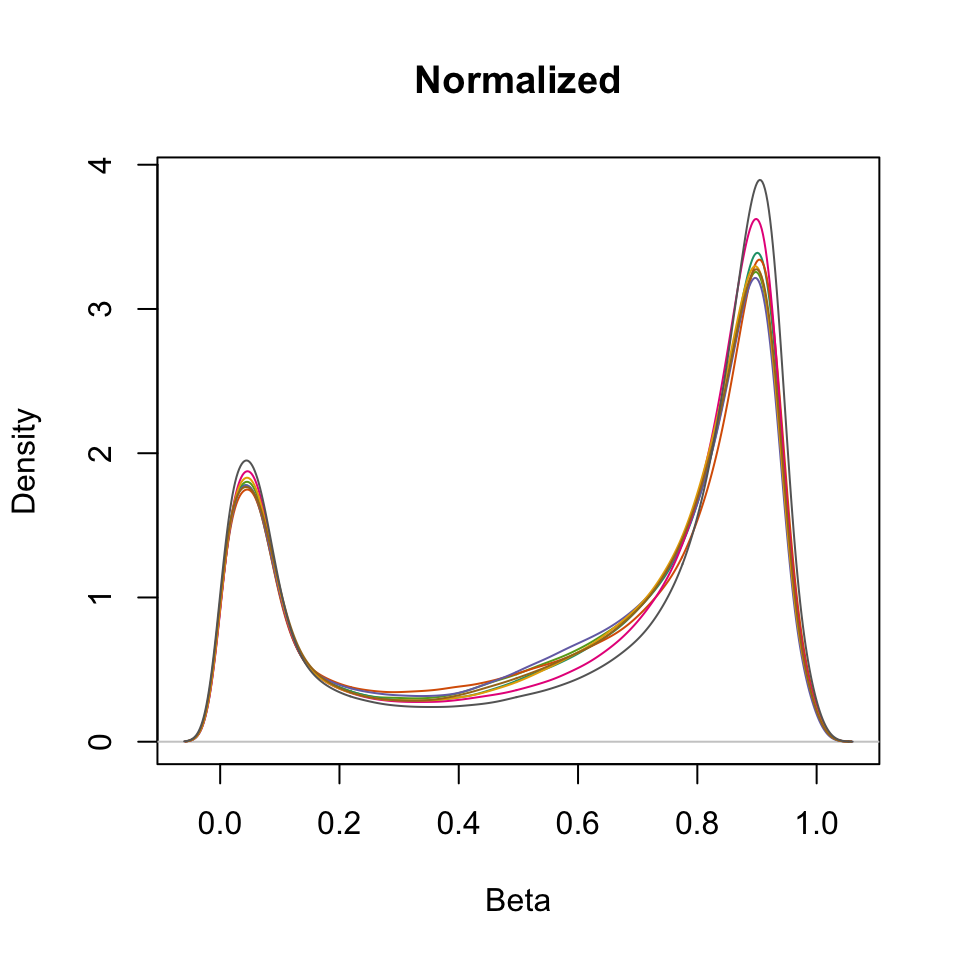
Remove SNPs
Because the presence of SNPs inside the probe body or at the nucleotide extension can have important consequences on the downstream analysis, minfi offers the possibility to remove such probes. The function getSnpInfo, applied to a GenomicRatioSet, returns a data frame with columns containing the SNP information of the probes:
GRSet <- addSnpInfo(GRSet)

#remove SNP probes for further analysis
GRSet <- dropLociWithSnps(GRSet, snps=c("SBE","CpG"), maf=0)
Quality control
Calculate detection p values
detP <- detectionP(RGSet)Is there any poor quality samples?
plotTab <- tibble(sampleID = colnames(detP), meanP = colMeans(detP))
ggplot(plotTab, aes(x=sampleID, y = meanP)) +
geom_bar(stat = "identity") +
theme_bw() +
theme(axis.text.x = element_text(angle = 90, hjust = 1, vjust = 0.5))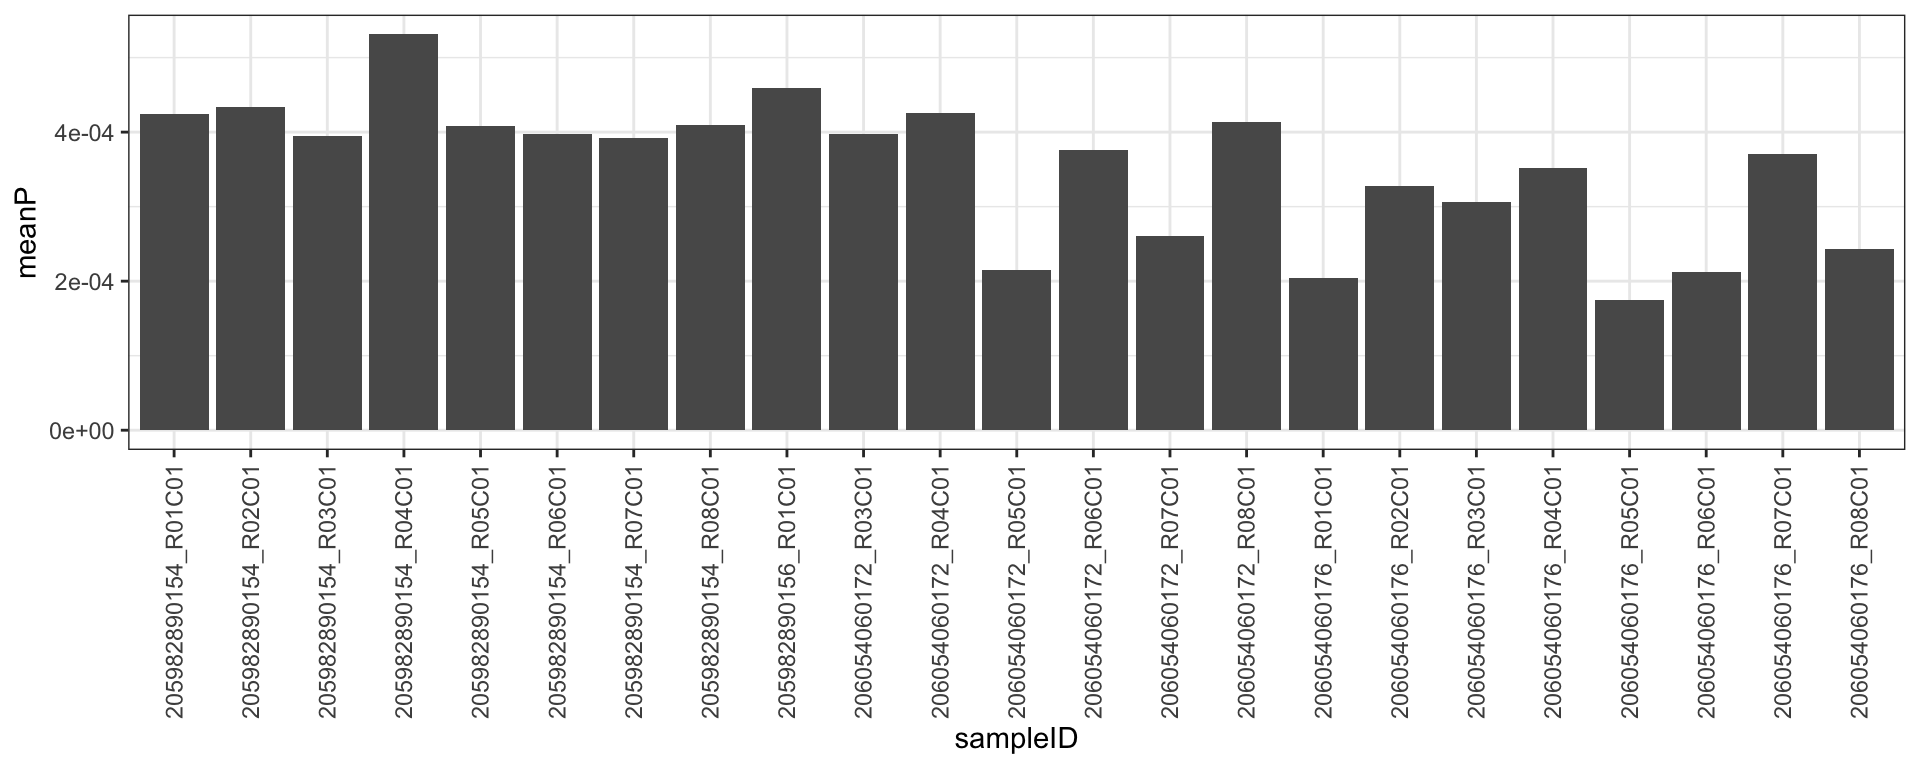 No obvious poor quality samples
Remove low quality probes
detP <- detP[match(featureNames(GRSet), rownames(detP)),]
# remove any probes that have failed in one or more samples
keep <- rowSums(detP < 0.01) == ncol(detP)
table(keep)
keep
FALSE TRUE
3365 832059 GRSet <- GRSet[keep,]Filter out cross-reactive probes
We will also filter out probes that have shown to be cross-reactive, that is, probes that have been demonstrated to map to multiple places in the genome. This list was originally published by Chen et al. (2013) for 450K and https://doi.org/10.1016/j.gdata.2016.05.012 for 850K
Filter probes for 850K
probeIds <- read.table("../data/Methylation/1-s2.0-S221359601630071X-mmc2.txt", stringsAsFactors = FALSE)

keep <- !(featureNames(GRSet) %in% probeIds$V1)
table(keep)
keep
FALSE TRUE
40159 791900 GRSet <- GRSet[keep,]#Save the GRset
save(GRSet, file = "../output/RGSet_filtered_20221118.RData")Get M values
mMat <- getM(GRSet)Create summarise experiment
Annotate CpG using GeneEnhancer
load("../output/rangeListSE.RData")

load("../output/enhancerTab.RData")
enhancerTab <- filter(enhancerTab, !is.na(start),!is.na(end), !is.na(chr))
enhancerTab.unique <- group_by(enhancerTab, enhancerId) %>%
  summarise(enhancerGene = paste0(gene, collapse = ";"),
            enhancerGeneScore = paste0(geneScore, collapse = ";")) %>%
  ungroup()
grOverlap <- findOverlaps(rangeListSE, rowRanges(GRSet))
annoEnhancer <- as_tibble(grOverlap) %>%
  dplyr::rename(i = queryHits, hit = subjectHits) %>%
  mutate(enhancerId = names(rangeListSE)[i], probe = rownames(GRSet)[hit]) %>%
  select(enhancerId, probe) %>%
  left_join(enhancerTab.unique, by = "enhancerId") %>%
  data.frame()
#get rowAnnotation
rowanno850k <- getAnnotation(GRSet)
rowanno850k = rowanno850k[,c(1:4,12:19,22:ncol(rowanno850k))]
#add enhancer information
rowanno850k <- cbind(rowanno850k, annoEnhancer[match(rownames(rowanno850k), annoEnhancer$probe),c("enhancerGene","enhancerGeneScore")])
methData = SummarizedExperiment(assays=list(beta = assays(GRSet)[[1]], M = mMat),
colData=colData(GRSet),
rowRanges=GRanges(seqnames=rowanno850k$chr,
ranges=IRanges(start=rowanno850k$pos,
end=rowanno850k$pos),
strand = rowanno850k$strand,
mcols = as.data.frame(rowanno850k[,4:ncol(rowanno850k)])))
colnames(rowData(methData)) = sub("mcols.","",colnames(rowData(methData)))
#save objects
save(methData, file = "../output/methData_20221118.RData")PCA
#methData <- methData[!seqnames(methData) %in% c("chrX","chrY"),]

methMat <- assays(methData)[["M"]]
sds <- genefilter::rowSds(methMat)
methMat <- methMat[order(sds, decreasing = T)[1:5000],]
colAnno <- colData(methData) %>% as_tibble(rownames = "id")
PC1 versus PC2
pcRes <- prcomp(t(methMat), center = TRUE, scale. = TRUE)
plotTab <- pcRes$x[,1:10] %>% as_tibble(rownames = "id") %>%
    left_join(colAnno)
Joining with `by = join_by(id)`ggplot(plotTab, aes(x=PC1, y=PC2)) +
geom_point(aes(color = Group, shape = Gender)) +
ggrepel::geom_text_repel(aes(label = Sample_Name))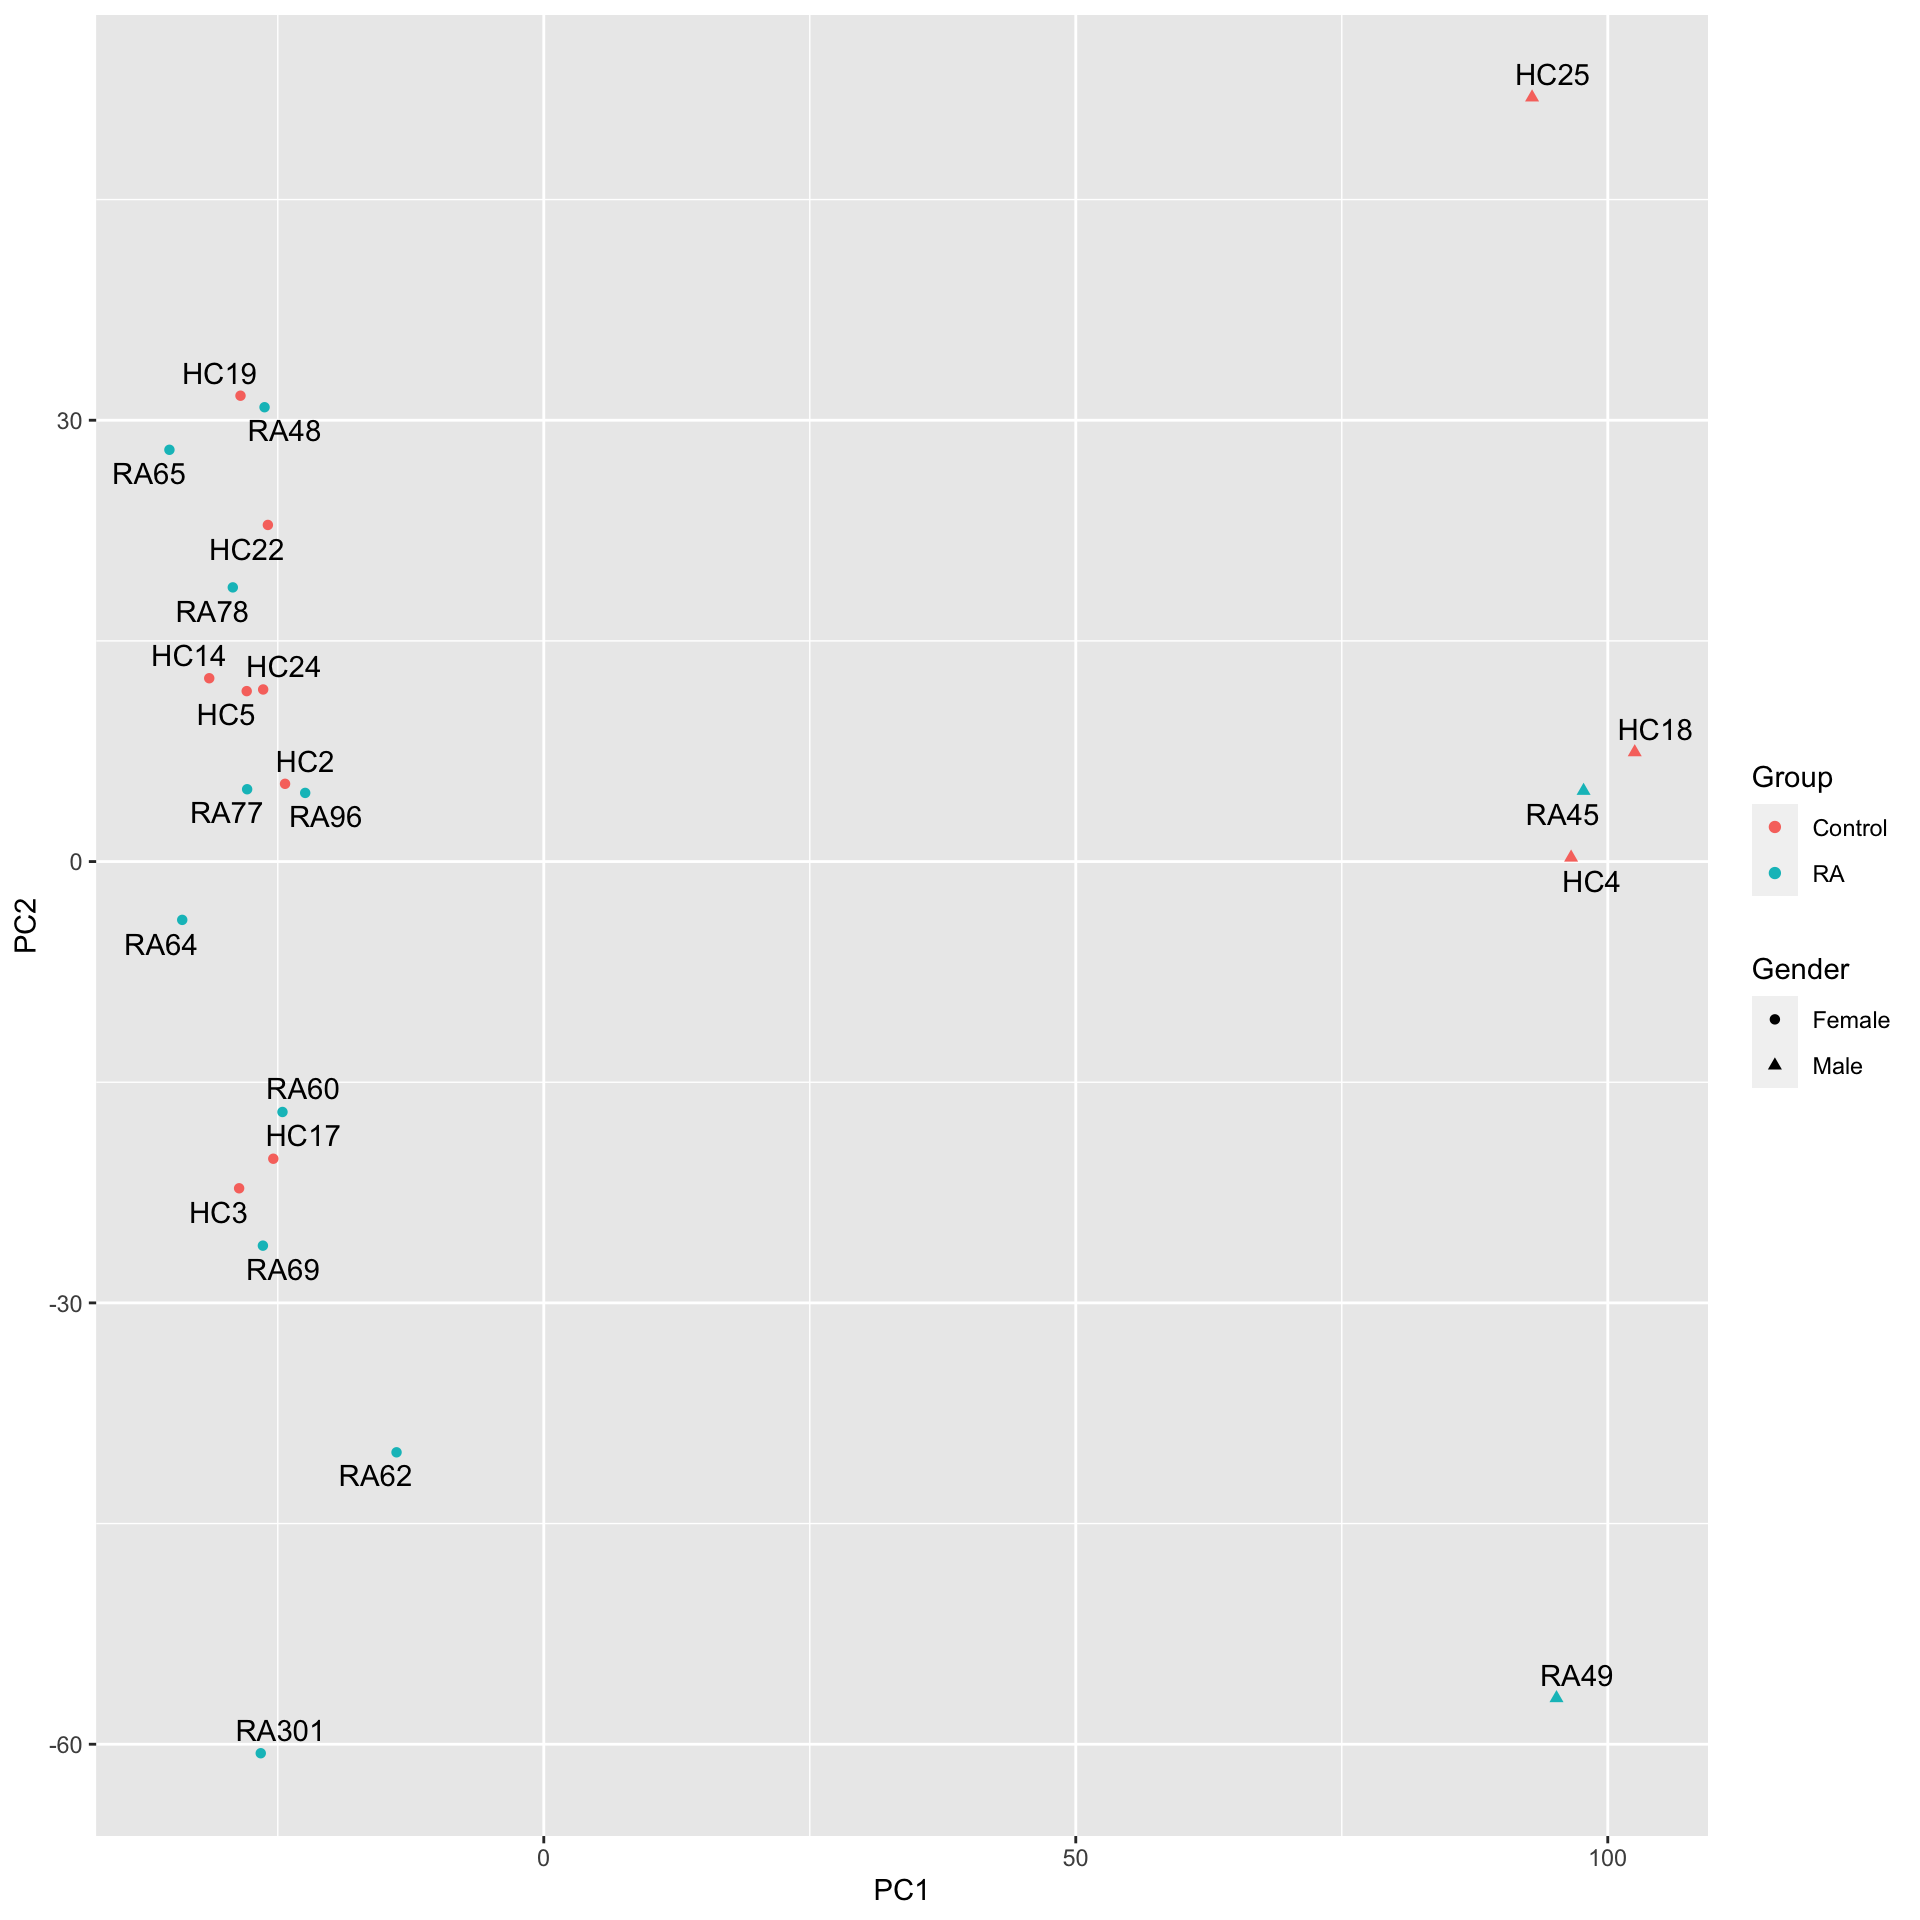 The gender annotation on HC5 may be wrong.
PC3 versus PC4
pcRes <- prcomp(t(methMat), center = TRUE, scale. = TRUE)
plotTab <- pcRes$x[,1:10] %>% as_tibble(rownames = "id") %>%
    left_join(colAnno)
Joining with `by = join_by(id)`ggplot(plotTab, aes(x=PC3, y=PC4)) +
geom_point(aes(color = Group, shape = Gender)) +
ggrepel::geom_text_repel(aes(label = Sample_Name))
sessionInfo()R version 4.2.0 (2022-04-22)
Platform: x86_64-apple-darwin17.0 (64-bit)
Running under: macOS Big Sur/Monterey 10.16
Matrix products: default
BLAS: /Library/Frameworks/R.framework/Versions/4.2/Resources/lib/libRblas.0.dylib
LAPACK: /Library/Frameworks/R.framework/Versions/4.2/Resources/lib/libRlapack.dylib
locale:
[1] en_US.UTF-8/en_US.UTF-8/en_US.UTF-8/C/en_US.UTF-8/en_US.UTF-8
attached base packages:
[1] parallel stats4 stats graphics grDevices utils datasets
[8] methods base
other attached packages:
[1] IlluminaHumanMethylationEPICanno.ilm10b4.hg19_0.6.0
[2] IlluminaHumanMethylationEPICmanifest_0.3.0
[3] forcats_0.5.1
[4] stringr_1.4.1
[5] dplyr_1.1.4.9000
[6] purrr_0.3.4
[7] readr_2.1.2
[8] tidyr_1.2.0
[9] tibble_3.2.1
[10] tidyverse_1.3.2
[11] ggplot2_3.4.1
[12] minfi_1.42.0
[13] bumphunter_1.38.0
[14] locfit_1.5-9.6
[15] iterators_1.0.14
[16] foreach_1.5.2
[17] Biostrings_2.64.0
[18] XVector_0.36.0
[19] SummarizedExperiment_1.26.1
[20] Biobase_2.56.0
[21] MatrixGenerics_1.8.1
[22] matrixStats_0.62.0
[23] GenomicRanges_1.48.0
[24] GenomeInfoDb_1.32.2
[25] IRanges_2.30.0
[26] S4Vectors_0.34.0
[27] BiocGenerics_0.42.0
loaded via a namespace (and not attached):
[1] readxl_1.4.0 backports_1.4.1
[3] workflowr_1.7.0 BiocFileCache_2.4.0
[5] plyr_1.8.7 splines_4.2.0
[7] BiocParallel_1.30.3 digest_0.6.30
[9] htmltools_0.5.4 fansi_1.0.6
[11] magrittr_2.0.3 memoise_2.0.1
[13] googlesheets4_1.0.0 tzdb_0.3.0
[15] limma_3.52.2 annotate_1.74.0
[17] modelr_0.1.8 askpass_1.1
[19] siggenes_1.70.0 prettyunits_1.1.1
[21] colorspace_2.0-3 ggrepel_0.9.1
[23] rvest_1.0.2 blob_1.2.3
[25] rappdirs_0.3.3 haven_2.5.0
[27] xfun_0.31 crayon_1.5.2
[29] RCurl_1.98-1.7 jsonlite_1.8.3
[31] genefilter_1.78.0 GEOquery_2.64.2
[33] survival_3.4-0 glue_1.7.0
[35] gargle_1.2.0 gtable_0.3.0
[37] zlibbioc_1.42.0 DelayedArray_0.22.0
[39] Rhdf5lib_1.18.2 HDF5Array_1.24.1
[41] scales_1.2.0 DBI_1.1.3
[43] rngtools_1.5.2 Rcpp_1.0.9
[45] xtable_1.8-4 progress_1.2.2
[47] bit_4.0.4 mclust_5.4.10
[49] preprocessCore_1.58.0 httr_1.4.3
[51] RColorBrewer_1.1-3 ellipsis_0.3.2
[53] farver_2.1.1 pkgconfig_2.0.3
[55] reshape_0.8.9 XML_3.99-0.10
[57] sass_0.4.2 dbplyr_2.2.1
[59] utf8_1.2.4 labeling_0.4.2
[61] tidyselect_1.2.1 rlang_1.1.3
[63] later_1.3.0 AnnotationDbi_1.58.0
[65] cellranger_1.1.0 munsell_0.5.0
[67] tools_4.2.0 cachem_1.0.6
[69] cli_3.6.2 generics_0.1.3
[71] RSQLite_2.2.15 broom_1.0.0
[73] evaluate_0.15 fastmap_1.1.0
[75] yaml_2.3.5 knitr_1.39
[77] bit64_4.0.5 fs_1.5.2
[79] beanplot_1.3.1 scrime_1.3.5
[81] KEGGREST_1.36.3 nlme_3.1-158
[83] doRNG_1.8.2 sparseMatrixStats_1.8.0
[85] nor1mix_1.3-0 xml2_1.3.3
[87] biomaRt_2.52.0 compiler_4.2.0
[89] rstudioapi_0.13 filelock_1.0.2
[91] curl_4.3.2 png_0.1-7
[93] reprex_2.0.1 bslib_0.4.1
[95] stringi_1.7.8 highr_0.9
[97] GenomicFeatures_1.48.4 lattice_0.20-45
[99] Matrix_1.5-4 multtest_2.52.0
[101] vctrs_0.6.5 pillar_1.9.0
[103] lifecycle_1.0.4 rhdf5filters_1.8.0
[105] jquerylib_0.1.4 data.table_1.14.8
[107] bitops_1.0-7 httpuv_1.6.6
[109] rtracklayer_1.56.1 R6_2.5.1
[111] BiocIO_1.6.0 promises_1.2.0.1
[113] codetools_0.2-18 MASS_7.3-58
[115] assertthat_0.2.1 rhdf5_2.40.0
[117] openssl_2.0.2 rprojroot_2.0.3
[119] rjson_0.2.21 withr_3.0.0
[121] GenomicAlignments_1.32.1 Rsamtools_2.12.0
[123] GenomeInfoDbData_1.2.8 hms_1.1.1
[125] quadprog_1.5-8 grid_4.2.0
[127] base64_2.0.1 rmarkdown_2.14
[129] DelayedMatrixStats_1.18.0 googledrive_2.0.0
[131] illuminaio_0.38.0 git2r_0.30.1
[133] lubridate_1.8.0 restfulr_0.0.15