Identify proteins associated with outcome, delta_UEMS
Junyan Lu
17 May 2024
Last updated: 2024-05-17
Checks: 5 1
Knit directory:
SpinalCord_proteomics/analysis/
This reproducible R Markdown analysis was created with workflowr (version 1.7.0). The Checks tab describes the reproducibility checks that were applied when the results were created. The Past versions tab lists the development history.
Great job! The global environment was empty. Objects defined in the global environment can affect the analysis in your R Markdown file in unknown ways. For reproduciblity it’s best to always run the code in an empty environment.
The command set.seed(20221110) was run prior to running
the code in the R Markdown file. Setting a seed ensures that any results
that rely on randomness, e.g. subsampling or permutations, are
reproducible.
Great job! Recording the operating system, R version, and package versions is critical for reproducibility.
Nice! There were no cached chunks for this analysis, so you can be confident that you successfully produced the results during this run.
Great job! Using relative paths to the files within your workflowr project makes it easier to run your code on other machines.
Tracking code development and connecting the code version to the
results is critical for reproducibility. To start using Git, open the
Terminal and type git init in your project directory.
This project is not being versioned with Git. To obtain the full
reproducibility benefits of using workflowr, please see
?wflow_start.
In treated samples
Those proteins are the candidates to predict treatment response
At baseline (Visit 3)
Subsetting
#subset for patients in the placebo group
protSub <- prepareProt(seProt_corr, filterCondi = list(Treatment ="1", Visit = "3"), perNA = 0.5)
[1] "Number of proteins: 377, number of samples: 74"#protSub <- seProt_corr[,seProt_corr$Treatment %in% 1 & seProt_corr$Visit %in% 3 & !is.na(seProt_corr$delta_UEMS)]
print("How many proteins and samples")[1] "How many proteins and samples"dim(protSub)[1] 377 74Differential expression
design <- model.matrix(~ delta_UEMS, colData(protSub))

resTab <- testDiff(protSub, design, coef = "delta_UEMS", assayName = "imputed")

allResList[["corrOutcome_baseline_treated"]] <- resTab
hist(resTab$pval)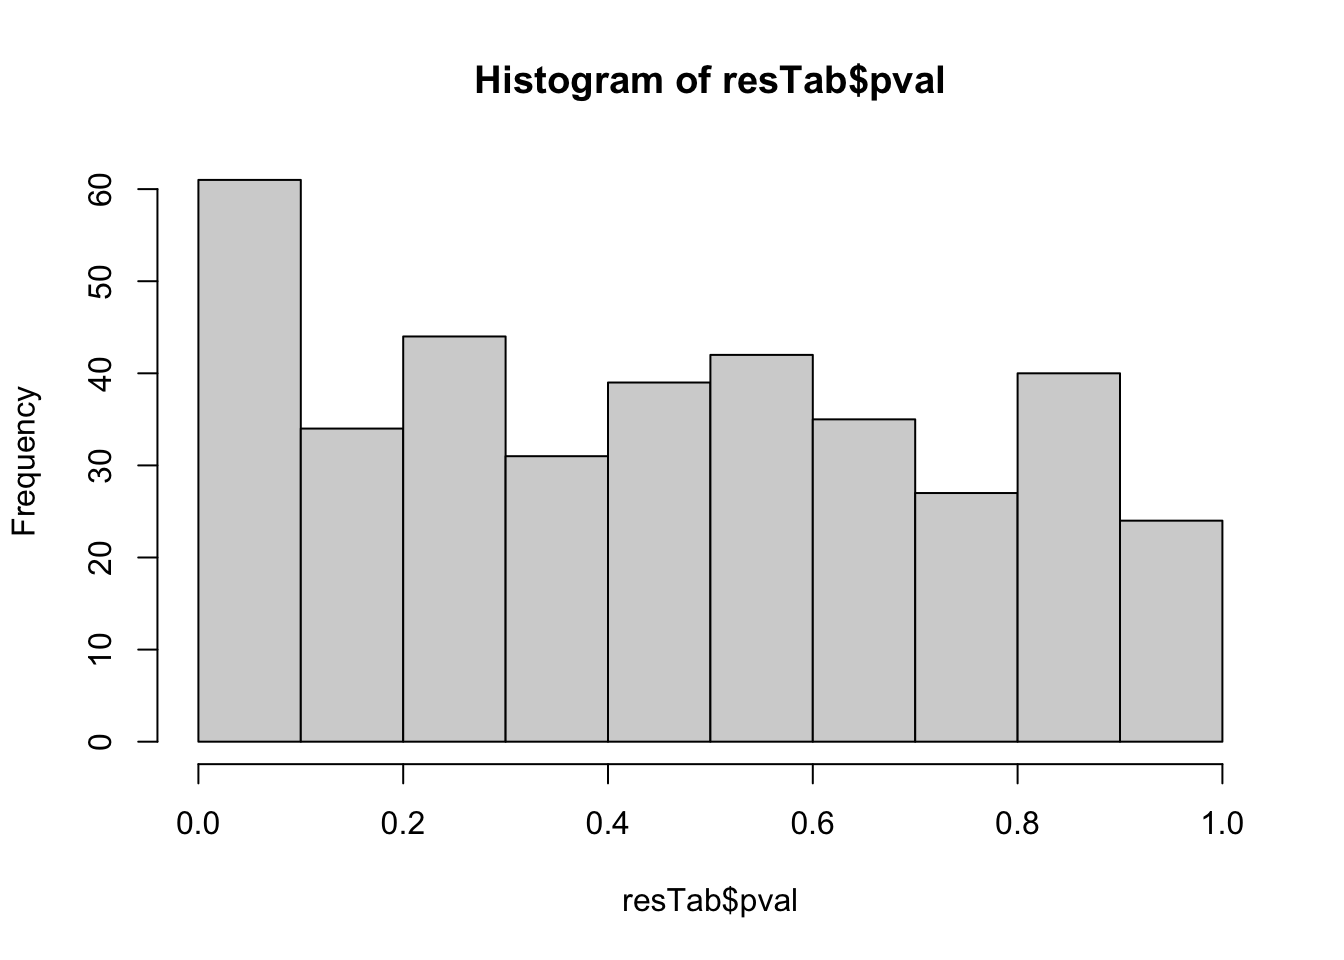
Table of proteins passed raw P-value < 0.05
filter(resTab, pval <= 0.05) %>% mutate(across(where(is.numeric), formatC, digits=2)) %>%
  select(name, symbol, pval, adj_pval, diff, n_obs) %>%
  DT::datatable()
Correlation plot
exprMat <- assays(protSub)[[2]]
pList <- lapply(seq(20), function(i) {
    rec <- resTab[i,]
    plotTab <- tibble(expr = exprMat[rec$name,],
                      nodeGroup = protSub$nodeGroup,
                      delta_UEMS = protSub$delta_UEMS)
    ggplot(plotTab, aes(x=delta_UEMS, y=expr)) +
        geom_point(aes(col = nodeGroup)) +
        ggtitle(sprintf("%s (P=%s)",rec$symbol,formatC(rec$pval, digits = 2))) +
        #scale_color_gradient(low="green",high="red") +
        geom_smooth(method = "lm") +
        theme_bw() +
        theme(plot.title = element_text(hjust = 0.5, face = "bold"))
})

cowplot::plot_grid(plotlist = pList, ncol=4)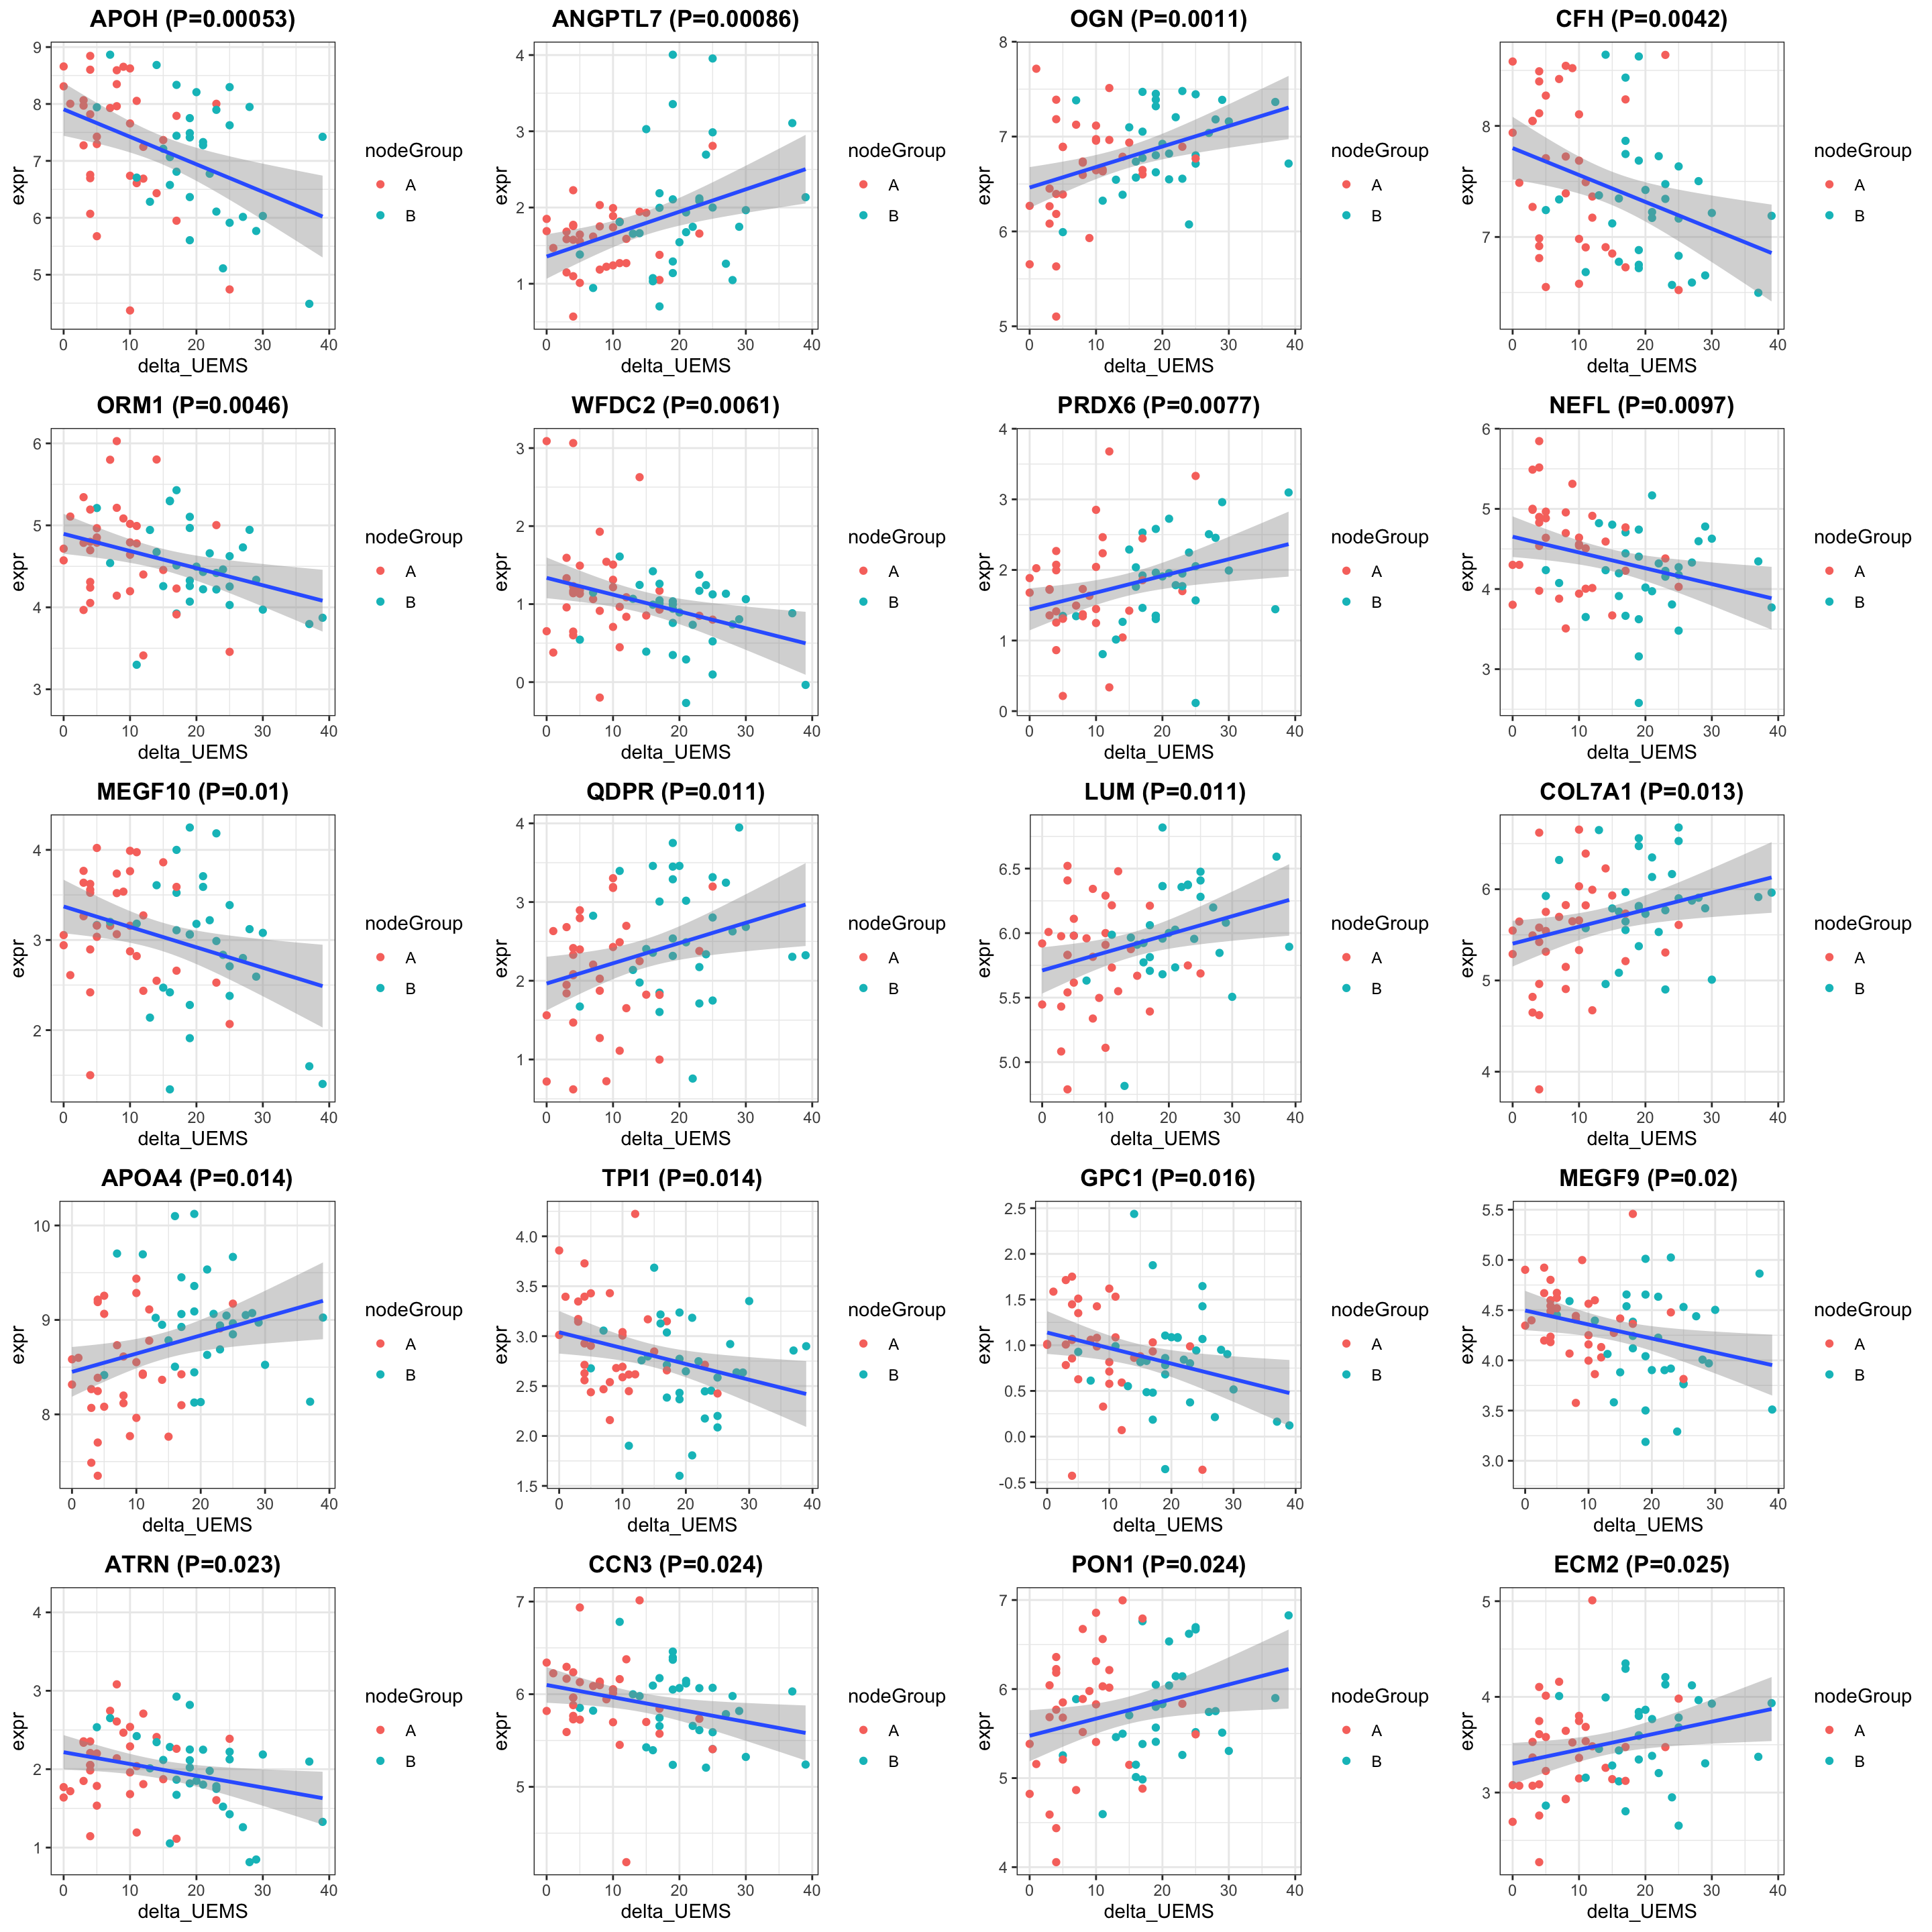
Enrichment analysis
gmts = list(GO_BiologicalProcess = "../data/gmts/c5.go.bp.v2023.2.Hs.symbols.gmt",
            GO_MolecularFunction = "../data/gmts/c5.go.mf.v2023.2.Hs.symbols.gmt")
plotList <- runGeneSetEnrichment(resTab, gmts, genePCut  = 1, pCutSet = 0.05, setFdr = FALSE, method = "gsea")
[1] "No sets passed the criteria"plotList$plot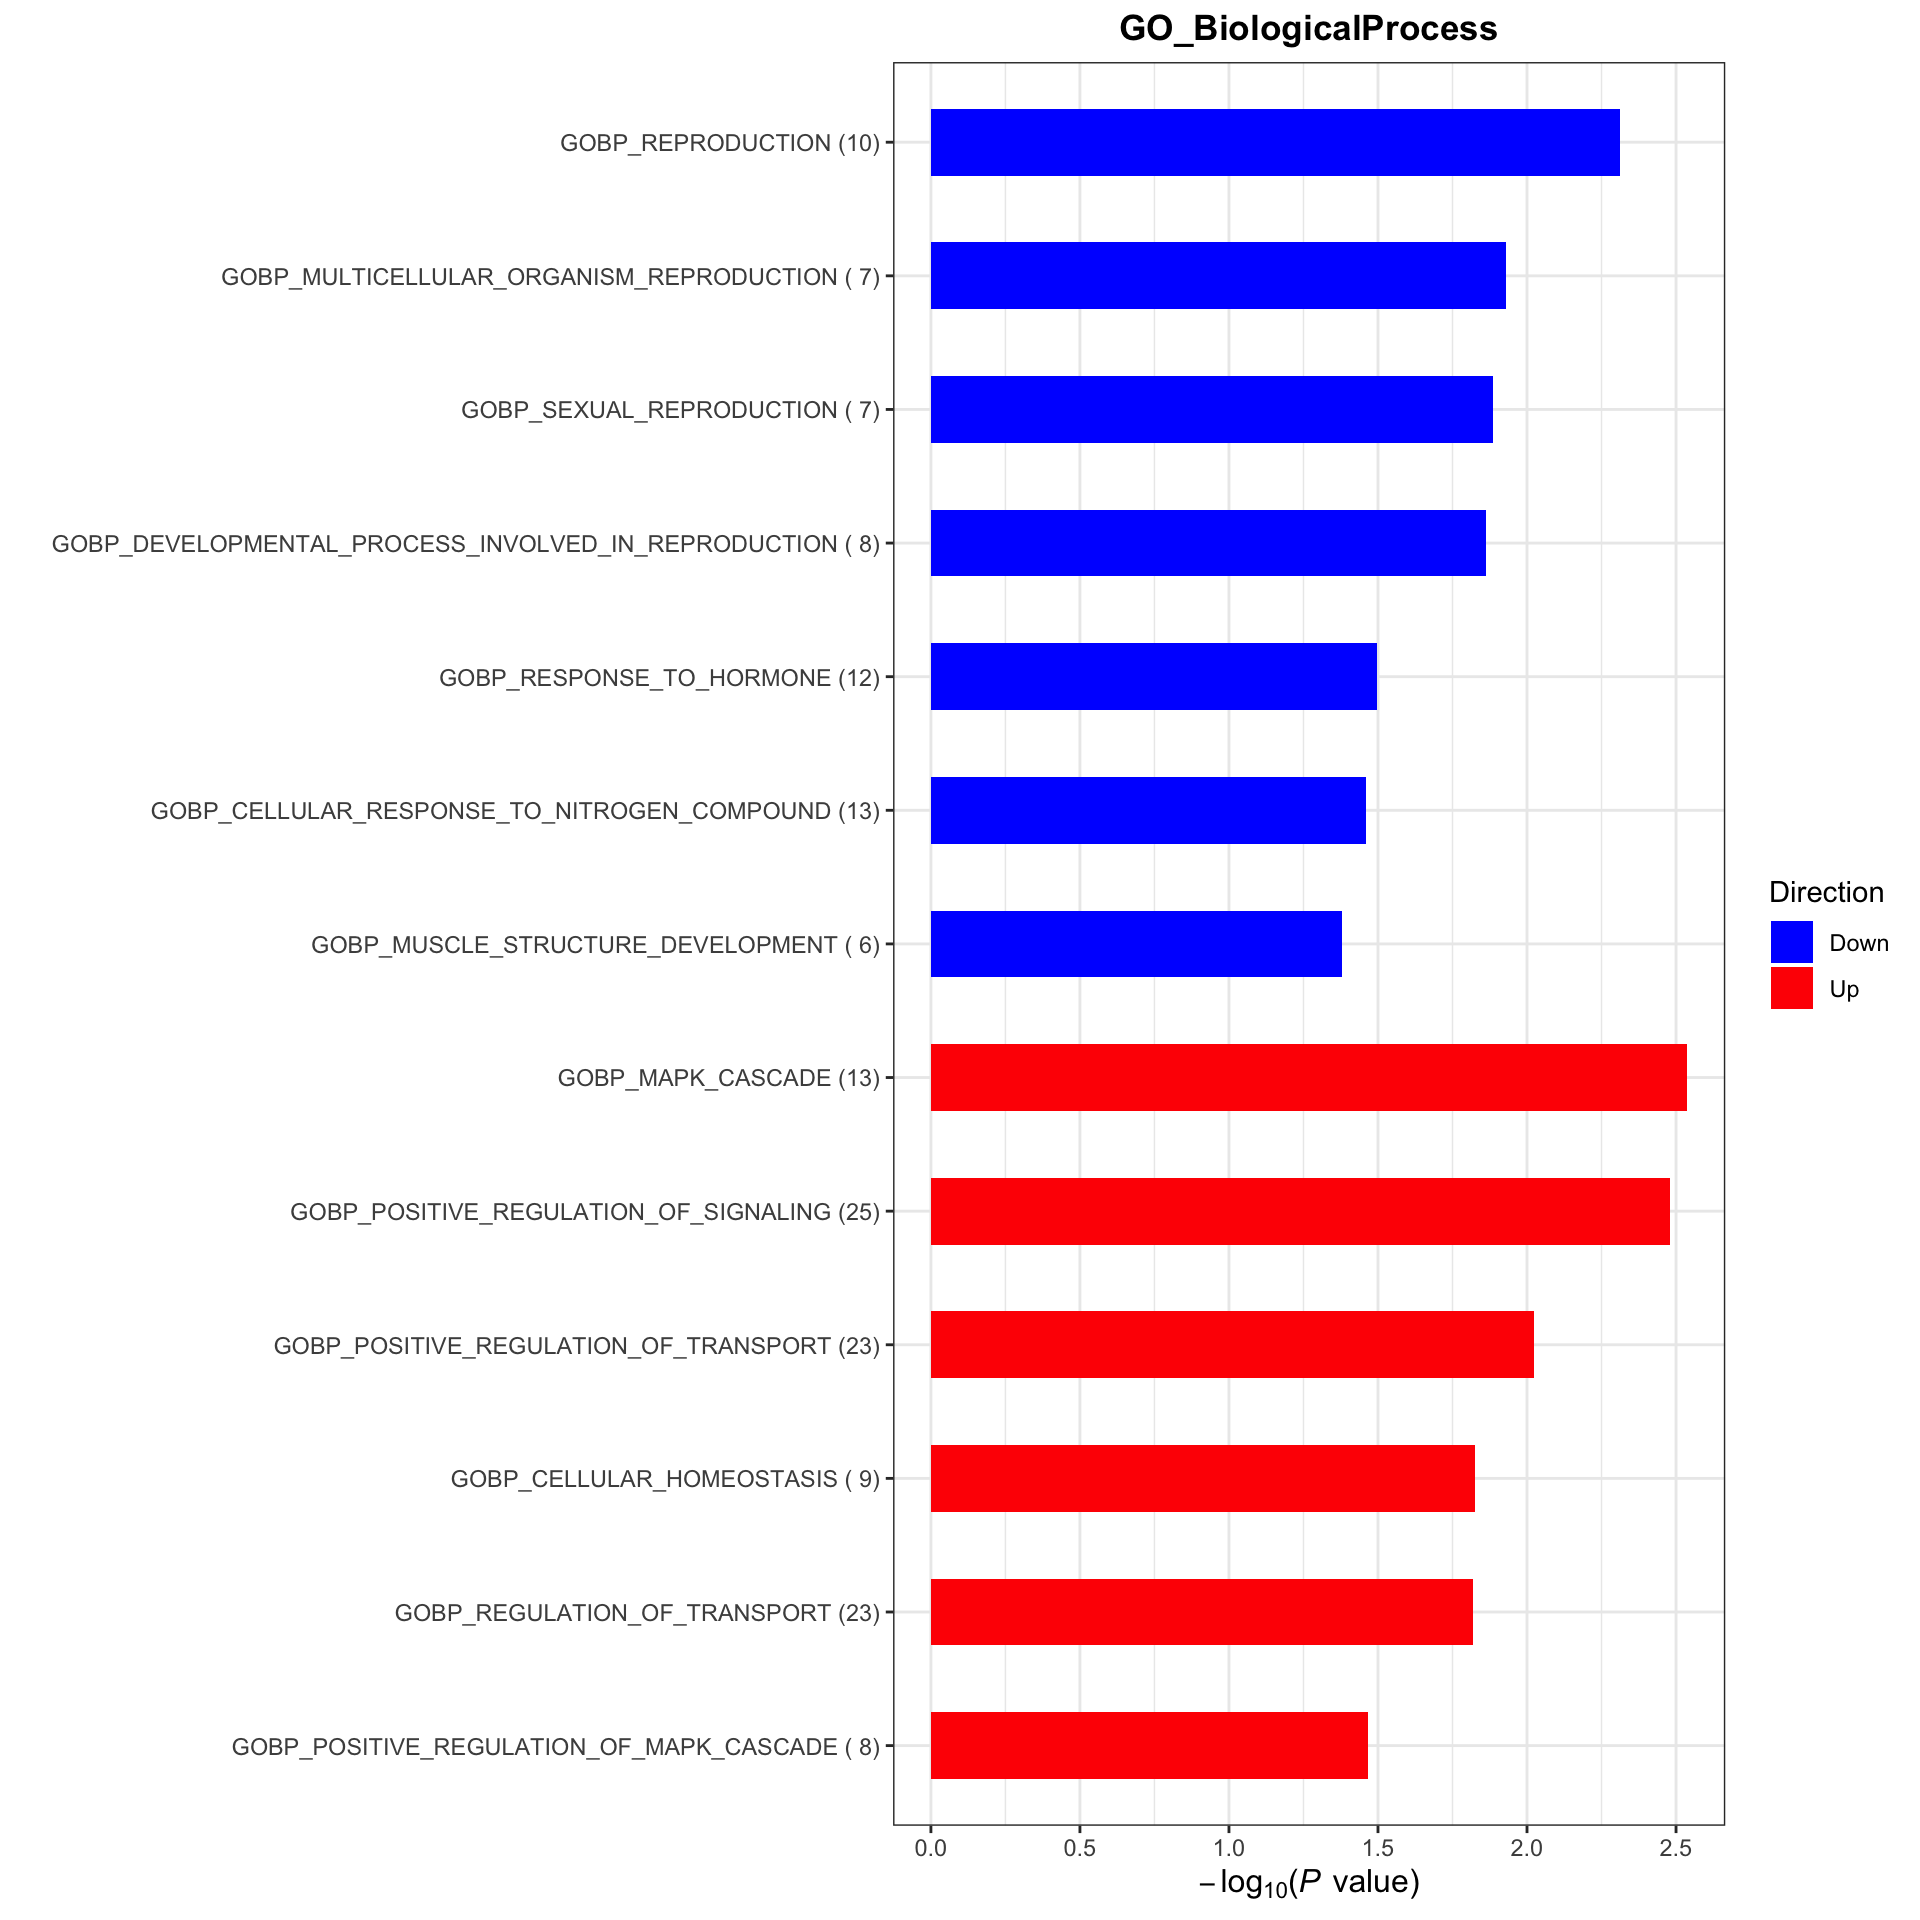
After treatment (visit 8)
Subsetting
#subset for patients in the placebo group
protSub <- prepareProt(seProt_corr, filterCondi = list(Treatment ="1", Visit = "8"), perNA = 0.5)
[1] "Number of proteins: 377, number of samples: 66"#protSub <- seProt_corr[,seProt_corr$Treatment %in% 1 & seProt_corr$Visit %in% 3 & !is.na(seProt_corr$delta_UEMS)]
print("How many proteins and samples")[1] "How many proteins and samples"dim(protSub)[1] 377 66Differential expression
design <- model.matrix(~ delta_UEMS, colData(protSub))

resTab <- testDiff(protSub, design, coef = "delta_UEMS", assayName = "imputed")

allResList[["corrOutcome_visit8_treated"]] <- resTab
hist(resTab$pval)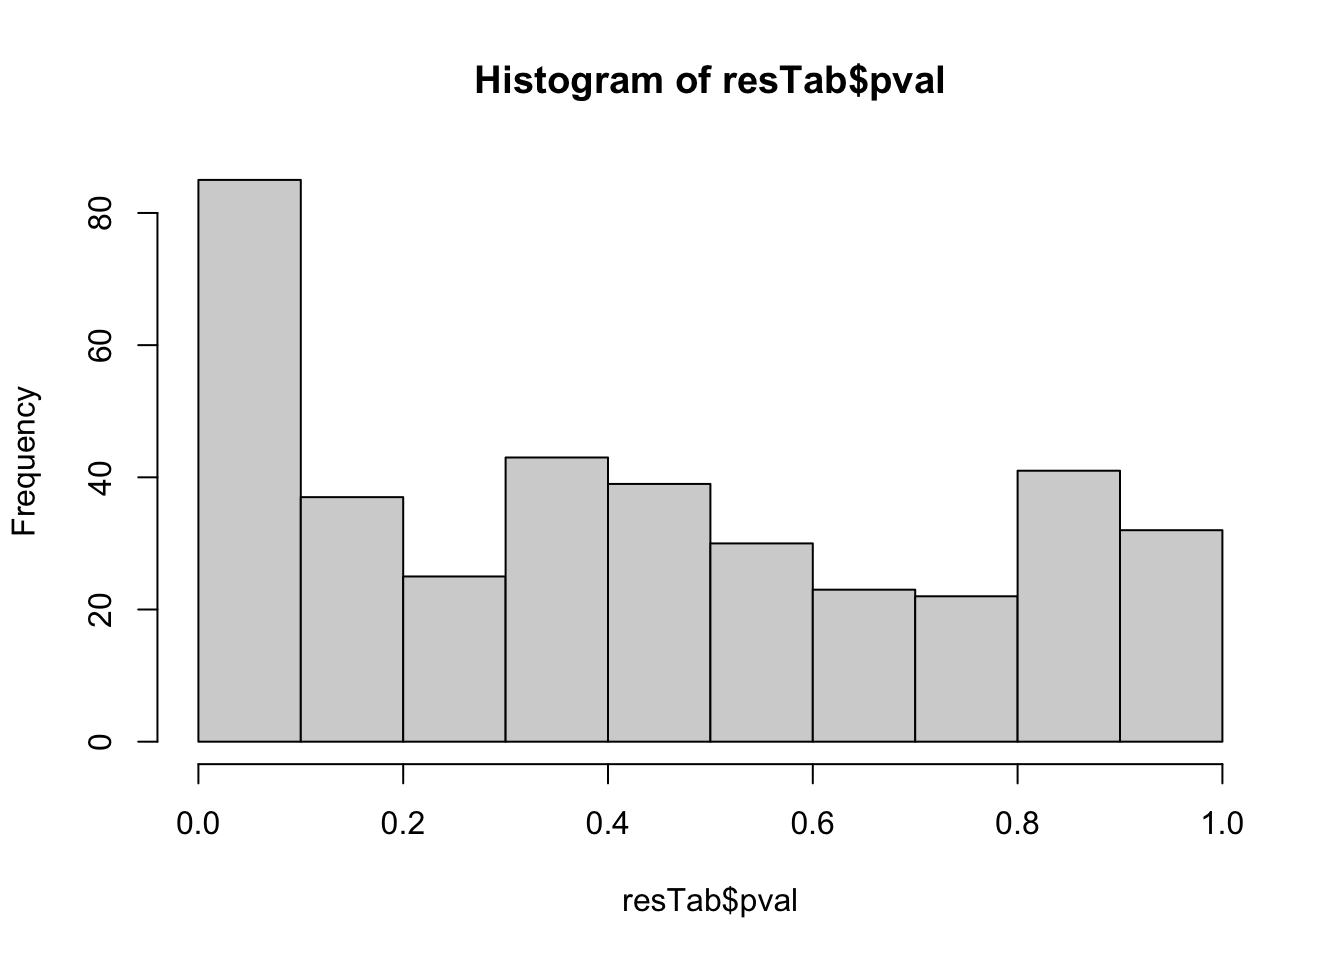
Table of proteins passed raw P-value < 0.05
filter(resTab, pval <= 0.05) %>% mutate(across(where(is.numeric), formatC, digits=2)) %>%
  select(name, symbol, pval, adj_pval, diff, n_obs) %>%
  DT::datatable()
Correlation plot
exprMat <- assay(protSub)
pList <- lapply(seq(20), function(i) {
    rec <- resTab[i,]
    plotTab <- tibble(expr = exprMat[rec$name,],
                      nodeGroup = protSub$nodeGroup,
                      delta_UEMS = protSub$delta_UEMS)
    ggplot(plotTab, aes(x=delta_UEMS, y=expr)) +
        geom_point(aes(col = nodeGroup)) +
        ggtitle(sprintf("%s (P=%s)",rec$symbol,formatC(rec$pval, digits = 2))) +
        #scale_color_gradient(low="green",high="red") +
        geom_smooth(method = "lm") +
        theme_bw() +
        theme(plot.title = element_text(hjust = 0.5, face = "bold"))
})

cowplot::plot_grid(plotlist = pList, ncol=4)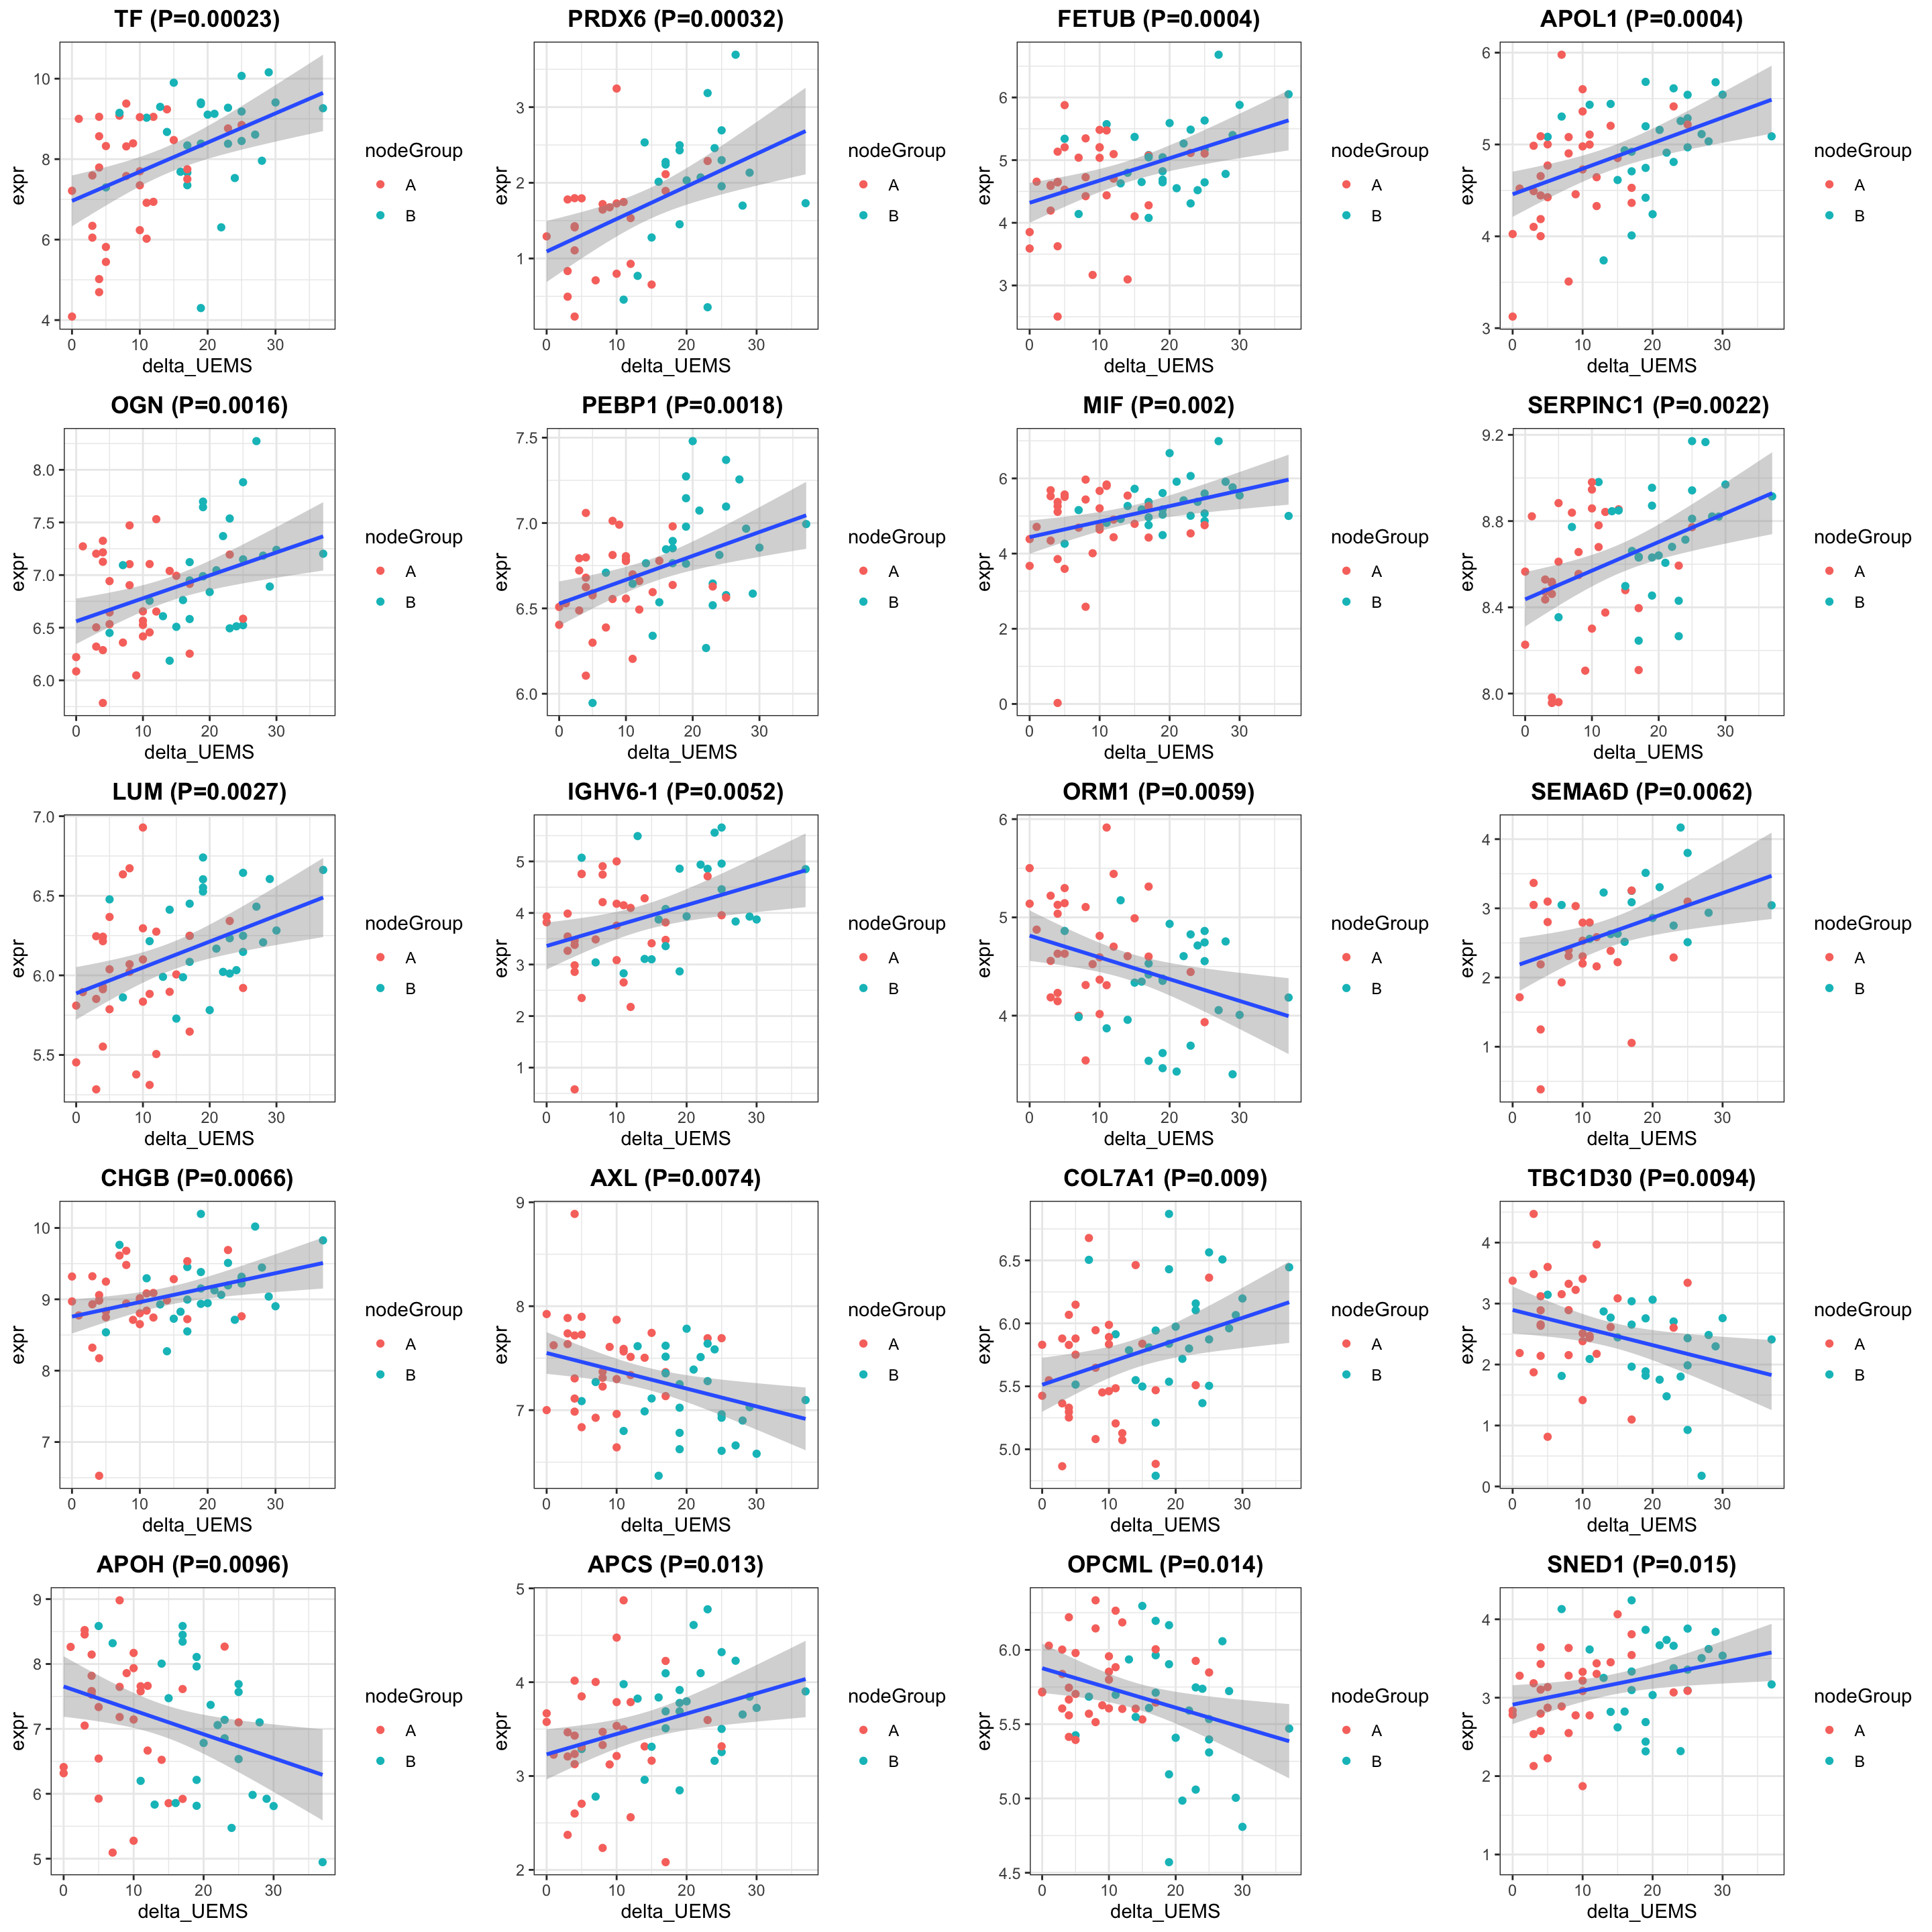
Enrichment analysis
gmts = list(GO_BiologicalProcess = "../data/gmts/c5.go.bp.v2023.2.Hs.symbols.gmt",
            GO_MolecularFunction = "../data/gmts/c5.go.mf.v2023.2.Hs.symbols.gmt")
plotList <- runGeneSetEnrichment(resTab, gmts, genePCut  = 1, pCutSet = 0.05, setFdr = FALSE, method = "gsea")
plotList$plot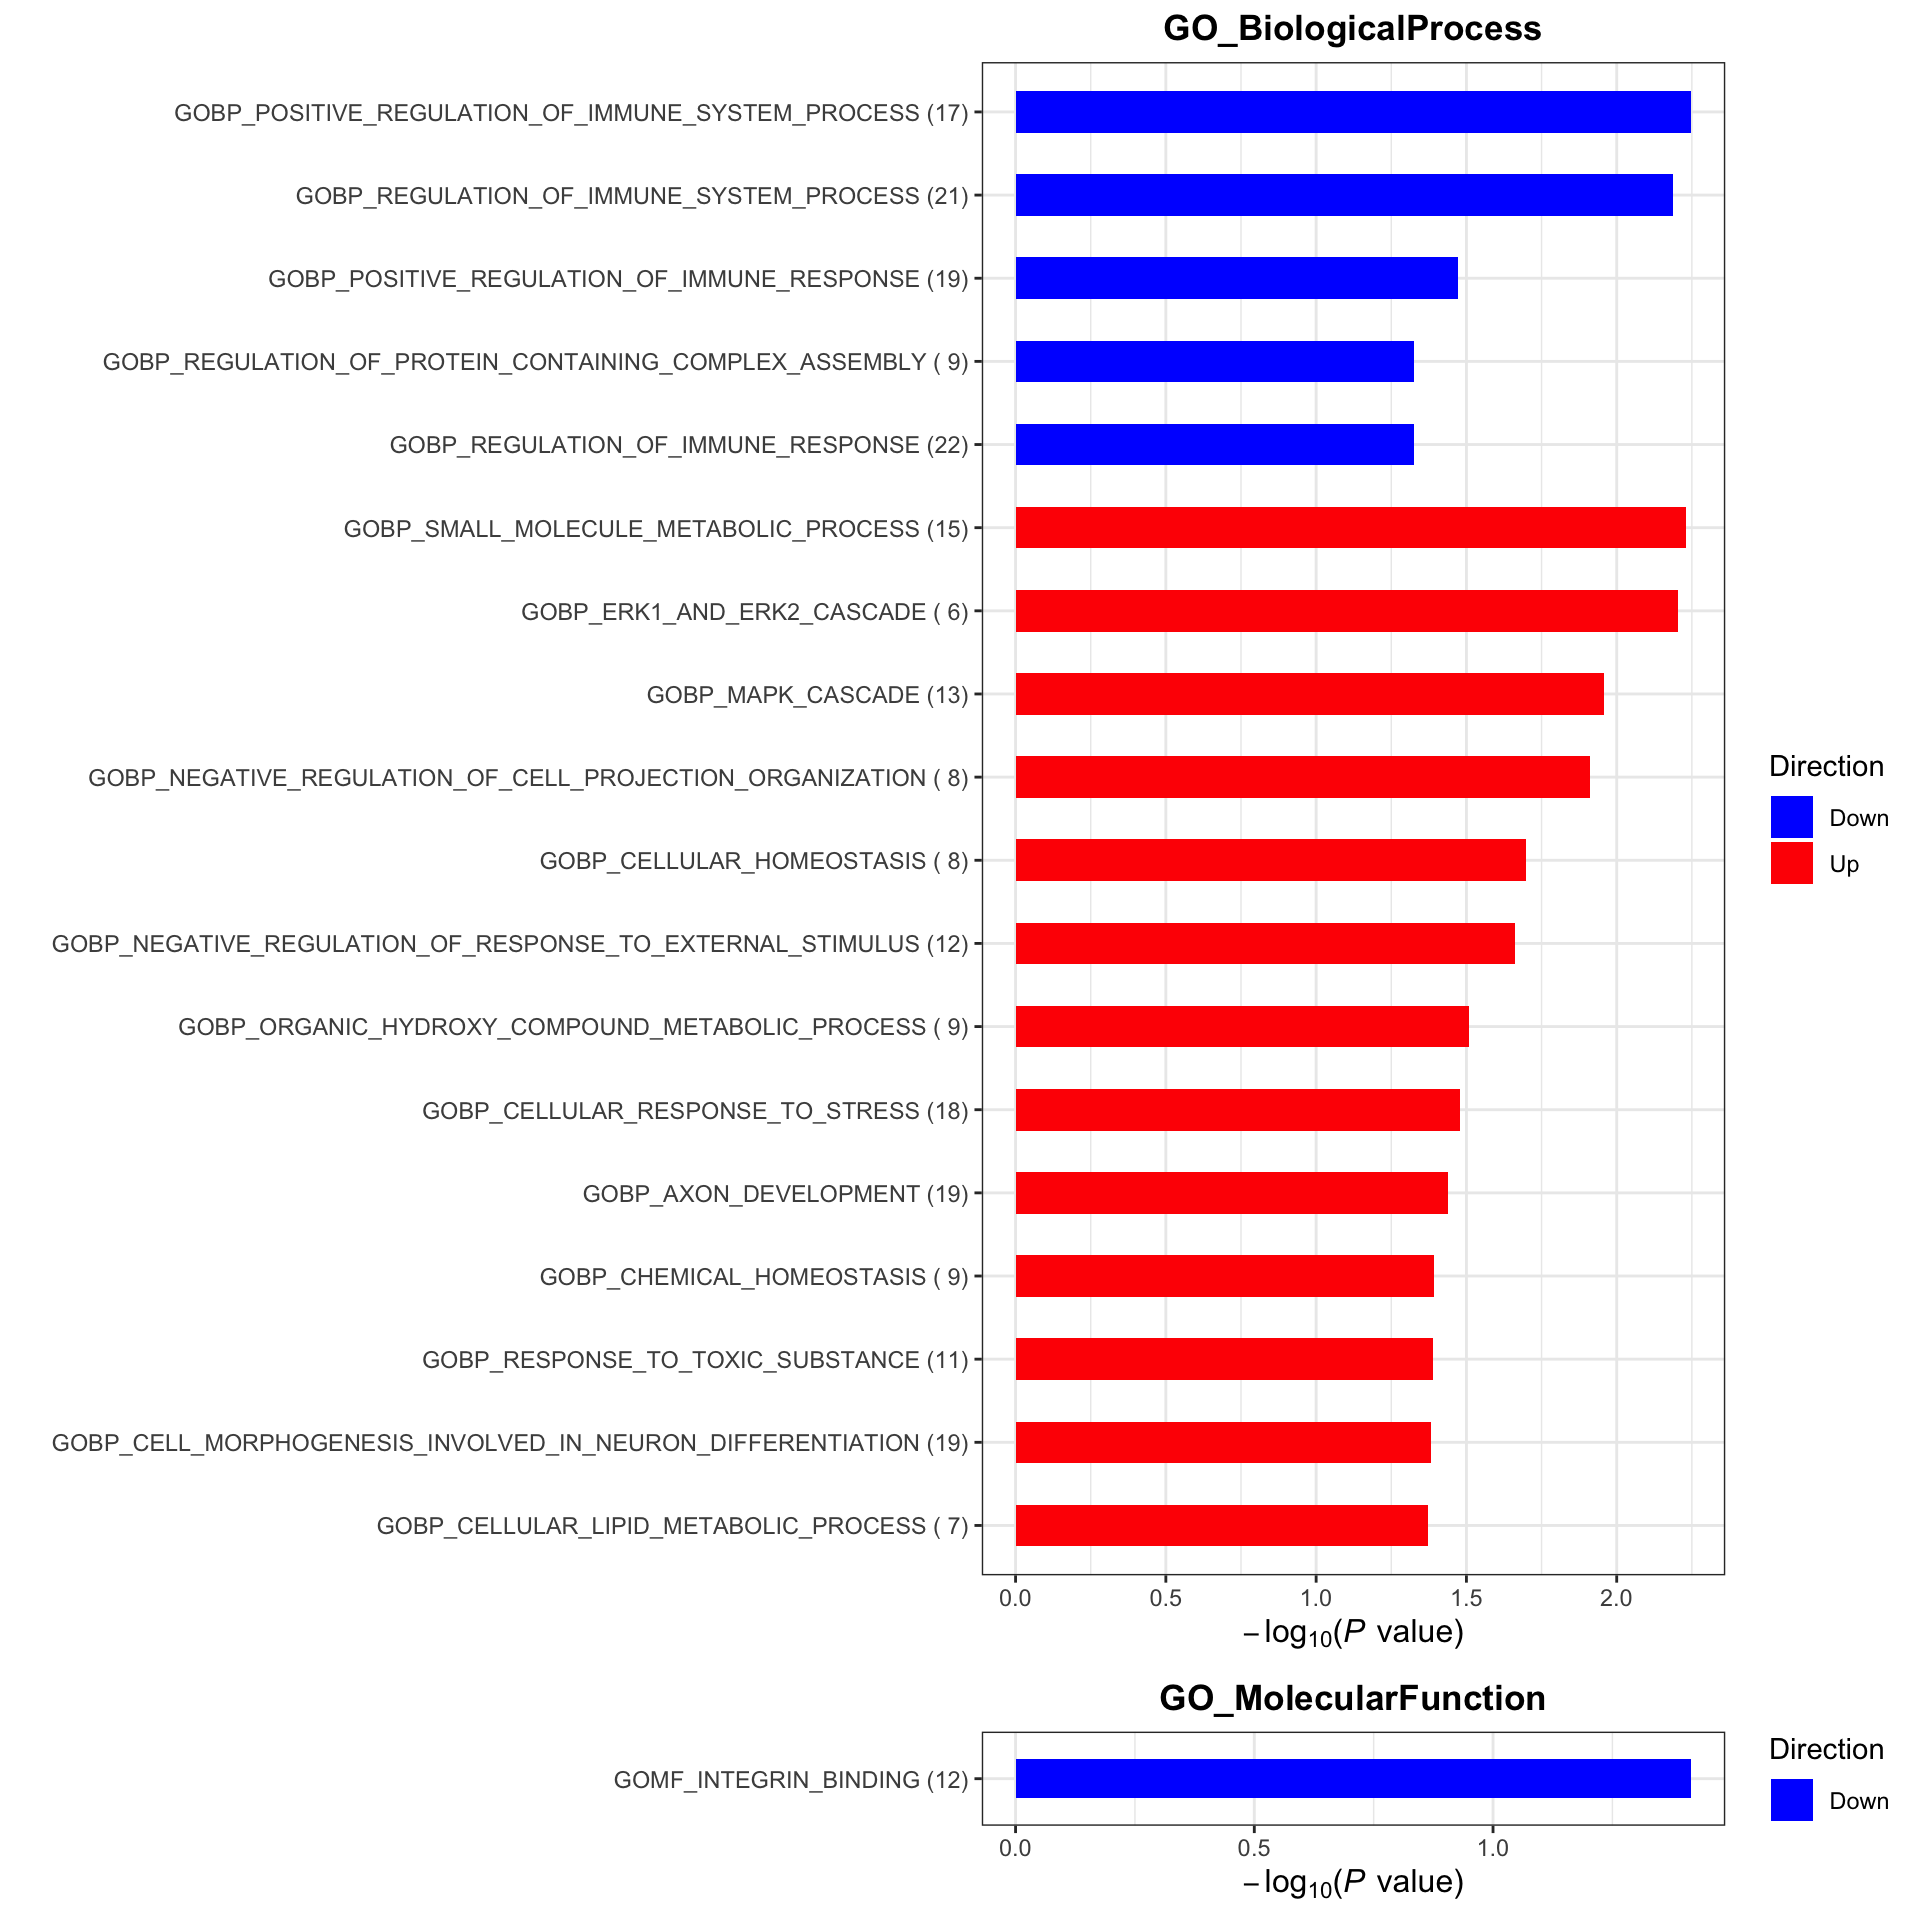
At endpoint (visit 10)
Subsetting
#subset for patients in the placebo group
protSub <- prepareProt(seProt_corr, filterCondi = list(Treatment ="1", Visit = "10"), perNA = 0.5)
[1] "Number of proteins: 375, number of samples: 62"#protSub <- seProt_corr[,seProt_corr$Treatment %in% 1 & seProt_corr$Visit %in% 3 & !is.na(seProt_corr$delta_UEMS)]
print("How many proteins and samples")[1] "How many proteins and samples"dim(protSub)[1] 375 62Differential expression
design <- model.matrix(~ delta_UEMS, colData(protSub))

resTab <- testDiff(protSub, design, coef = "delta_UEMS", assayName = "imputed")

allResList[["corrOutcome_visit10_treated"]] <- resTab
hist(resTab$pval)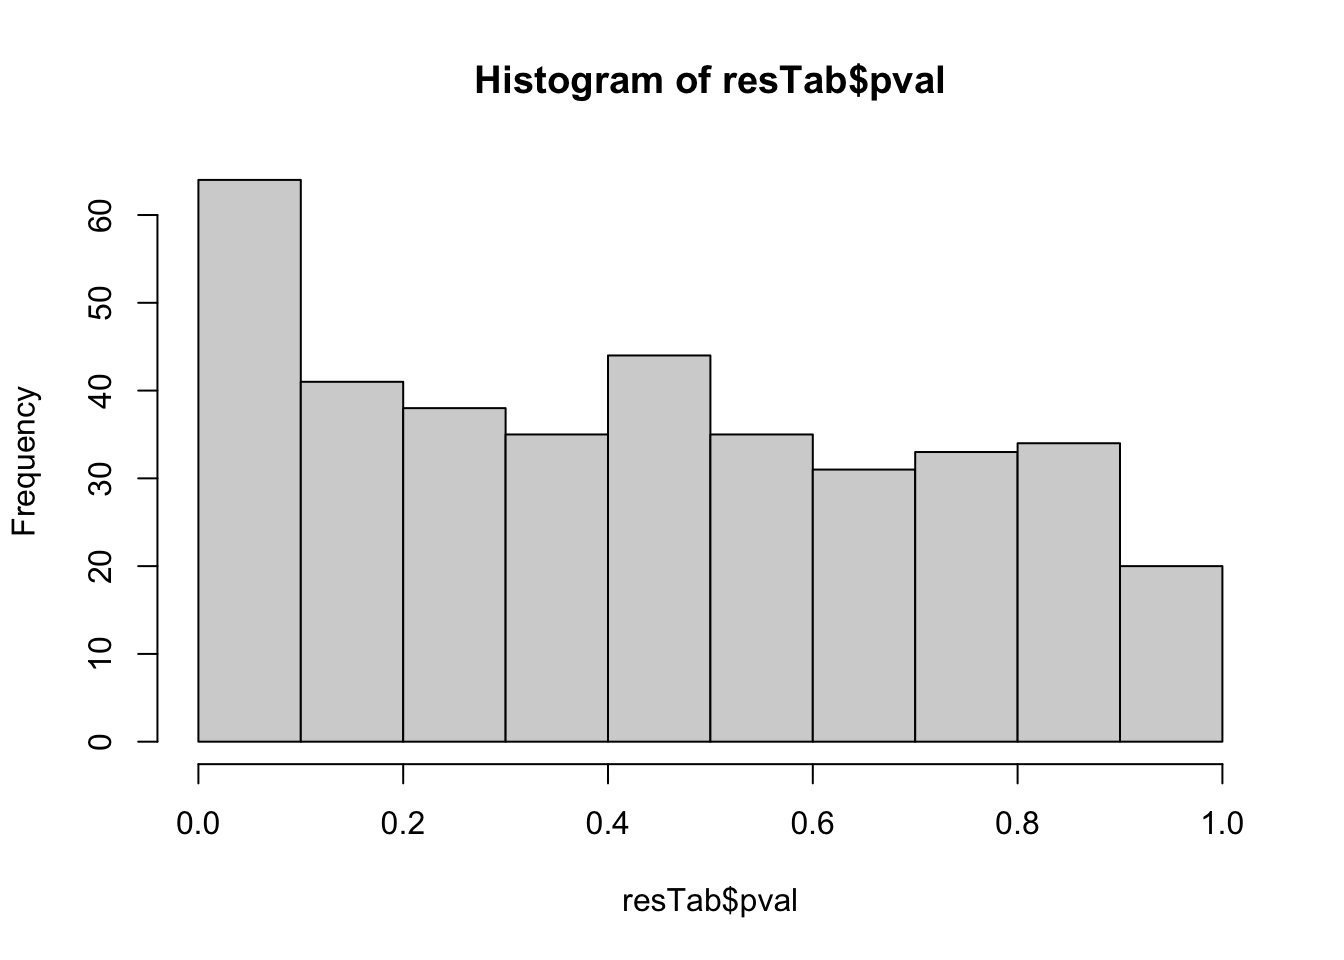
Table of proteins passed raw P-value < 0.05
filter(resTab, pval <= 0.05) %>% mutate(across(where(is.numeric), formatC, digits=2)) %>%
  select(name, symbol, pval, adj_pval, diff, n_obs) %>%
  DT::datatable()
Correlation plot
exprMat <- assays(protSub)[[2]]
pList <- lapply(seq(20), function(i) {
    rec <- resTab[i,]
    plotTab <- tibble(expr = exprMat[rec$name,],
                      nodeGroup = protSub$nodeGroup,
                      delta_UEMS = protSub$delta_UEMS)
    ggplot(plotTab, aes(x=delta_UEMS, y=expr)) +
        geom_point(aes(col = nodeGroup)) +
        ggtitle(sprintf("%s (P=%s)",rec$symbol,formatC(rec$pval, digits = 2))) +
        #scale_color_gradient(low="green",high="red") +
        geom_smooth(method = "lm") +
        theme_bw() +
        theme(plot.title = element_text(hjust = 0.5, face = "bold"))
})

cowplot::plot_grid(plotlist = pList, ncol=4)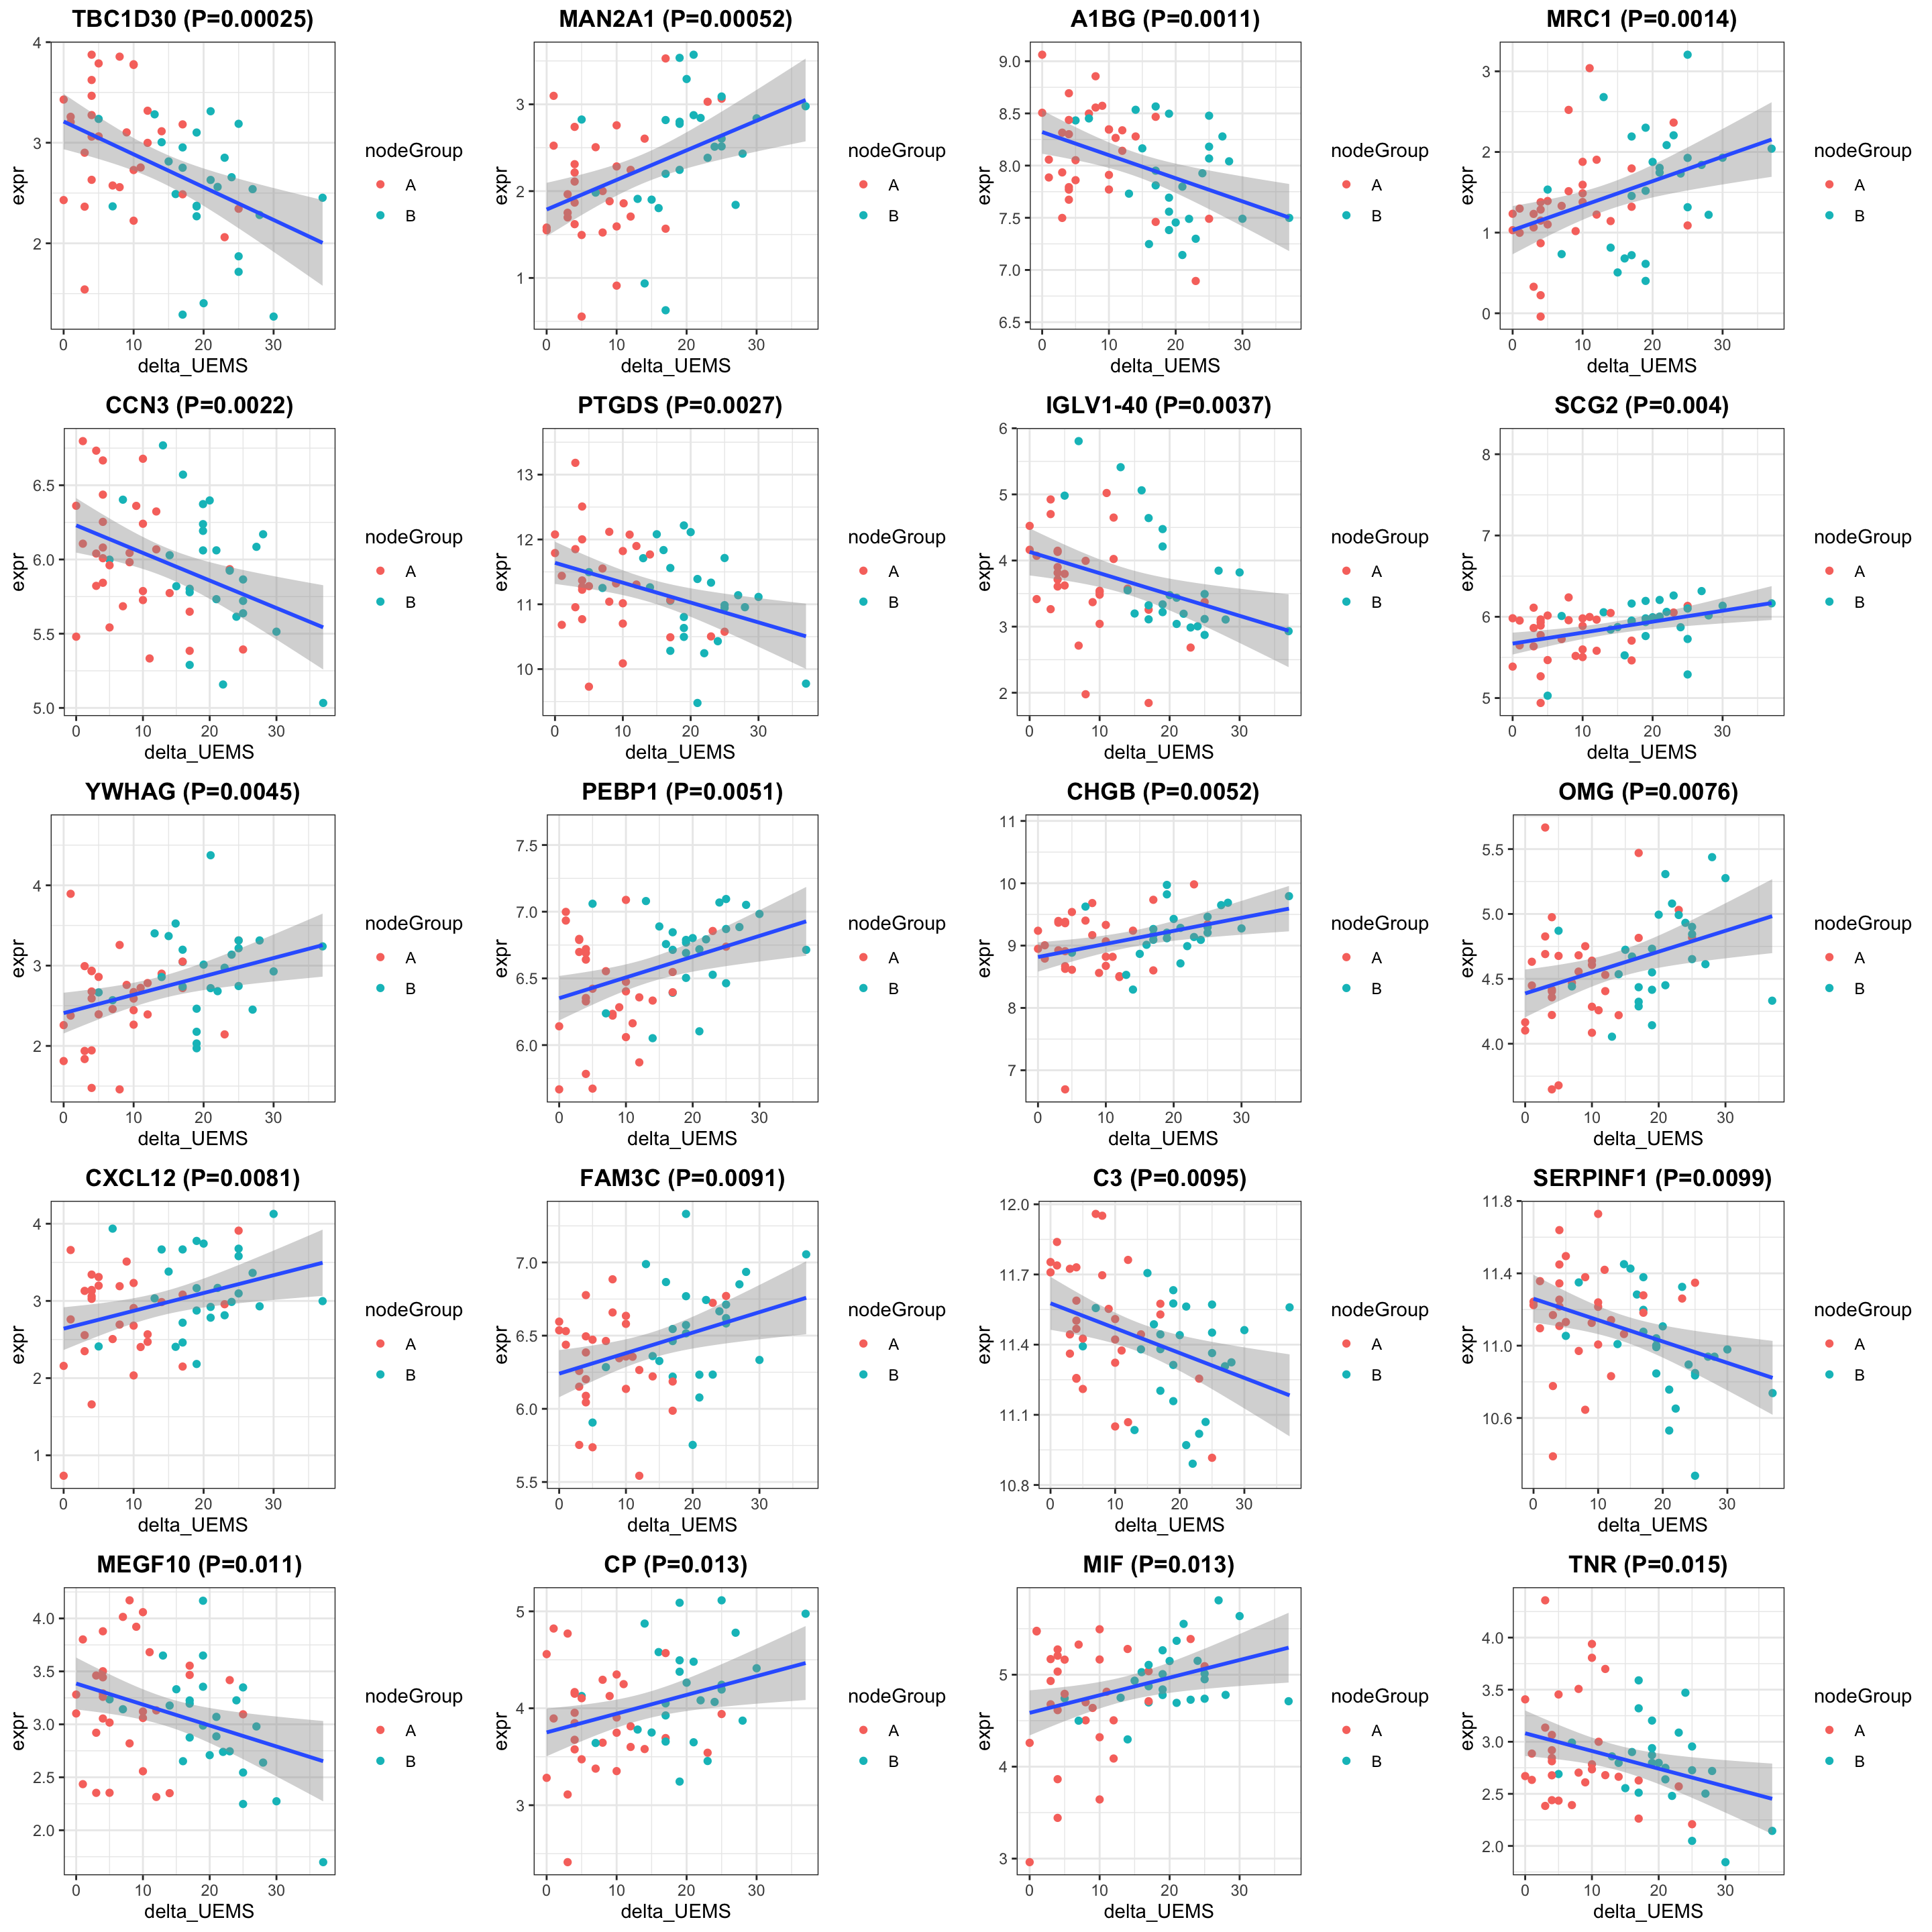
Enrichment analysis
gmts = list(GO_BiologicalProcess = "../data/gmts/c5.go.bp.v2023.2.Hs.symbols.gmt",
            GO_MolecularFunction = "../data/gmts/c5.go.mf.v2023.2.Hs.symbols.gmt")
plotList <- runGeneSetEnrichment(resTab, gmts, genePCut  = 1, pCutSet = 0.05, setFdr = FALSE, method = "gsea")
plotList$plot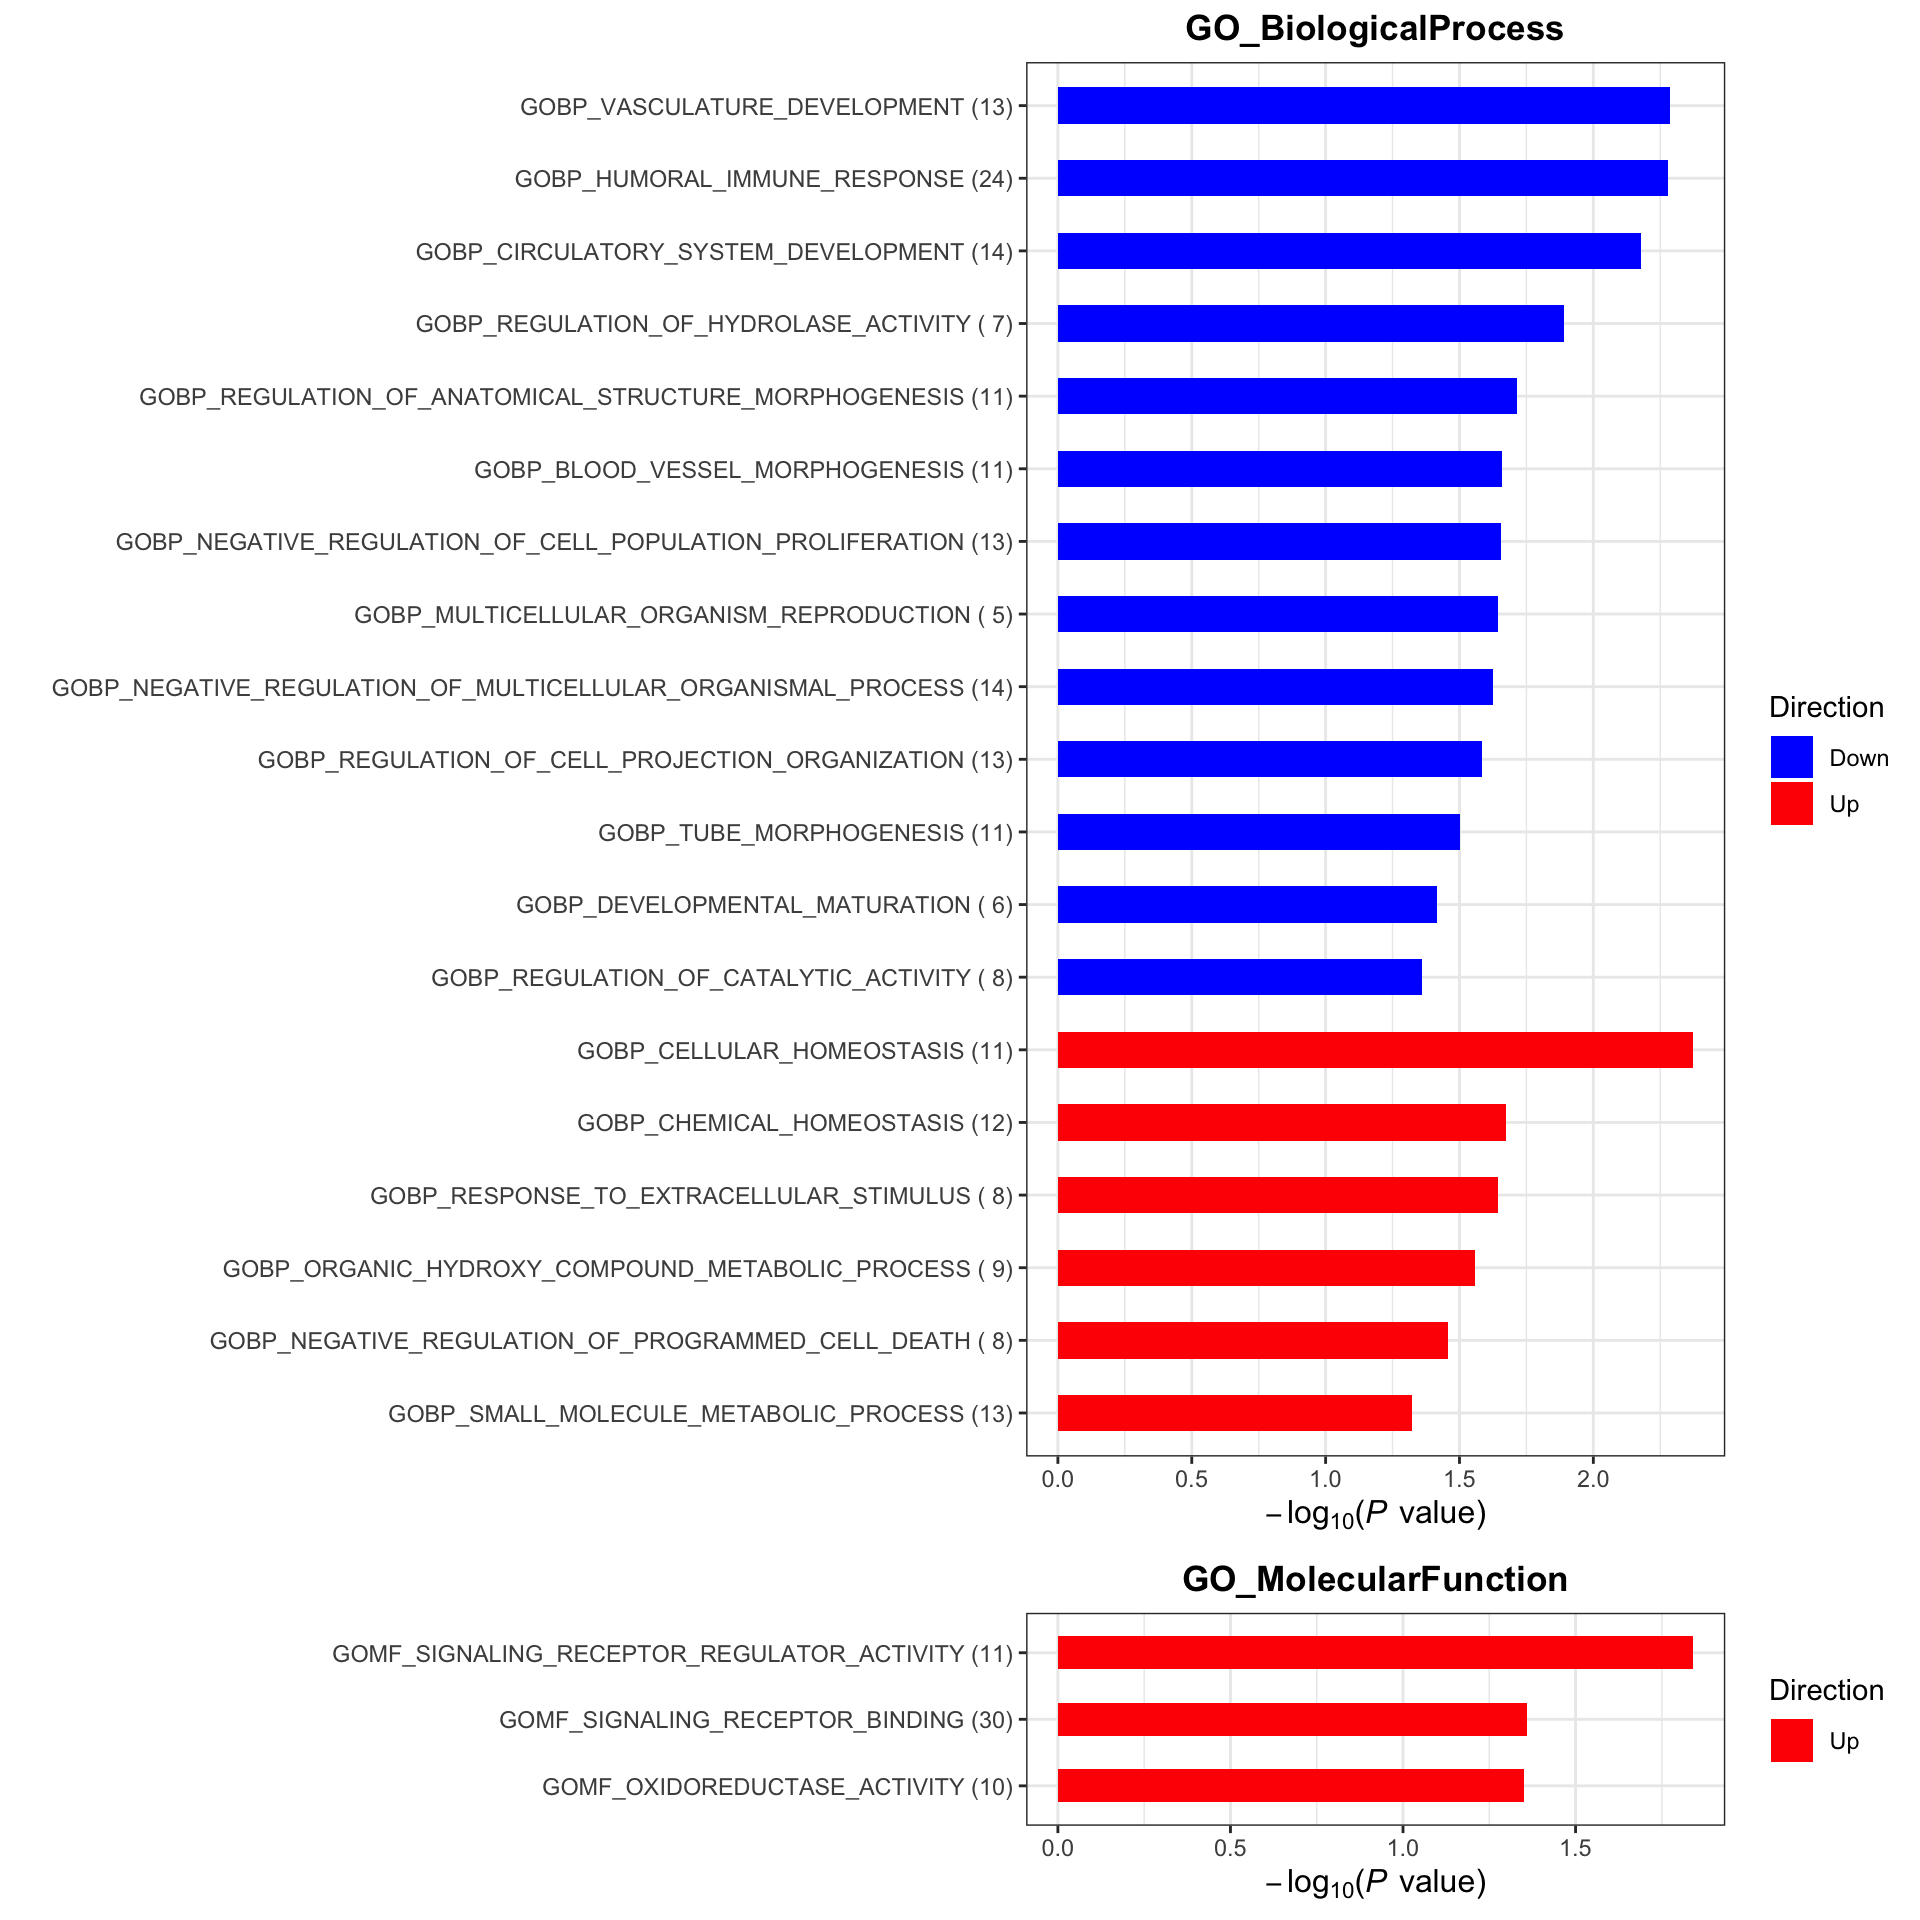
Change between baseline and after treatment (visit 8 - visit3)
Subsetting
#subset for patients in the placebo group
protSub <- prepareProt(seProt_corr, filterCondi = list(Treatment = "1", Visit = c(3,8)), perNA = 0.5)
[1] "Number of proteins: 378, number of samples: 140"protSub.before <- protSub[, protSub$Visit %in% 3 & !is.na(protSub$delta_UEMS)]
protSub.after <- protSub[,protSub$Visit %in% 8 & !is.na(protSub$delta_UEMS)]
overPat <- intersect(protSub.after$PSN, protSub.before$PSN)
protSub.before <- protSub.before[,match(overPat, protSub.before$PSN)]
protSub.after <- protSub.after[,match(overPat, protSub.after$PSN)]
colnames(protSub.after) <- overPat
colnames(protSub.before) <- overPat
protSub <- protSub.before
assays(protSub)[[1]] <- assays(protSub.after)[[1]] - assays(protSub.before)[[1]]
assays(protSub)[[2]] <- assays(protSub.after)[[2]] - assays(protSub.before)[[2]]
#remove feature with too many missings
#protSub <- protSub[rowSums(is.na(assay(protSub)))/ncol(protSub) < 0.5,]
print("How many proteins and samples")[1] "How many proteins and samples"dim(protSub)[1] 378 61Differential expression
design <- model.matrix(~ delta_UEMS, colData(protSub))

resTab <- testDiff(protSub, design, coef = "delta_UEMS", assayName = "imputed")

allResList[["corrOutcome_diff83_treated"]] <- resTab

hist(resTab$pval)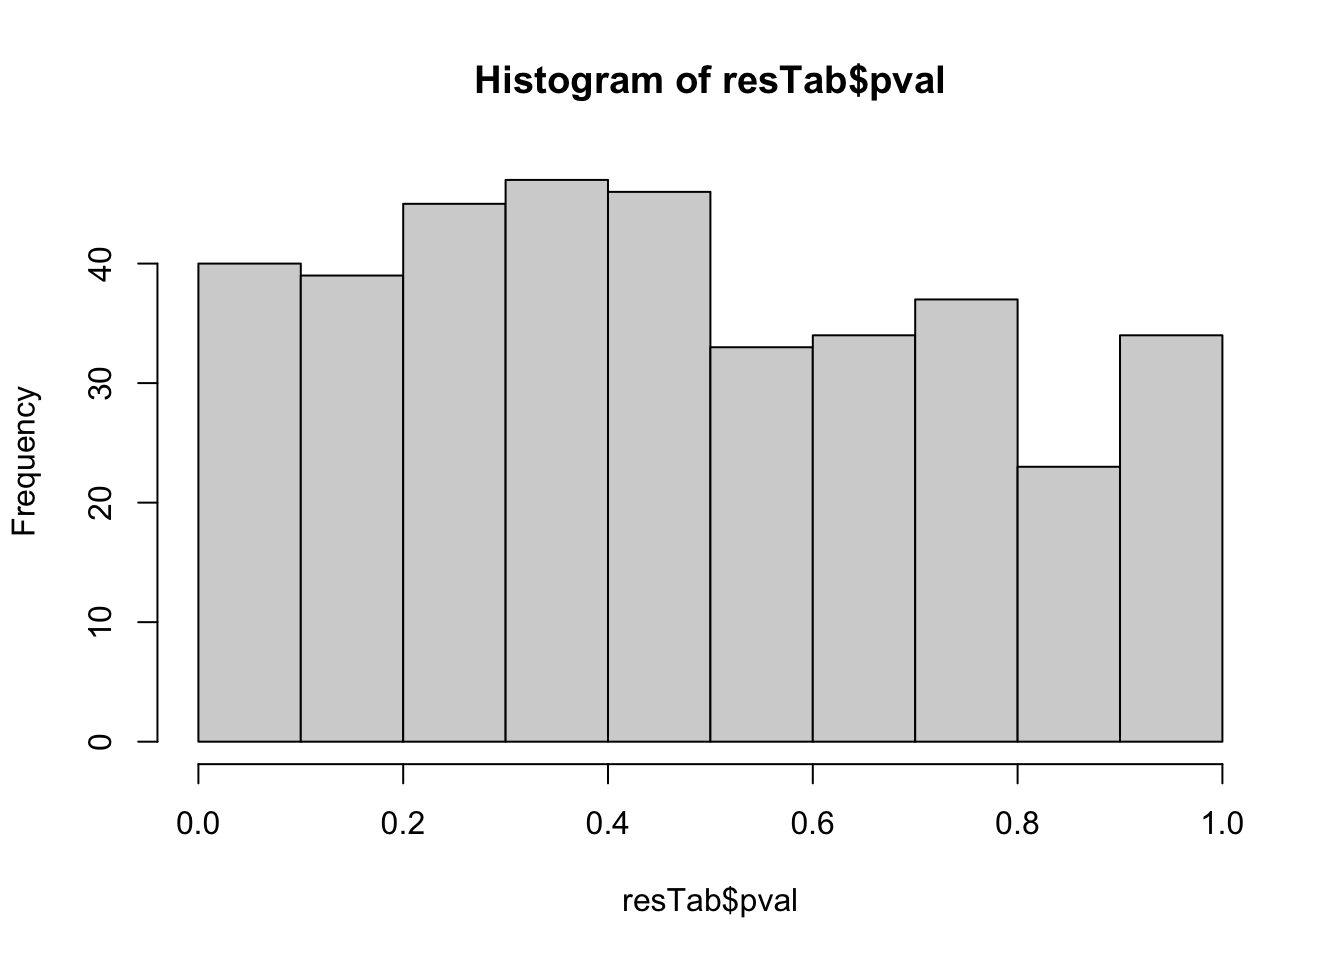
Table of proteins passed raw P-value < 0.05
filter(resTab, pval <= 0.05) %>% mutate(across(where(is.numeric), formatC, digits=2)) %>%
  select(name, symbol, pval, adj_pval, diff) %>%
  DT::datatable()
Correlation plot
exprMat <- assays(protSub)[[2]]
pList <- lapply(seq(20), function(i) {
    rec <- resTab[i,]
    plotTab <- tibble(expr = exprMat[rec$name,],
                      nodeGroup = protSub$nodeGroup,
                      delta_UEMS = protSub$delta_UEMS)
    ggplot(plotTab, aes(x=delta_UEMS, y=expr)) +
        geom_point(aes(col = nodeGroup)) +
        ggtitle(sprintf("%s (P=%s)",rec$symbol,formatC(rec$pval, digits = 2))) +
        #scale_color_gradient(low="green",high="red") +
        geom_smooth(method = "lm") +
        theme_bw() +
        theme(plot.title = element_text(hjust = 0.5, face = "bold"))
})

cowplot::plot_grid(plotlist = pList, ncol=4)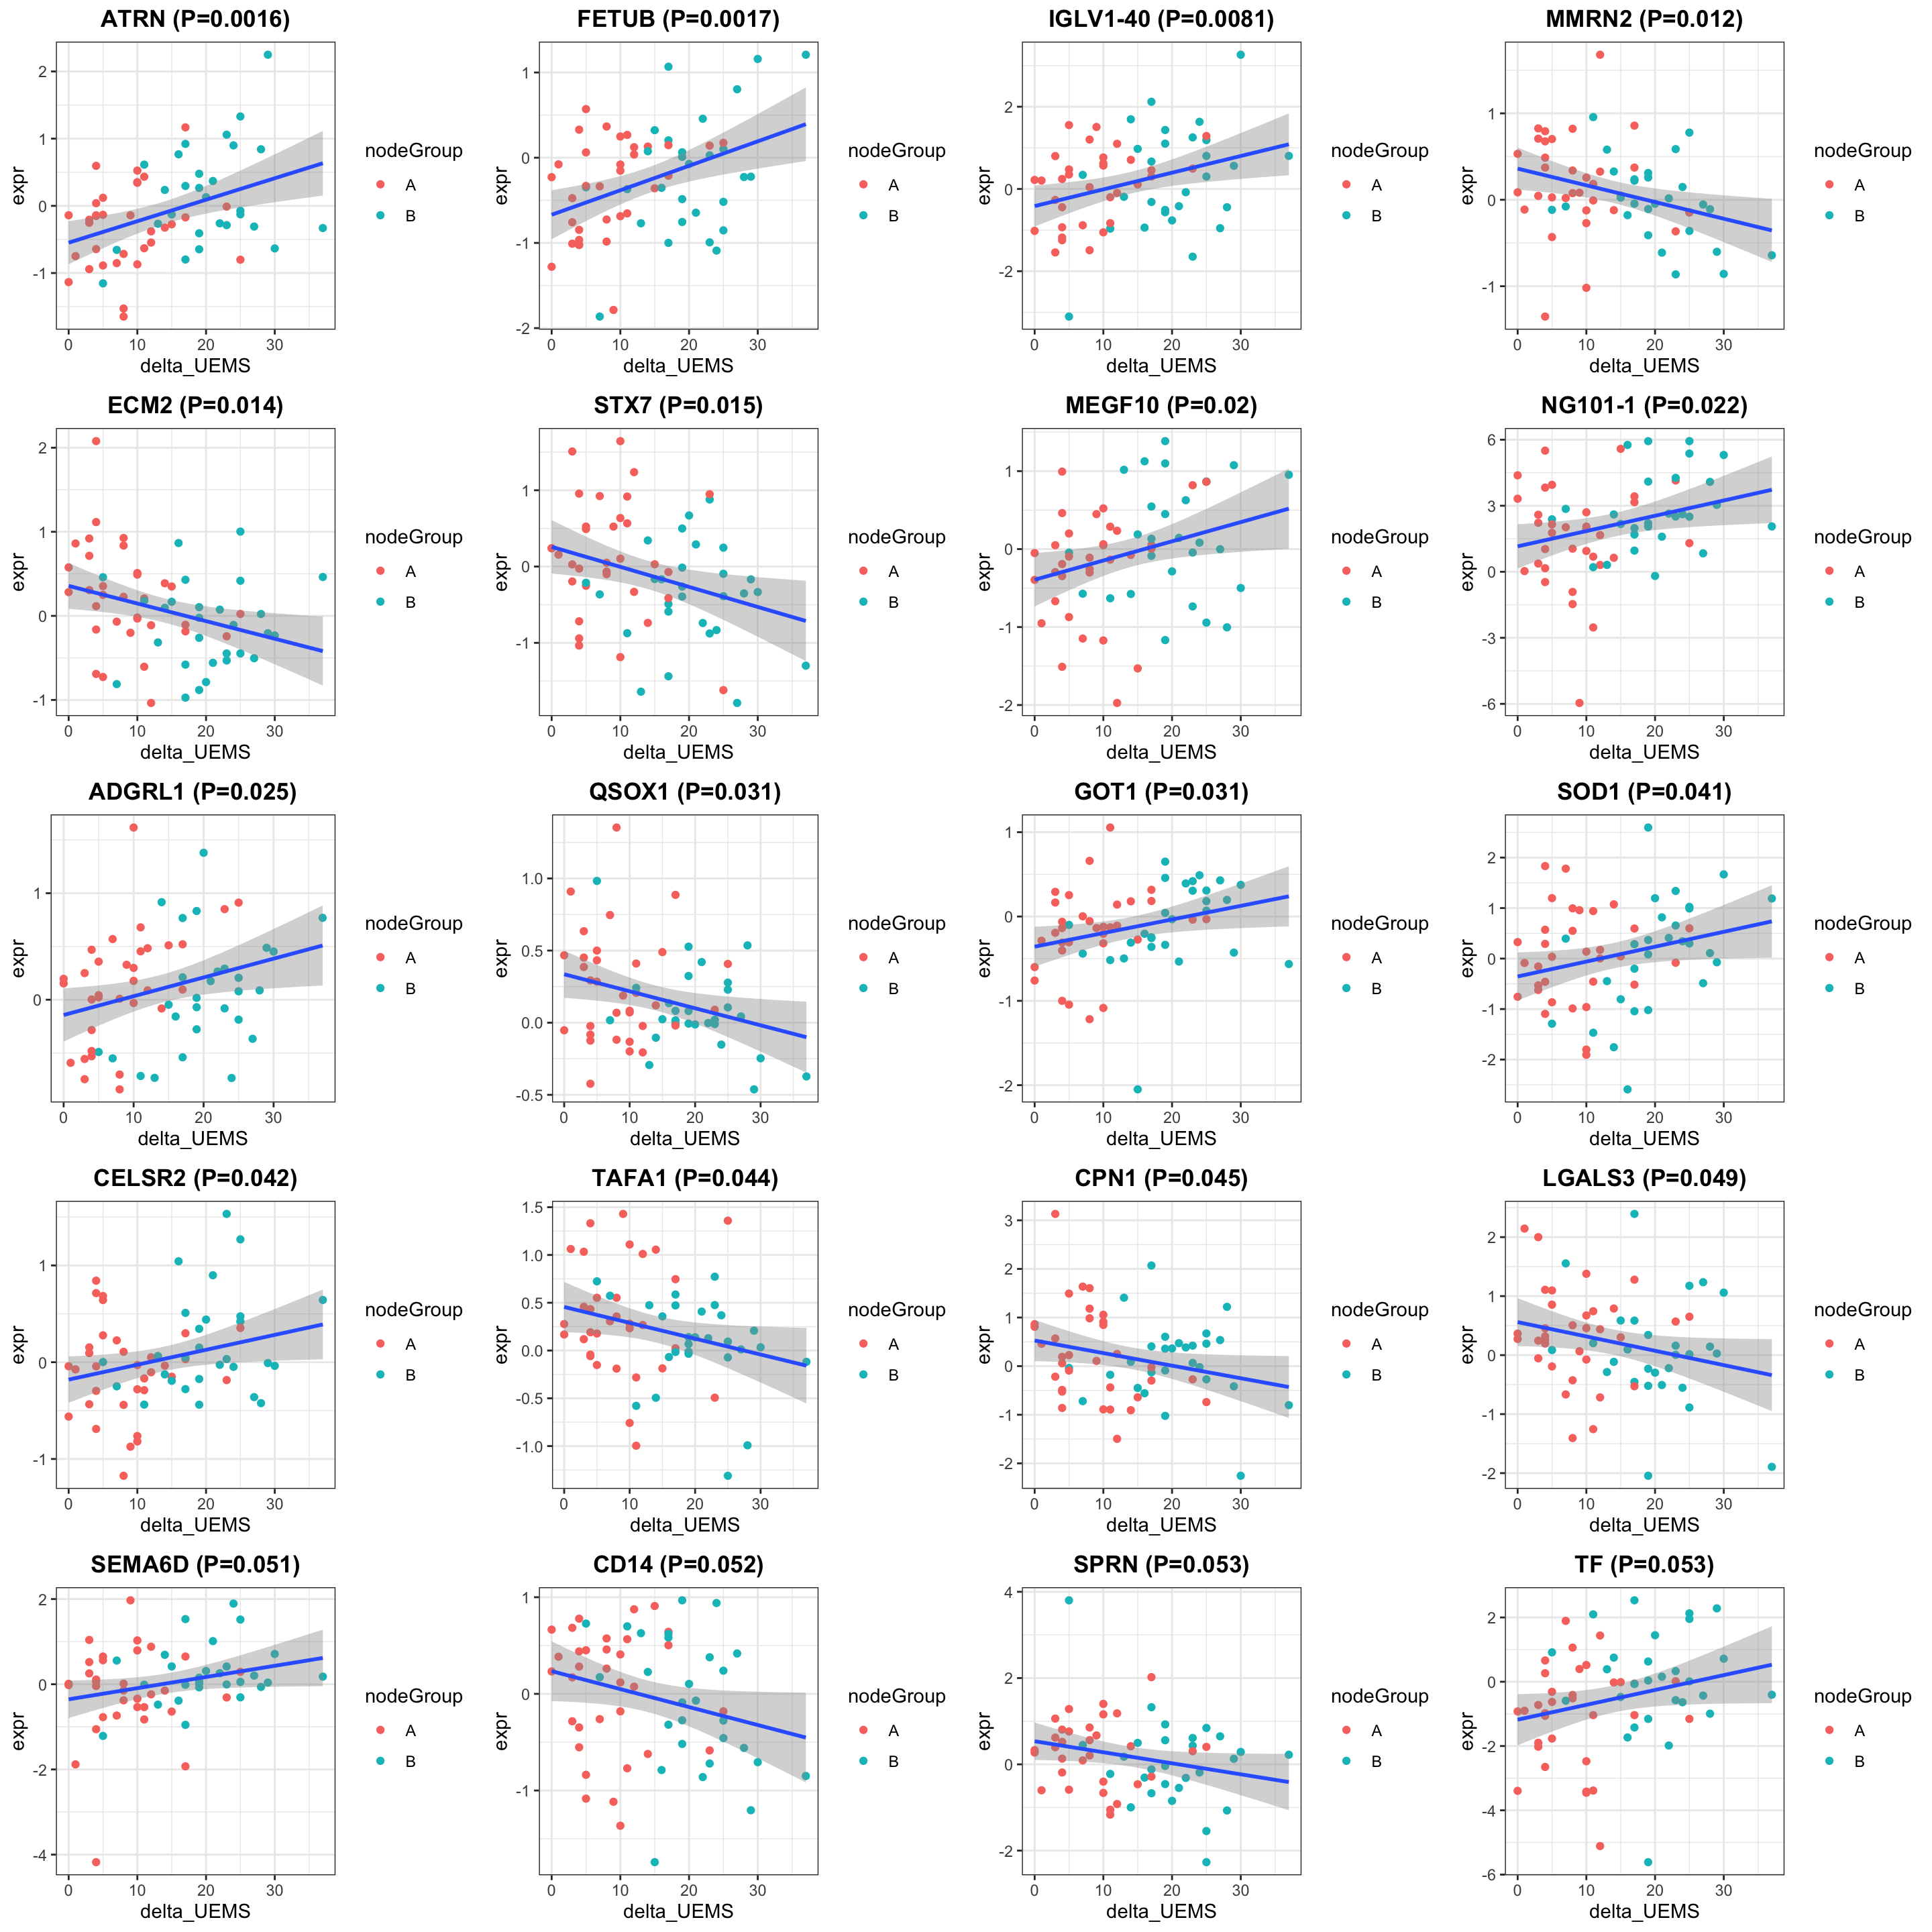
Enrichment analysis
gmts = list(GO_BiologicalProcess = "../data/gmts/c5.go.bp.v2023.2.Hs.symbols.gmt",
            GO_MolecularFunction = "../data/gmts/c5.go.mf.v2023.2.Hs.symbols.gmt")
plotList <- runGeneSetEnrichment(resTab, gmts, genePCut  = 1, pCutSet = 0.05, setFdr = FALSE, method = "gsea")
plotList$plot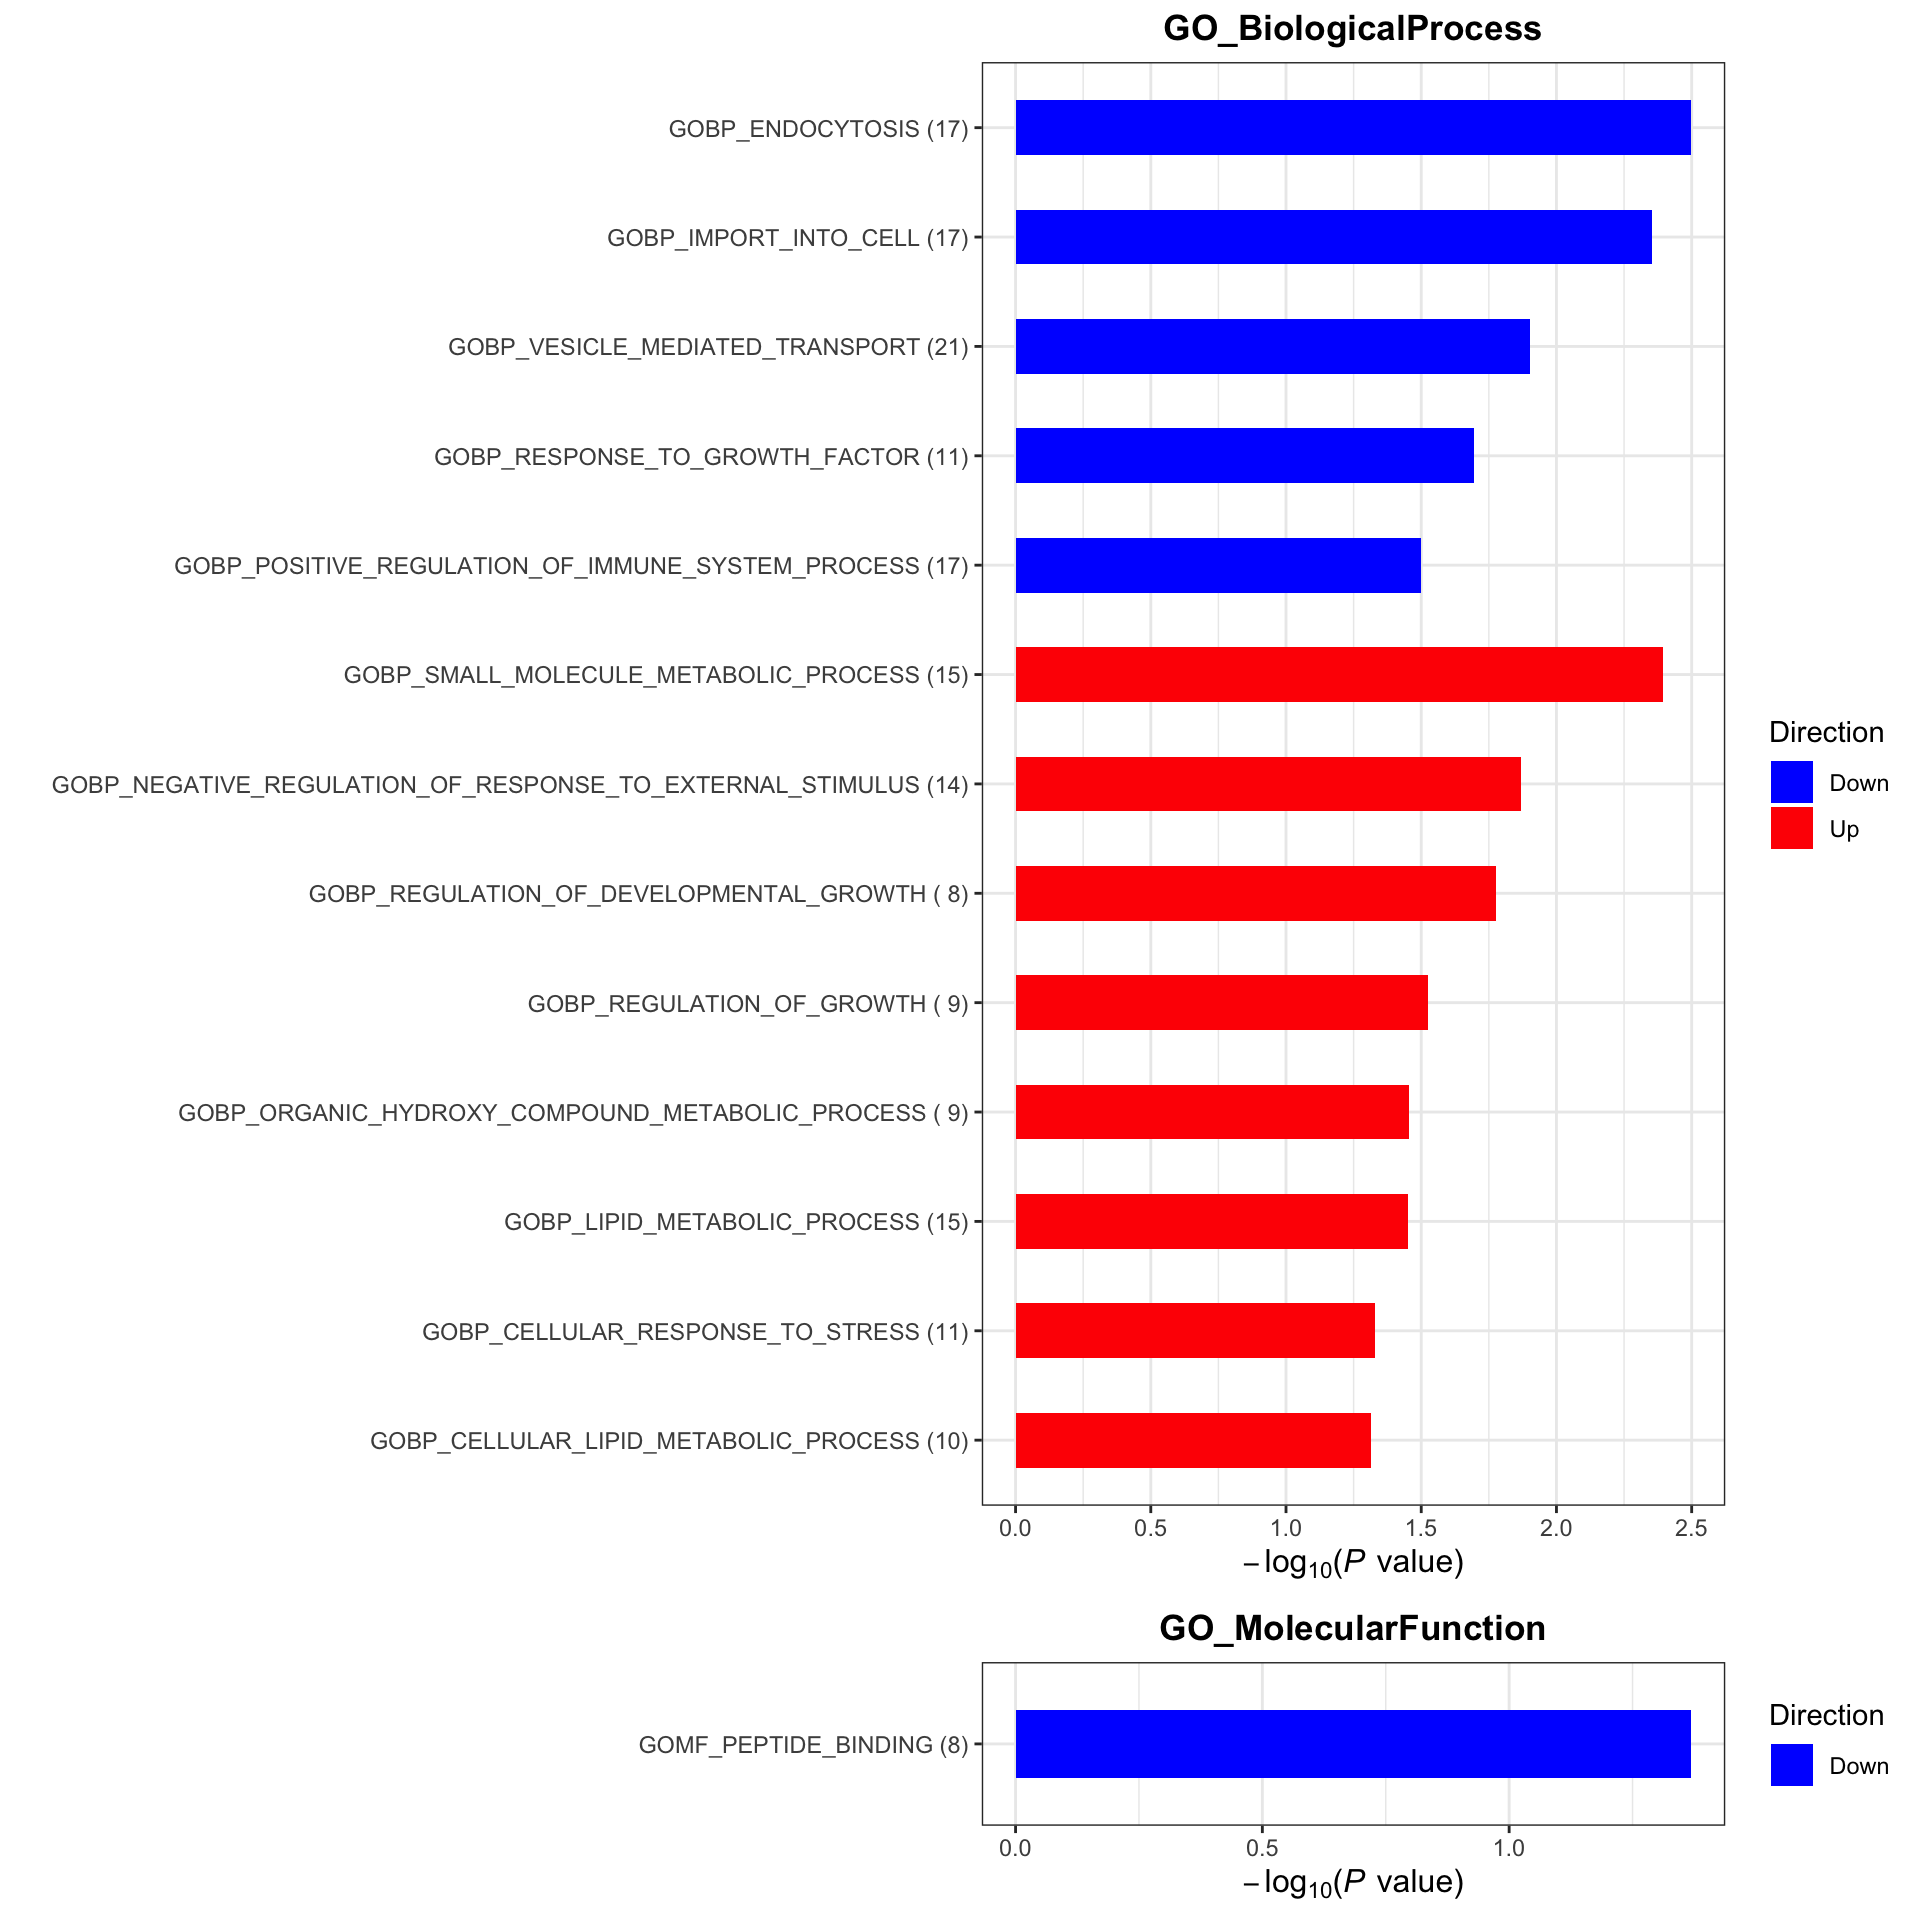
In treated samples from node group B
At baseline
Subsetting
#subset for patients in the placebo group
protSub <- prepareProt(seProt_corr, filterCondi = list(Treatment ="1", Visit = "3", nodeGroup = "B"), perNA = 0.5)
[1] "Number of proteins: 379, number of samples: 36"#protSub <- seProt_corr[,seProt_corr$Treatment %in% 1 & seProt_corr$Visit %in% 3 & !is.na(seProt_corr$delta_UEMS)]
print("How many proteins and samples")[1] "How many proteins and samples"dim(protSub)[1] 379 36Differential expression
design <- model.matrix(~ delta_UEMS, colData(protSub))

resTab <- testDiff(protSub, design, coef = "delta_UEMS", assayName = "imputed")

allResList[["corrOutcome_baseline_treatedB"]] <- resTab
hist(resTab$pval)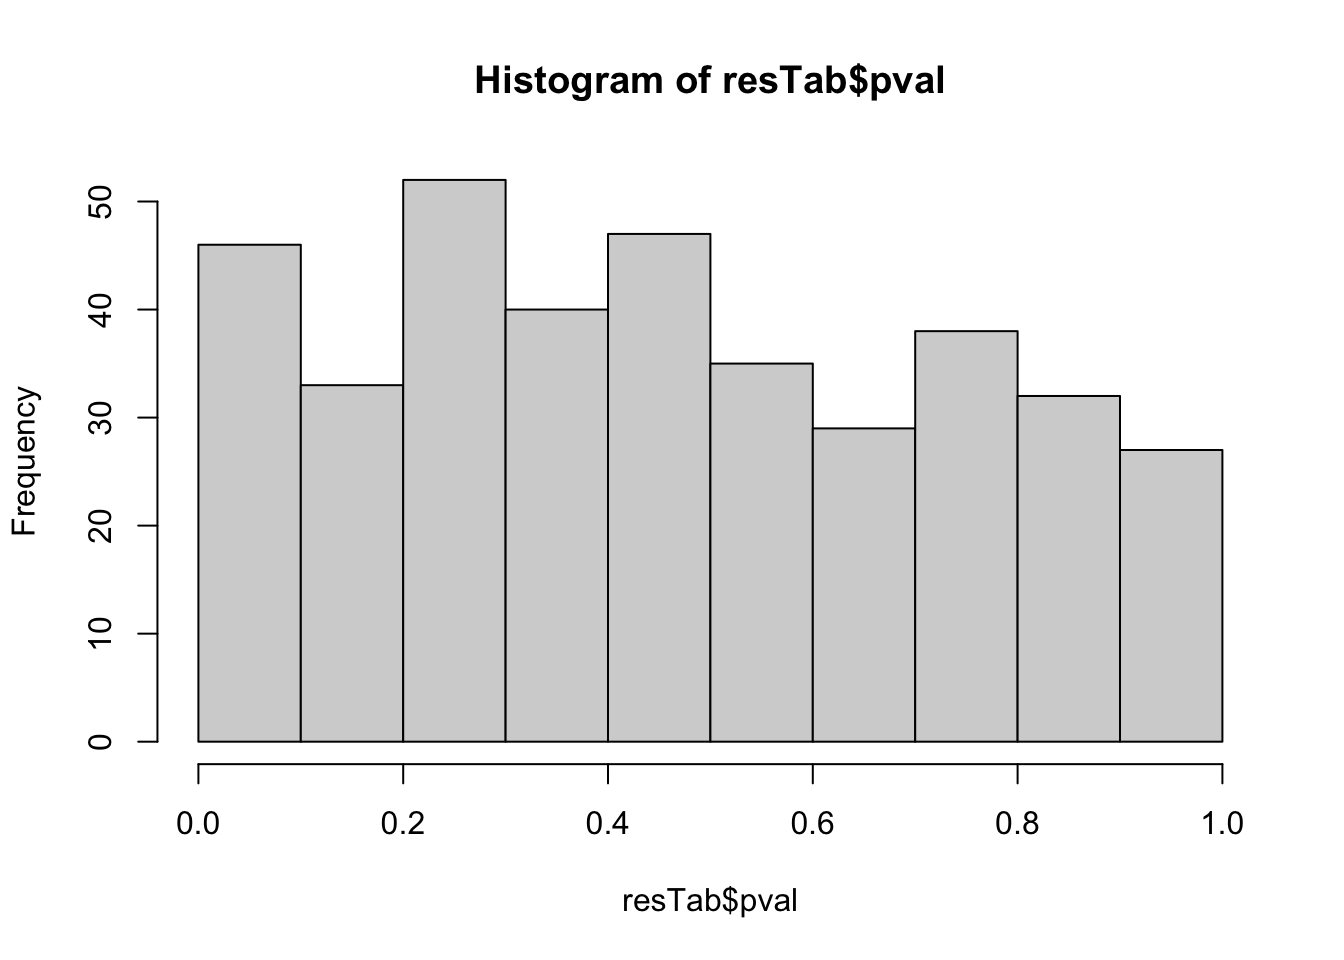
Table of proteins passed raw P-value < 0.05
filter(resTab, pval <= 0.05) %>% mutate(across(where(is.numeric), formatC, digits=2)) %>%
  select(name, symbol, pval, adj_pval, diff, n_obs) %>%
  DT::datatable()
Correlation plot
exprMat <- assays(protSub)[[2]]
pList <- lapply(seq(20), function(i) {
    rec <- resTab[i,]
    plotTab <- tibble(expr = exprMat[rec$name,],
                      nodeGroup = protSub$nodeGroup,
                      delta_UEMS = protSub$delta_UEMS)
    ggplot(plotTab, aes(x=delta_UEMS, y=expr)) +
        geom_point(aes(col = nodeGroup)) +
        ggtitle(sprintf("%s (P=%s)",rec$symbol,formatC(rec$pval, digits = 2))) +
        #scale_color_gradient(low="green",high="red") +
        geom_smooth(method = "lm") +
        theme_bw() +
        theme(plot.title = element_text(hjust = 0.5, face = "bold"))
})

cowplot::plot_grid(plotlist = pList, ncol=4)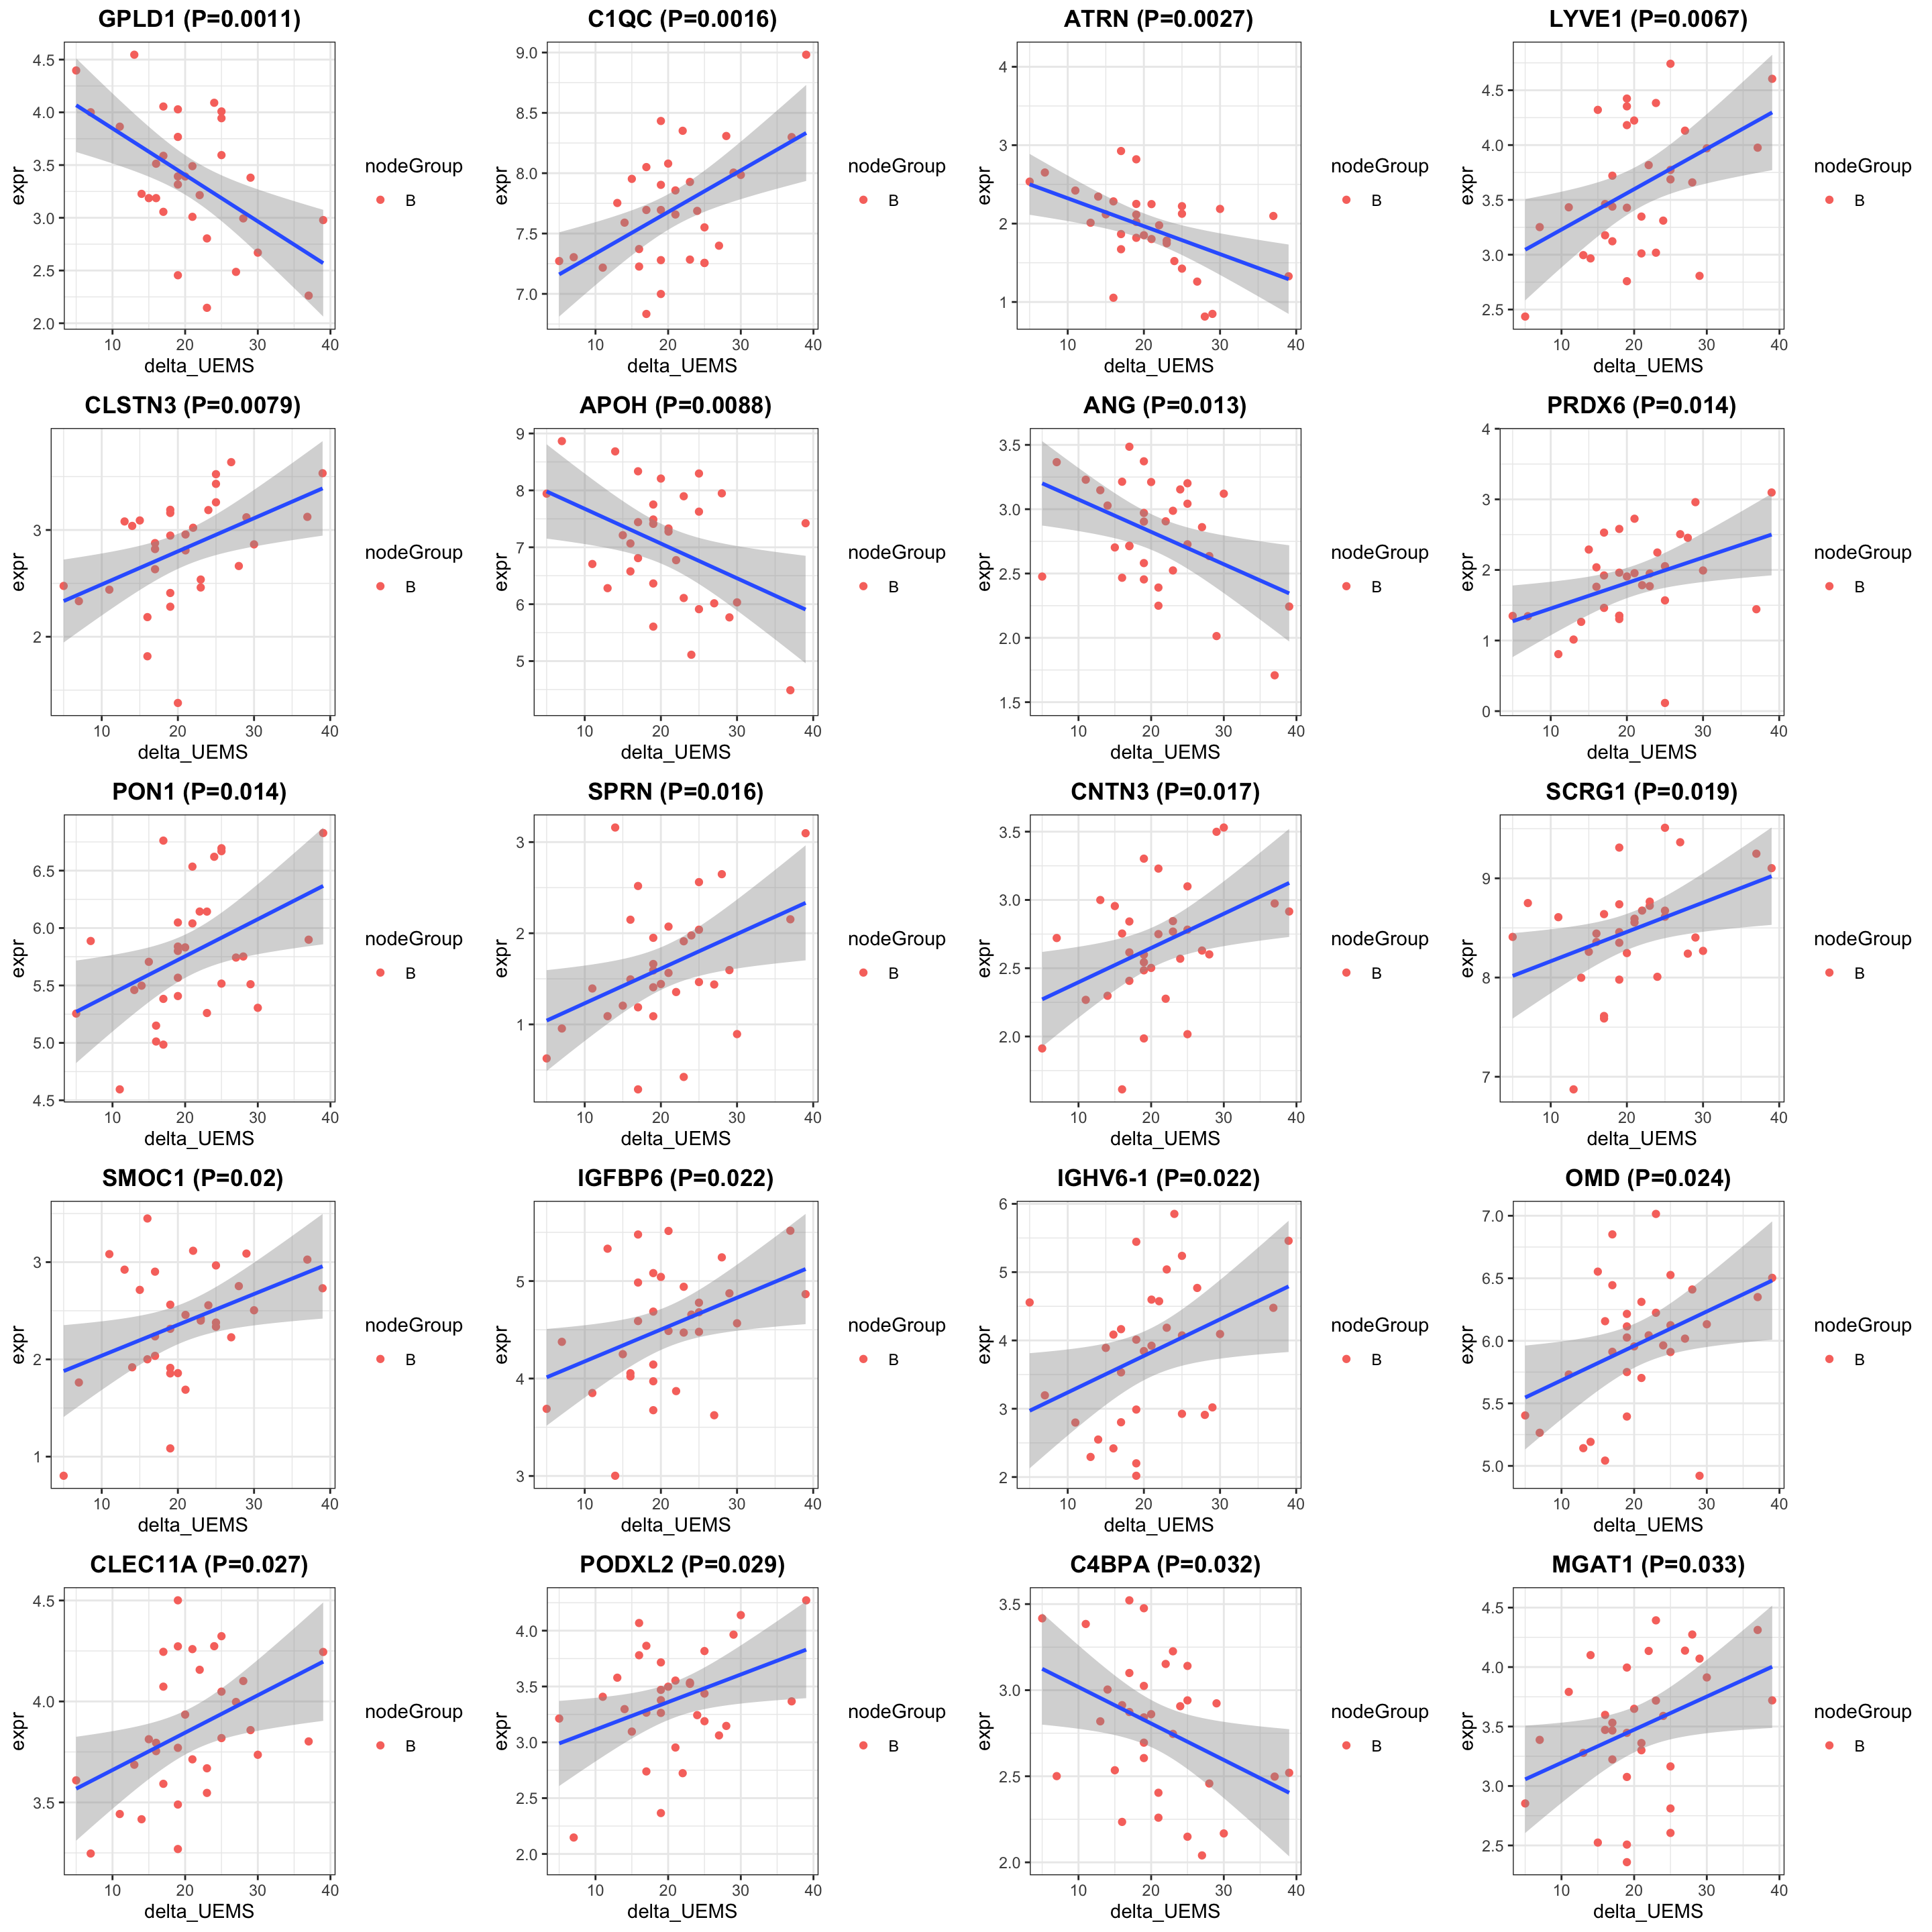
Enrichment analysis
gmts = list(GO_BiologicalProcess = "../data/gmts/c5.go.bp.v2023.2.Hs.symbols.gmt",
            GO_MolecularFunction = "../data/gmts/c5.go.mf.v2023.2.Hs.symbols.gmt")
plotList <- runGeneSetEnrichment(resTab, gmts, genePCut  = 1, pCutSet = 0.05, setFdr = FALSE, method = "gsea")
plotList$plot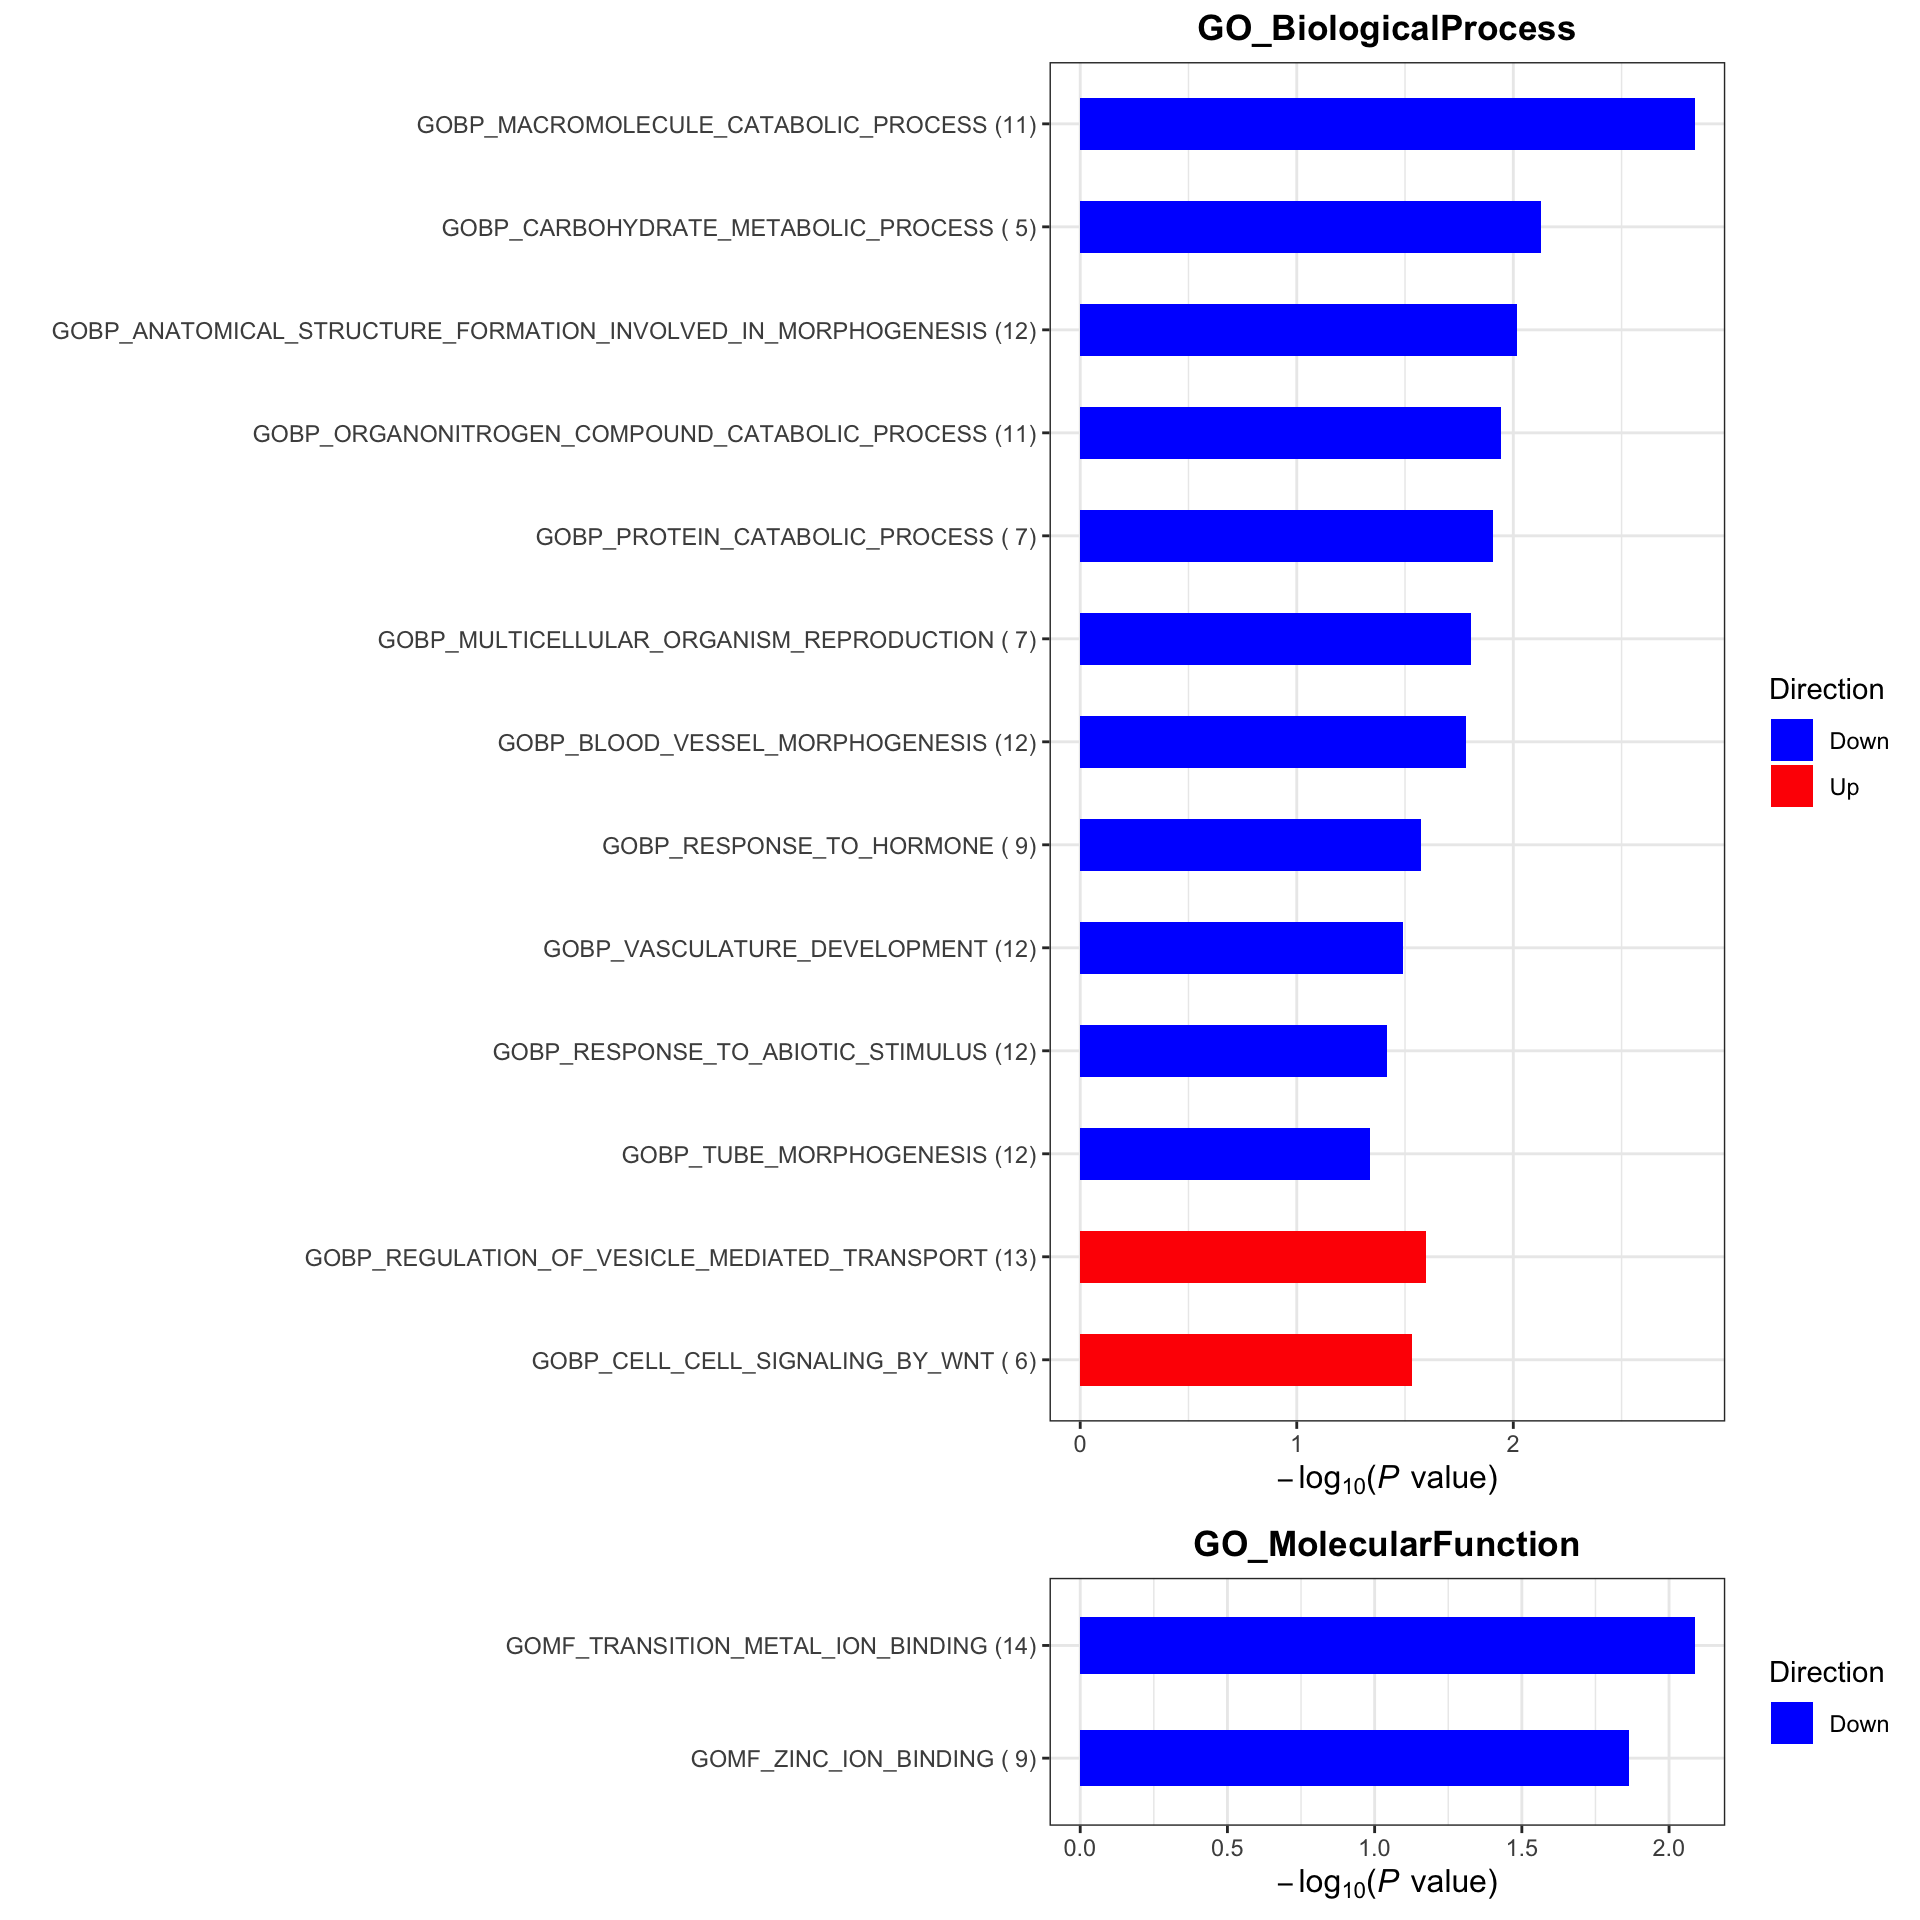
After treatment (visit 8)
Subsetting
#subset for patients in the placebo group
protSub <- prepareProt(seProt_corr, filterCondi = list(Treatment ="1", Visit = "8", nodeGroup ="B"), perNA = 0.5)
[1] "Number of proteins: 375, number of samples: 30"#protSub <- seProt_corr[,seProt_corr$Treatment %in% 1 & seProt_corr$Visit %in% 3 & !is.na(seProt_corr$delta_UEMS)]
print("How many proteins and samples")[1] "How many proteins and samples"dim(protSub)[1] 375 30Differential expression
design <- model.matrix(~ delta_UEMS, colData(protSub))

resTab <- testDiff(protSub, design, coef = "delta_UEMS", assayName = "imputed")

allResList[["corrOutcome_visit8_treatedB"]] <- resTab
hist(resTab$pval)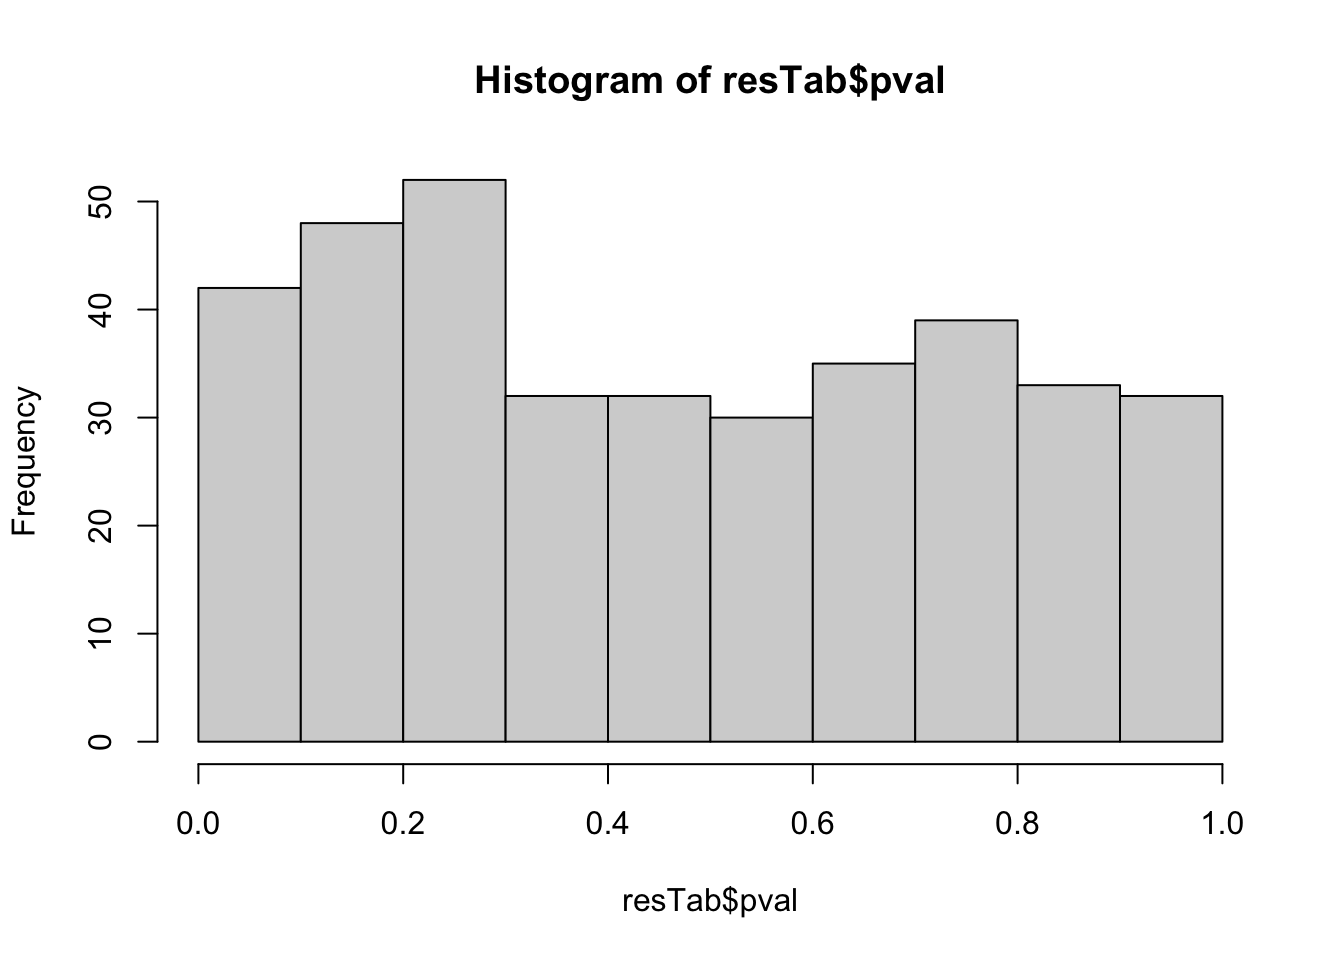
Table of proteins passed raw P-value < 0.05
filter(resTab, pval <= 0.05) %>% mutate(across(where(is.numeric), formatC, digits=2)) %>%
  select(name, symbol, pval, adj_pval, diff, n_obs) %>%
  DT::datatable()
Correlation plot
exprMat <- assay(protSub)
pList <- lapply(seq(20), function(i) {
    rec <- resTab[i,]
    plotTab <- tibble(expr = exprMat[rec$name,],
                      nodeGroup = protSub$nodeGroup,
                      delta_UEMS = protSub$delta_UEMS)
    ggplot(plotTab, aes(x=delta_UEMS, y=expr)) +
        geom_point(aes(col = nodeGroup)) +
        ggtitle(sprintf("%s (P=%s)",rec$symbol,formatC(rec$pval, digits = 2))) +
        #scale_color_gradient(low="green",high="red") +
        geom_smooth(method = "lm") +
        theme_bw() +
        theme(plot.title = element_text(hjust = 0.5, face = "bold"))
})

cowplot::plot_grid(plotlist = pList, ncol=4)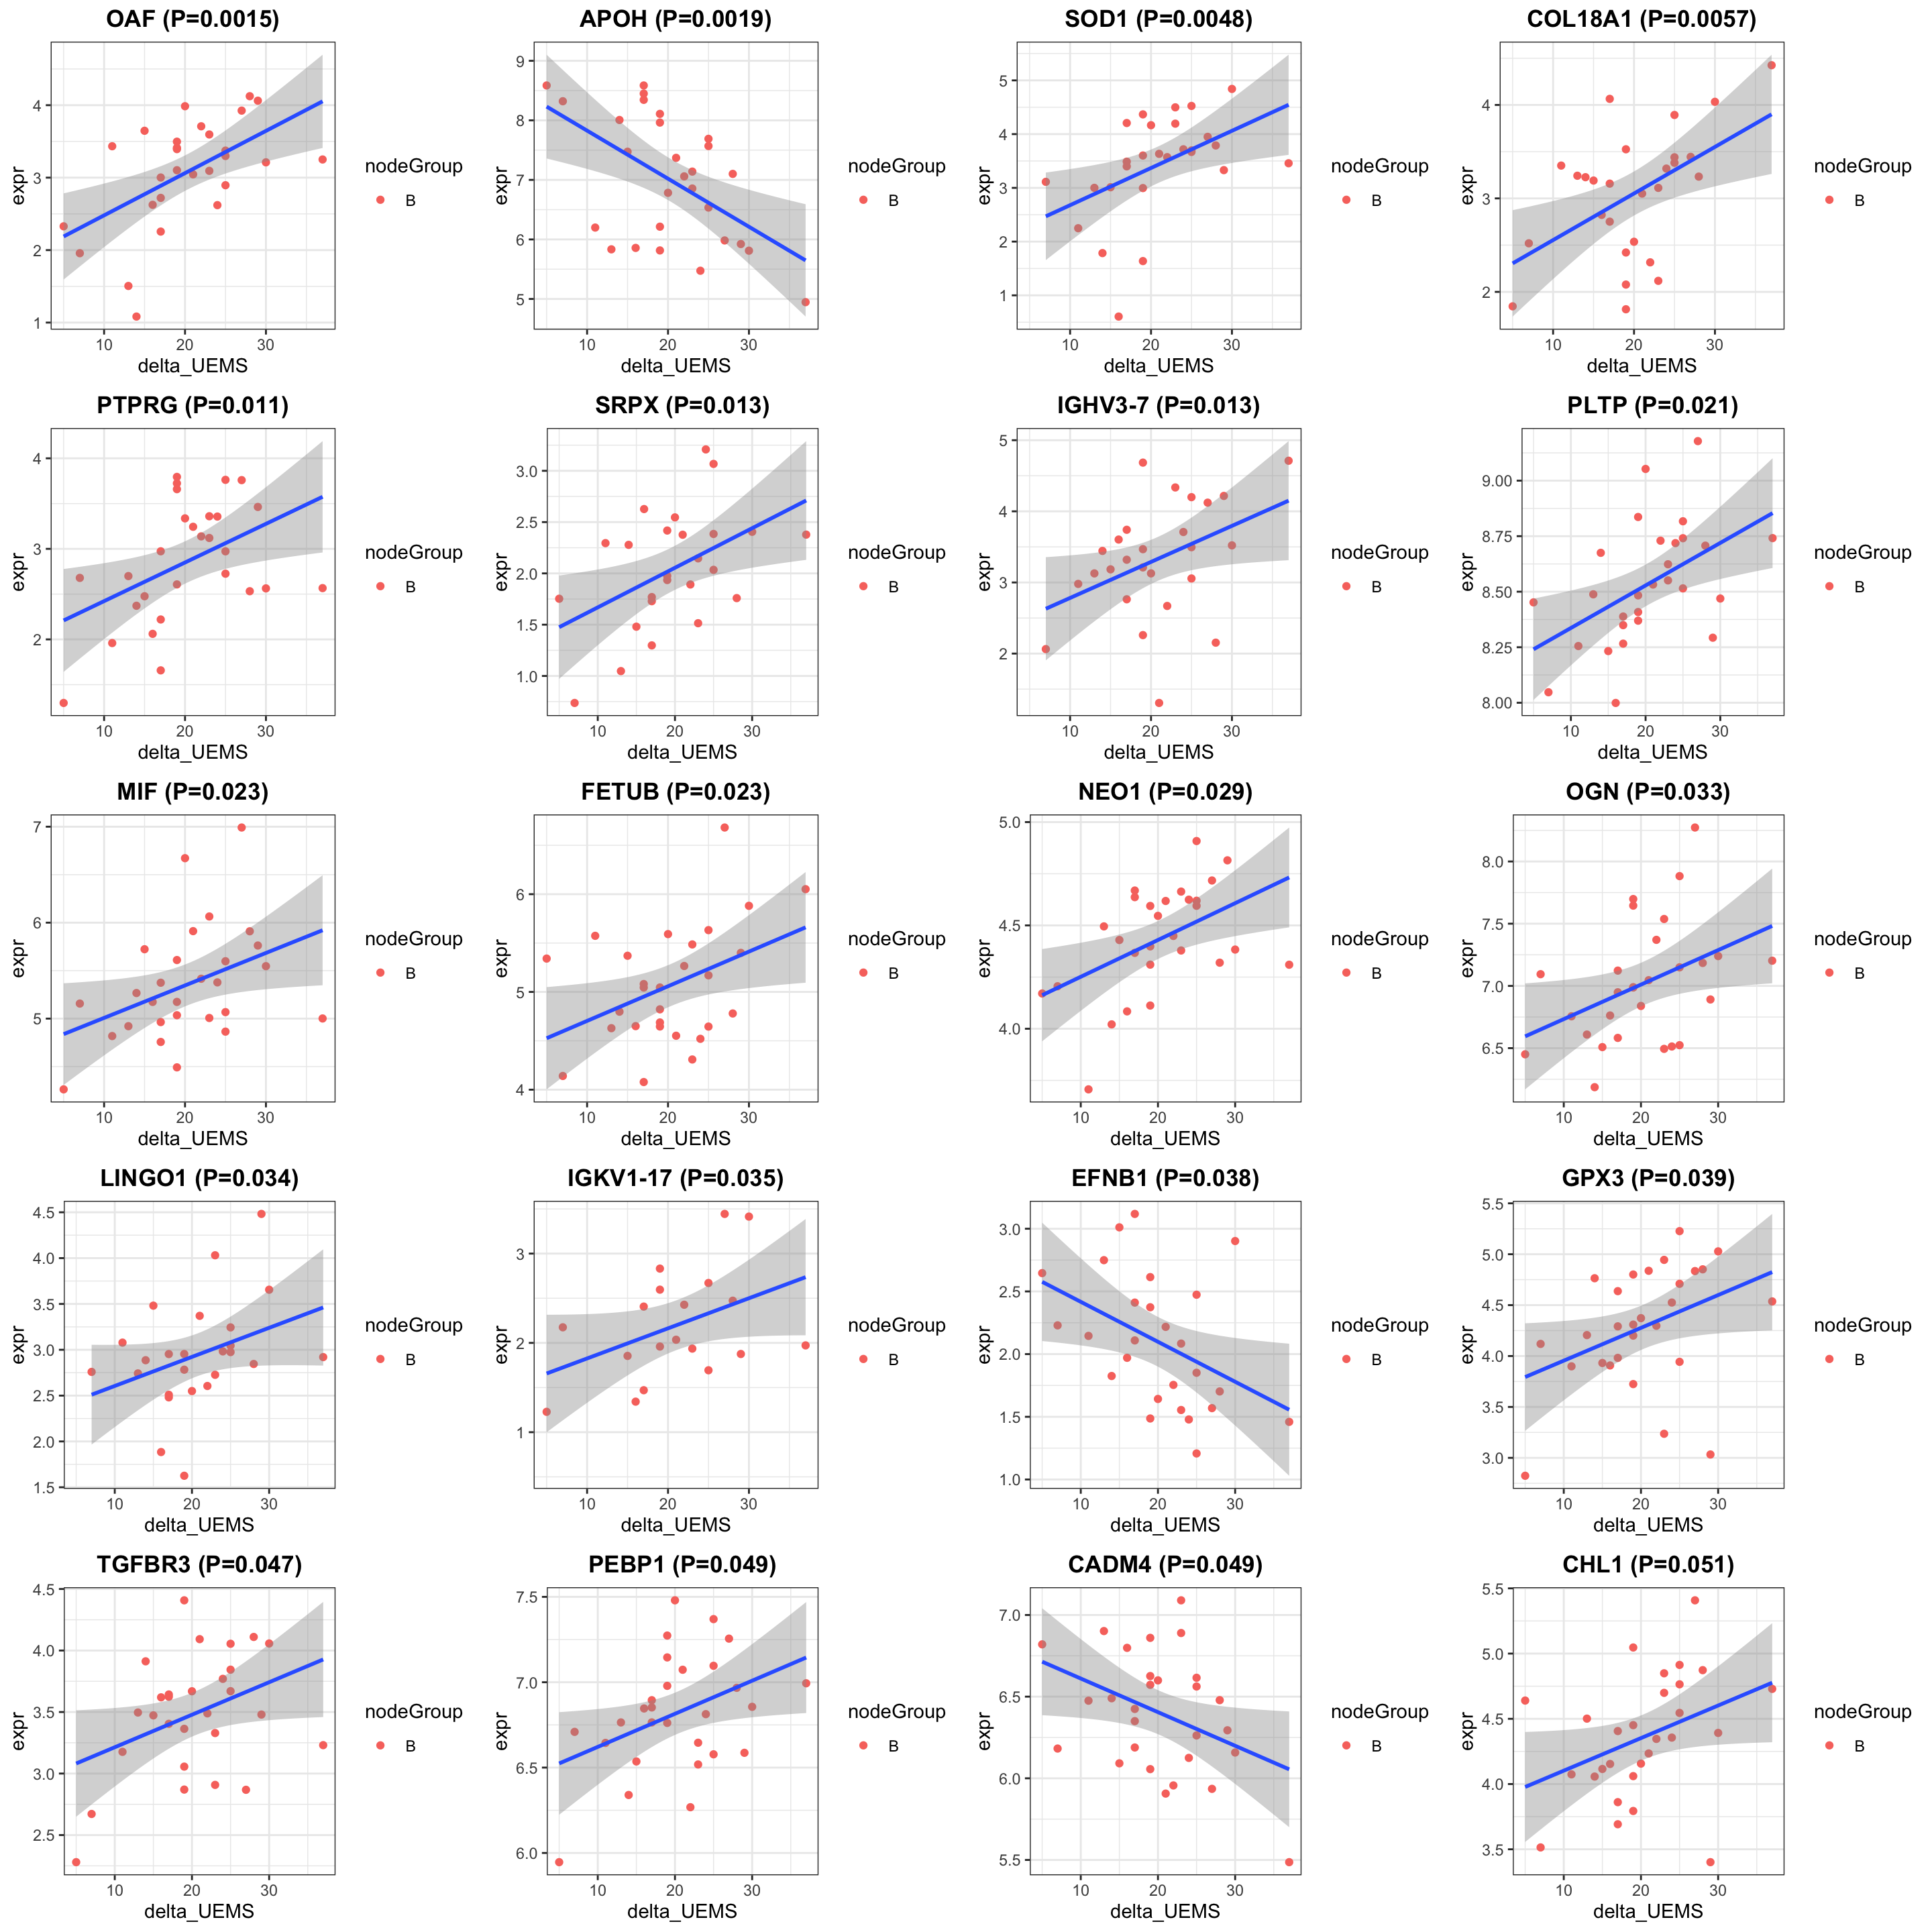
Enrichment analysis
gmts = list(GO_BiologicalProcess = "../data/gmts/c5.go.bp.v2023.2.Hs.symbols.gmt",
            GO_MolecularFunction = "../data/gmts/c5.go.mf.v2023.2.Hs.symbols.gmt")
plotList <- runGeneSetEnrichment(resTab, gmts, genePCut  = 1, pCutSet = 0.05, setFdr = FALSE, method = "gsea")
[1] "No sets passed the criteria"plotList$plot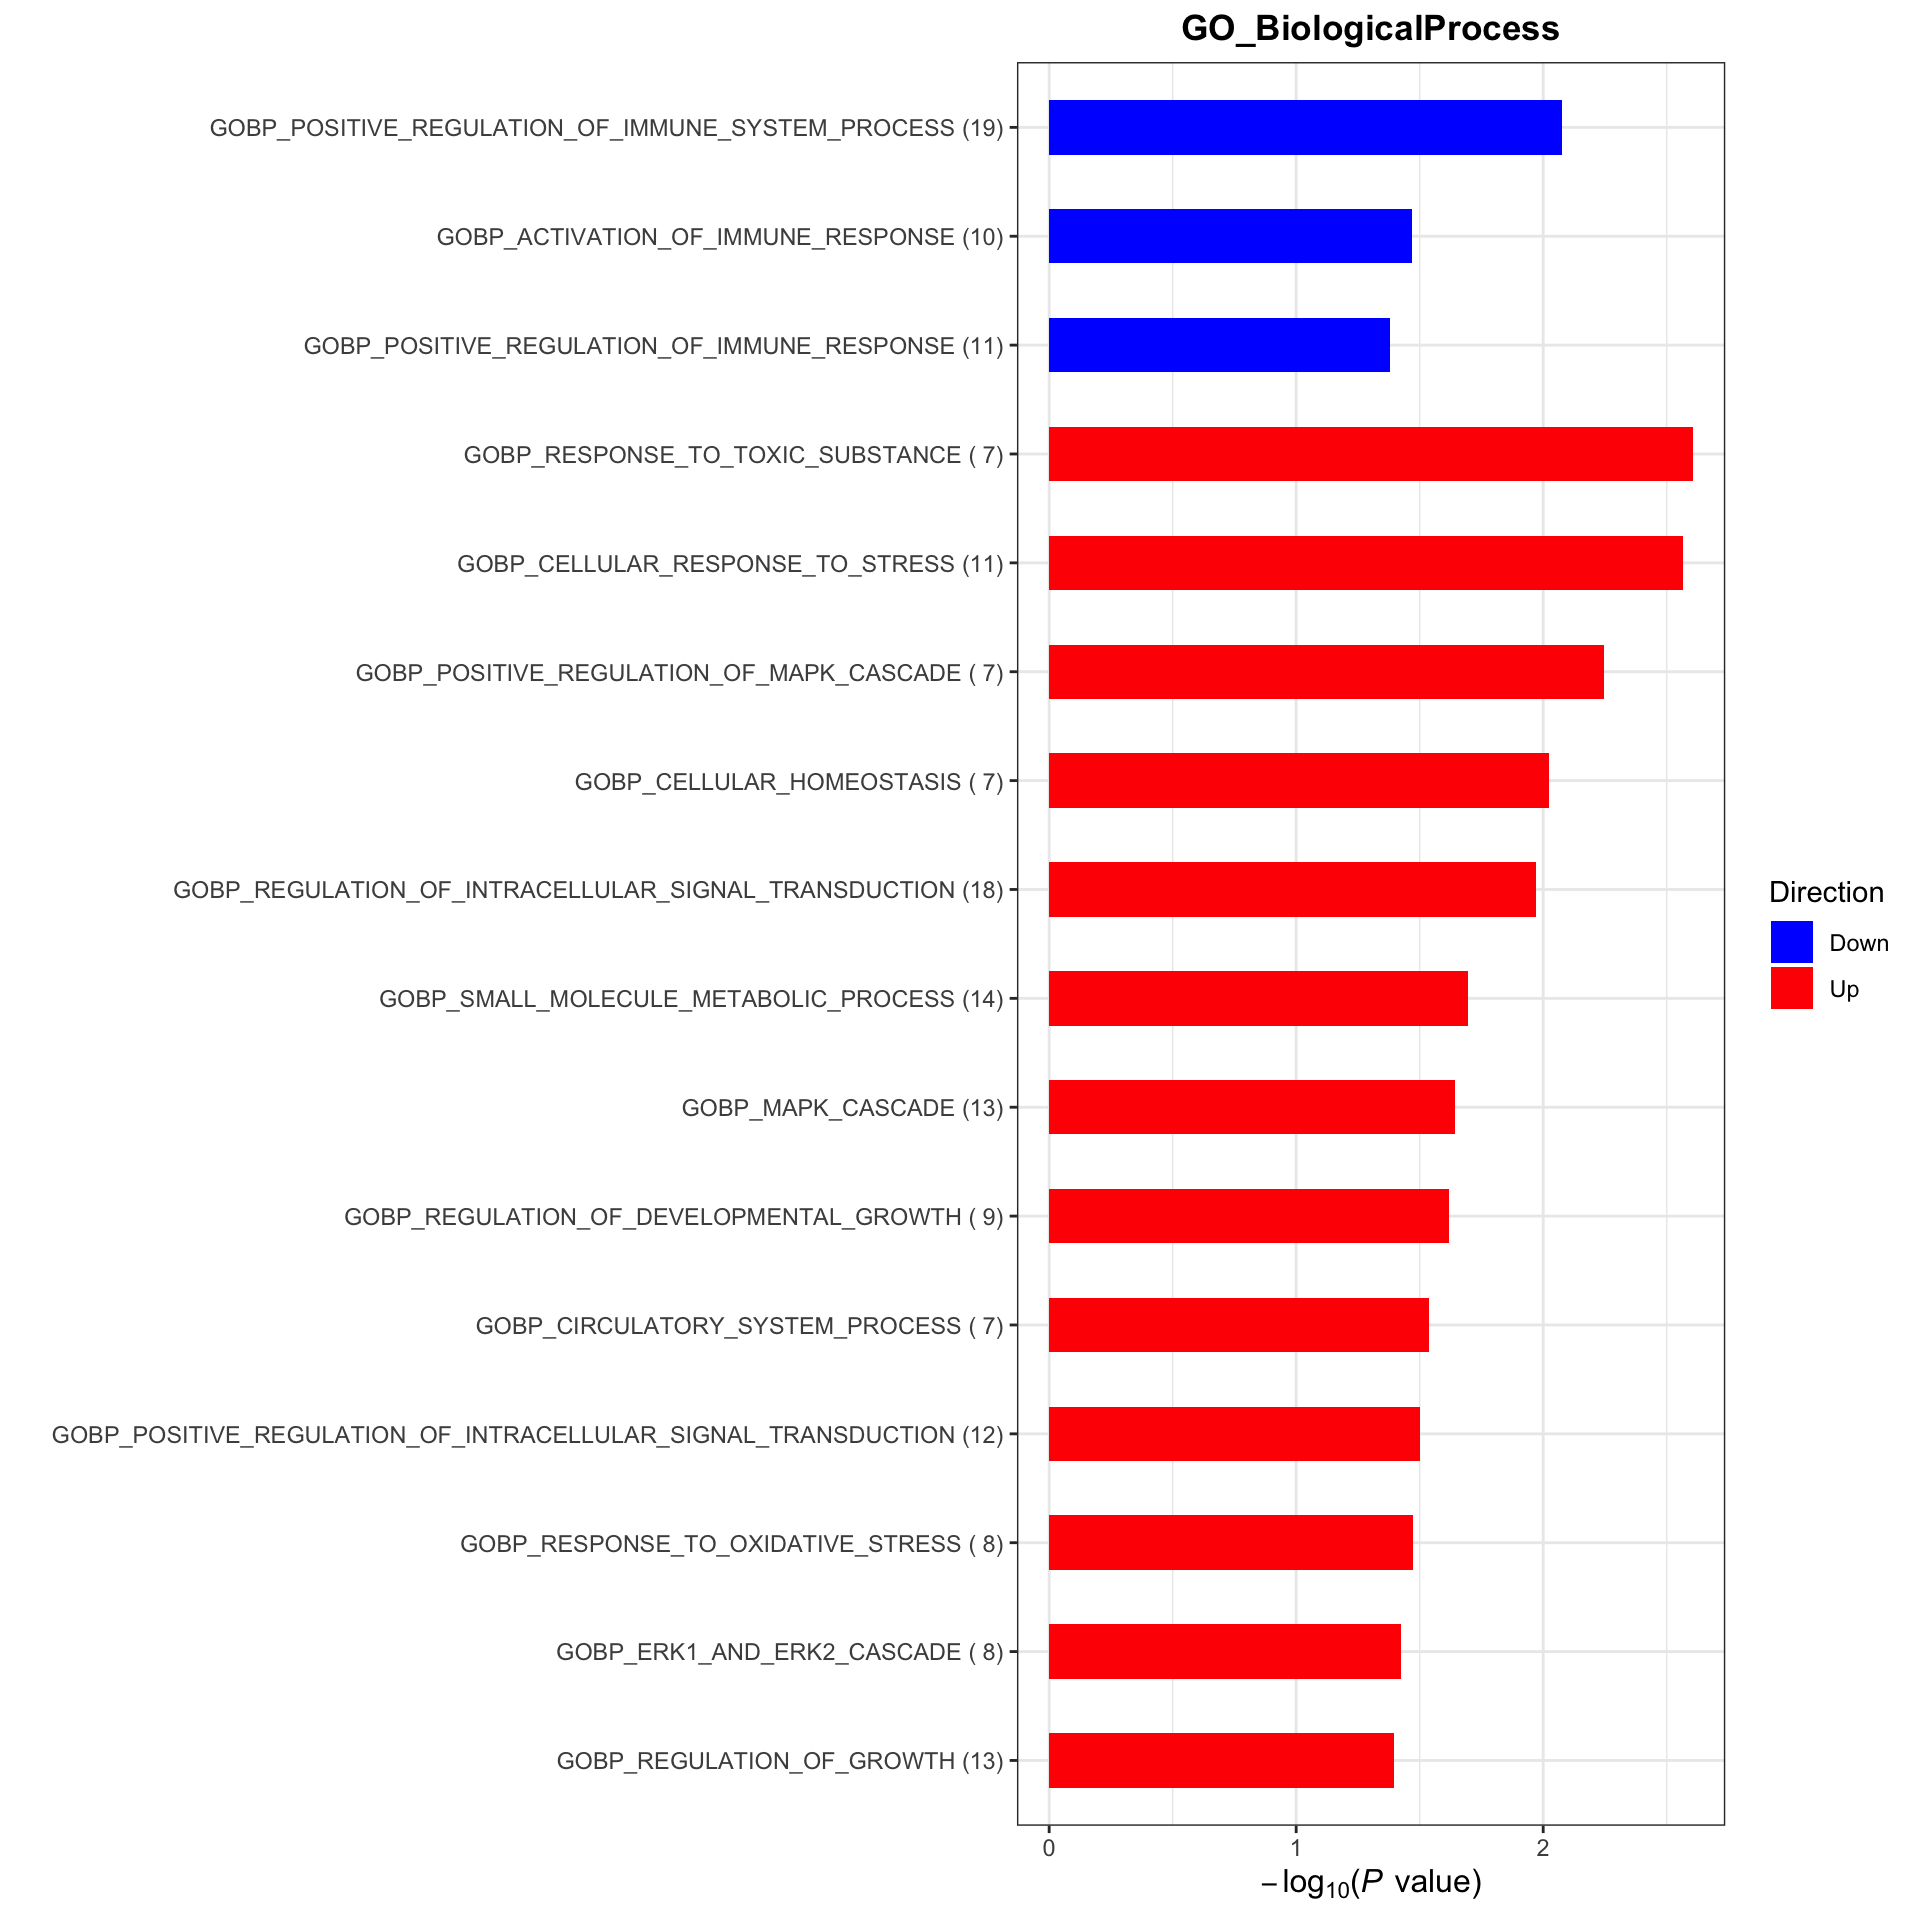
At endpoint (visit 10)
Subsetting
#subset for patients in the placebo group
protSub <- prepareProt(seProt_corr, filterCondi = list(Treatment ="1", Visit = "10", nodeGroup = "B"), perNA = 0.5)
[1] "Number of proteins: 372, number of samples: 29"#protSub <- seProt_corr[,seProt_corr$Treatment %in% 1 & seProt_corr$Visit %in% 3 & !is.na(seProt_corr$delta_UEMS)]
print("How many proteins and samples")[1] "How many proteins and samples"dim(protSub)[1] 372 29Differential expression
design <- model.matrix(~ delta_UEMS, colData(protSub))

resTab <- testDiff(protSub, design, coef = "delta_UEMS", assayName = "imputed")

allResList[["corrOutcome_visit10_treatedB"]] <- resTab
hist(resTab$pval)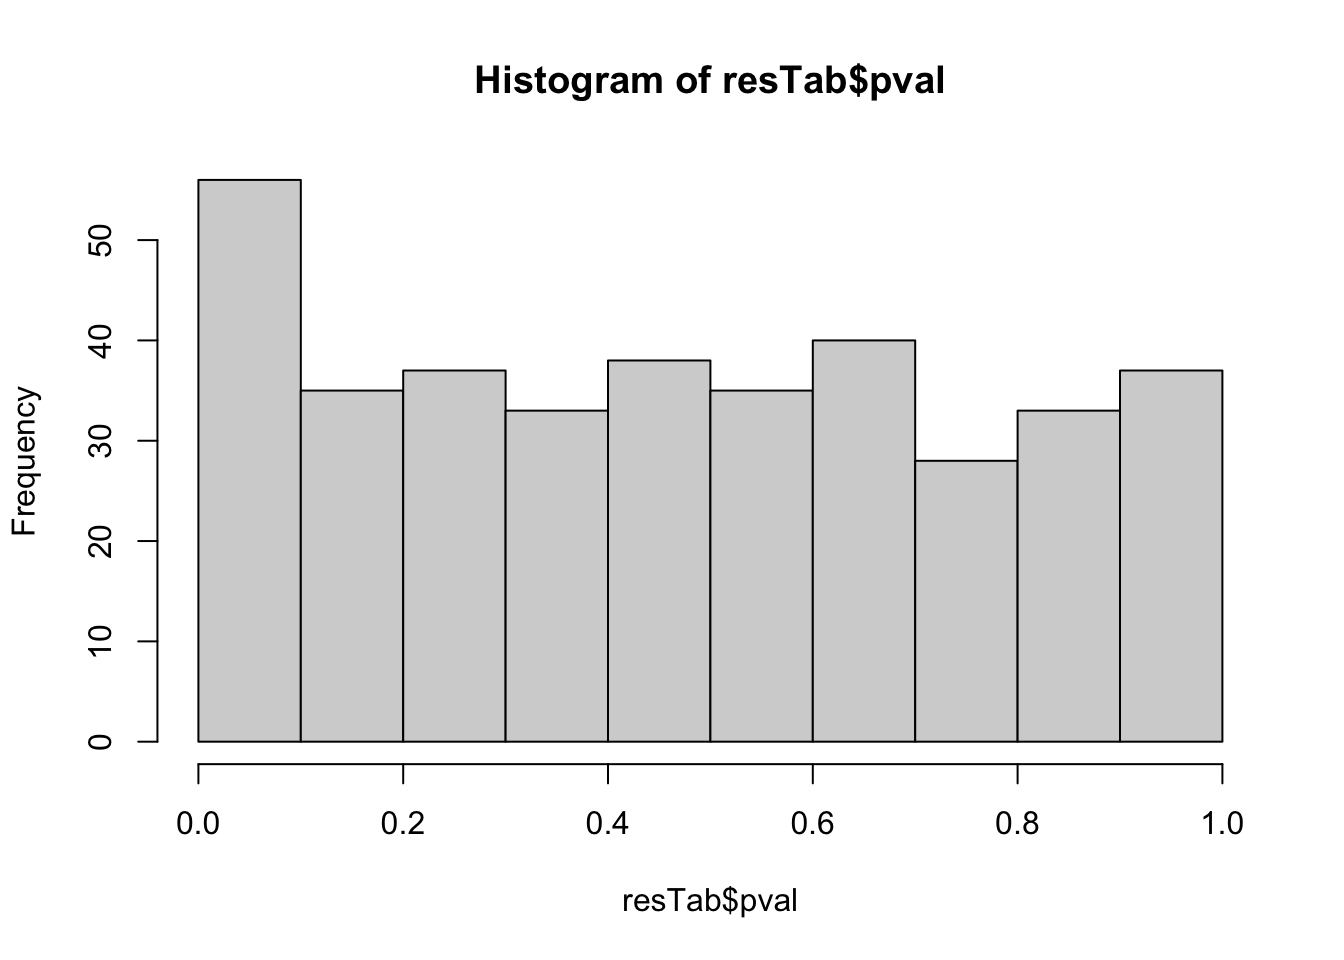
Table of proteins passed raw P-value < 0.05
filter(resTab, pval <= 0.05) %>% mutate(across(where(is.numeric), formatC, digits=2)) %>%
  select(name, symbol, pval, adj_pval, diff, n_obs) %>%
  DT::datatable()
Correlation plot
exprMat <- assays(protSub)[[2]]
pList <- lapply(seq(20), function(i) {
    rec <- resTab[i,]
    plotTab <- tibble(expr = exprMat[rec$name,],
                      nodeGroup = protSub$nodeGroup,
                      delta_UEMS = protSub$delta_UEMS)
    ggplot(plotTab, aes(x=delta_UEMS, y=expr)) +
        geom_point(aes(col = nodeGroup)) +
        ggtitle(sprintf("%s (P=%s)",rec$symbol,formatC(rec$pval, digits = 2))) +
        #scale_color_gradient(low="green",high="red") +
        geom_smooth(method = "lm") +
        theme_bw() +
        theme(plot.title = element_text(hjust = 0.5, face = "bold"))
})

cowplot::plot_grid(plotlist = pList, ncol=4)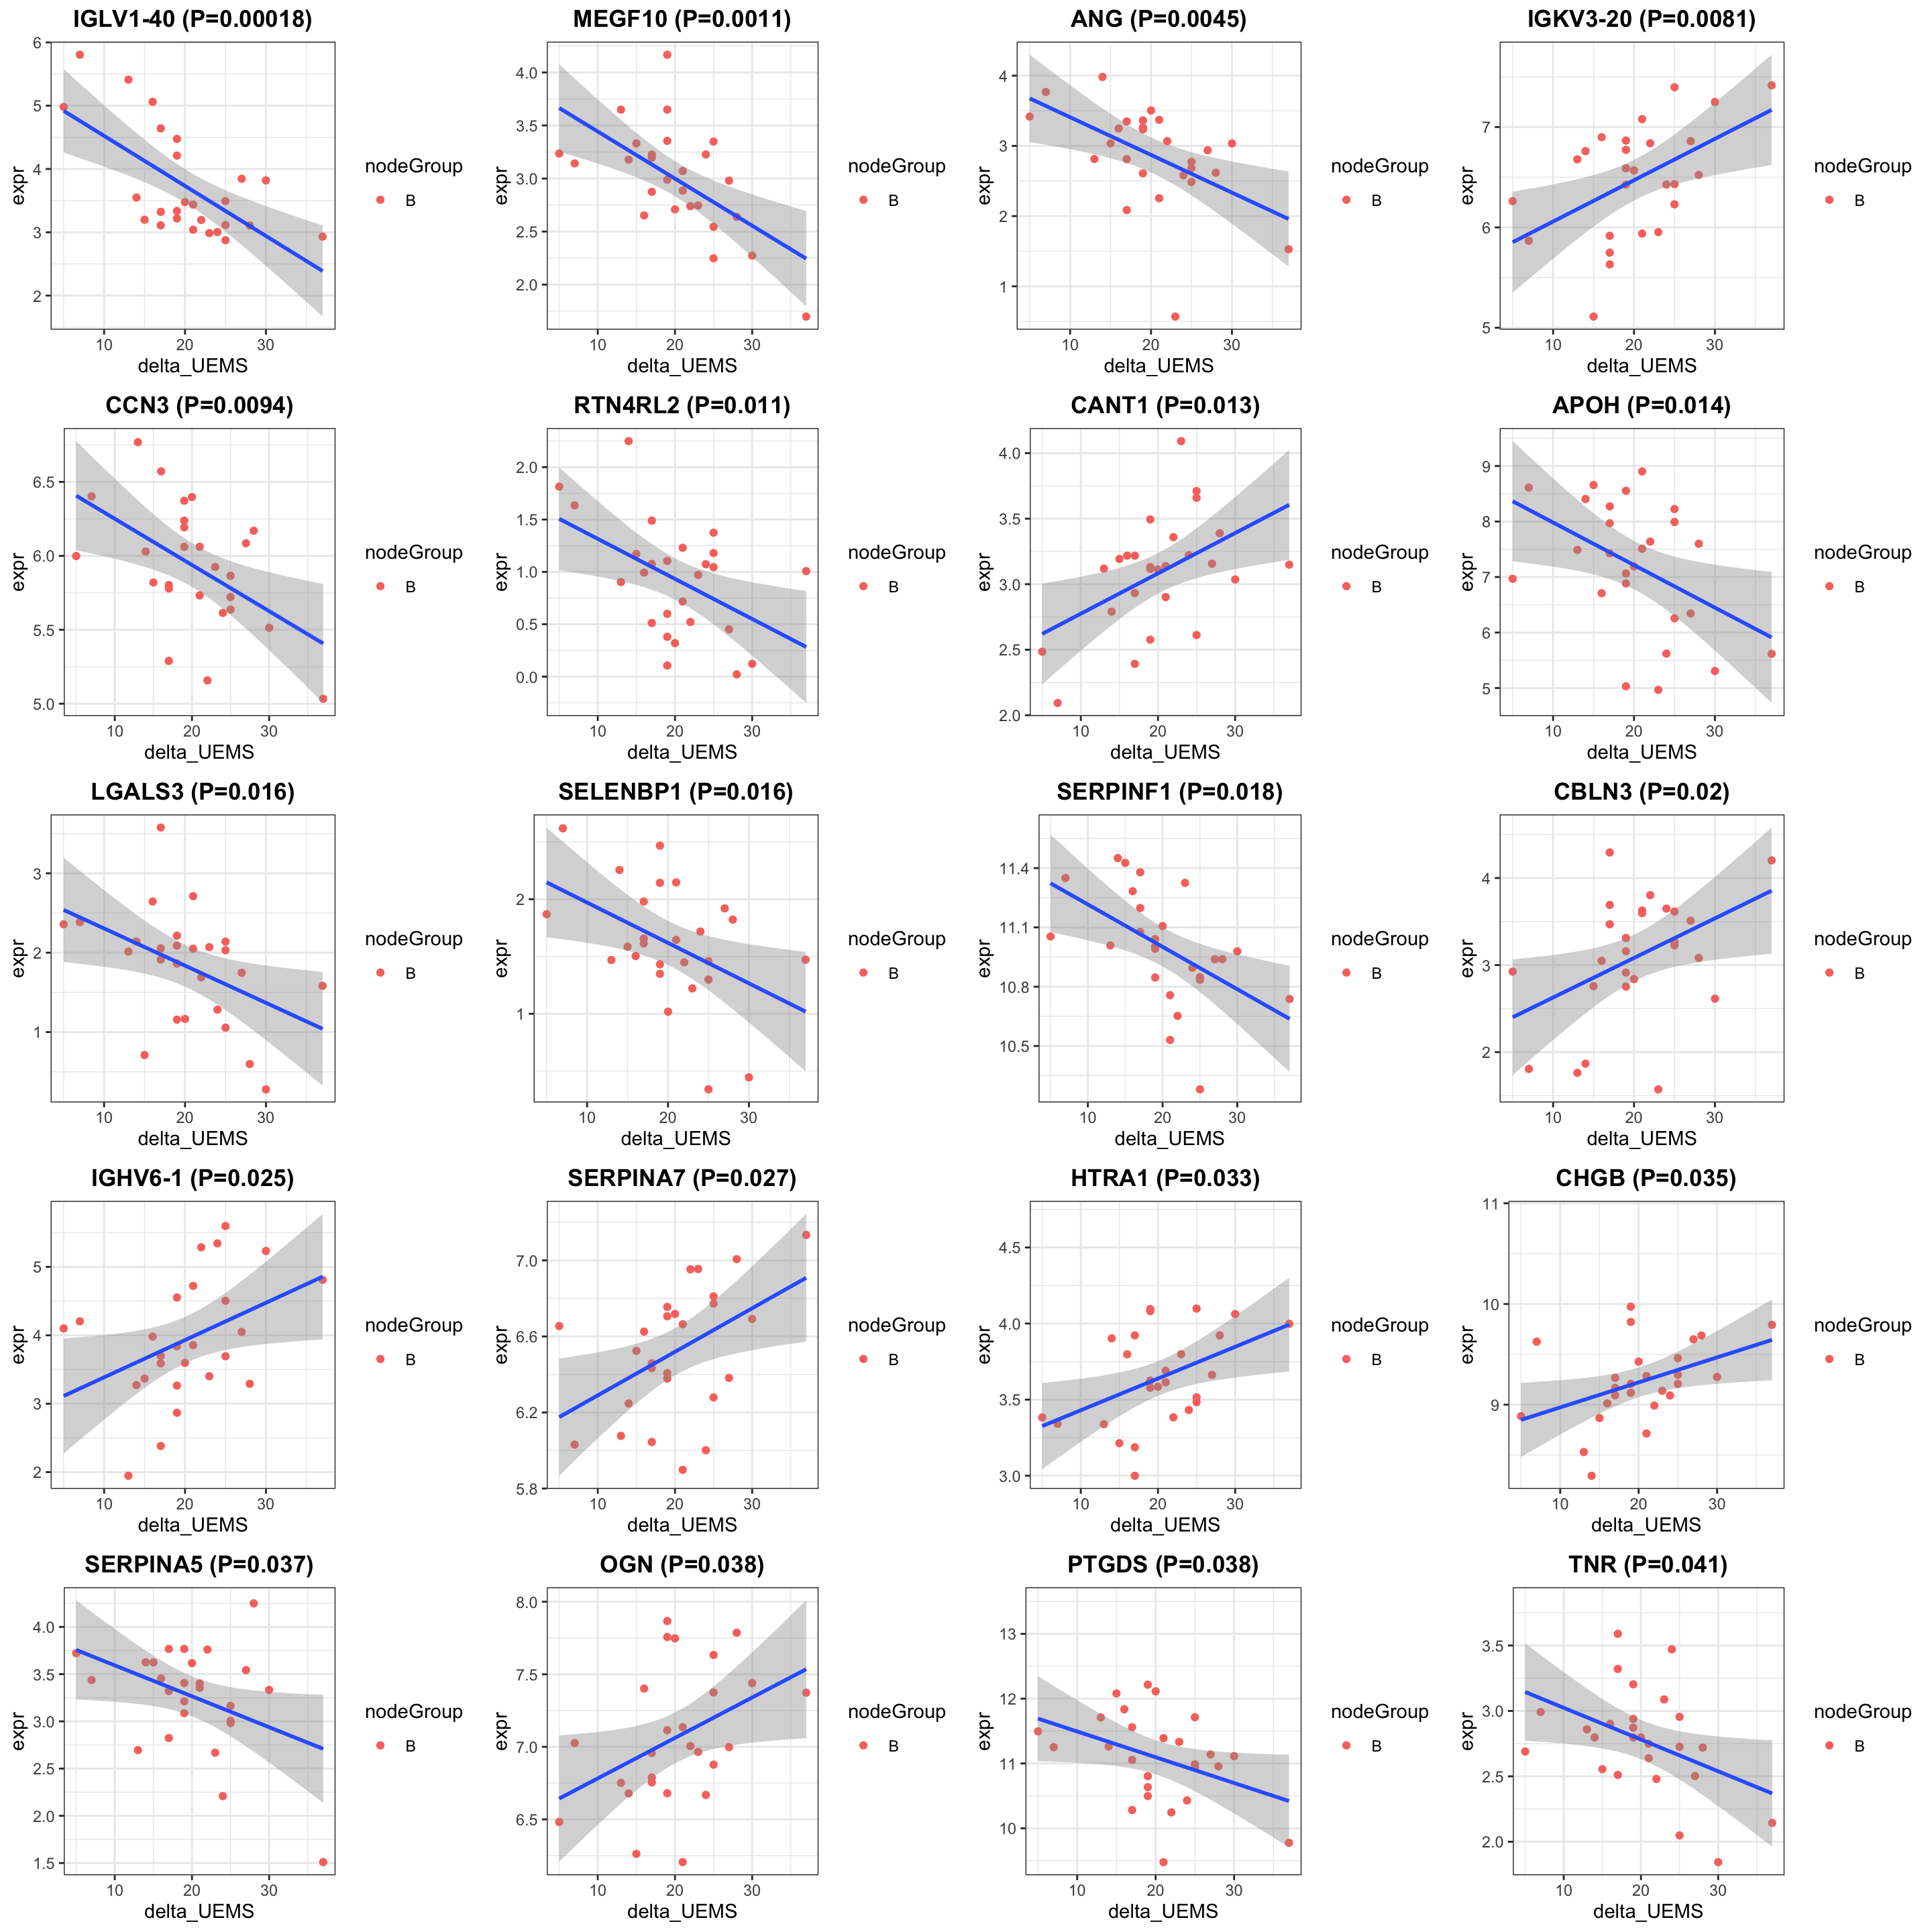
Enrichment analysis
gmts = list(GO_BiologicalProcess = "../data/gmts/c5.go.bp.v2023.2.Hs.symbols.gmt",
            GO_MolecularFunction = "../data/gmts/c5.go.mf.v2023.2.Hs.symbols.gmt")
plotList <- runGeneSetEnrichment(resTab, gmts, genePCut  = 1, pCutSet = 0.05, setFdr = FALSE, method = "gsea")
plotList$plot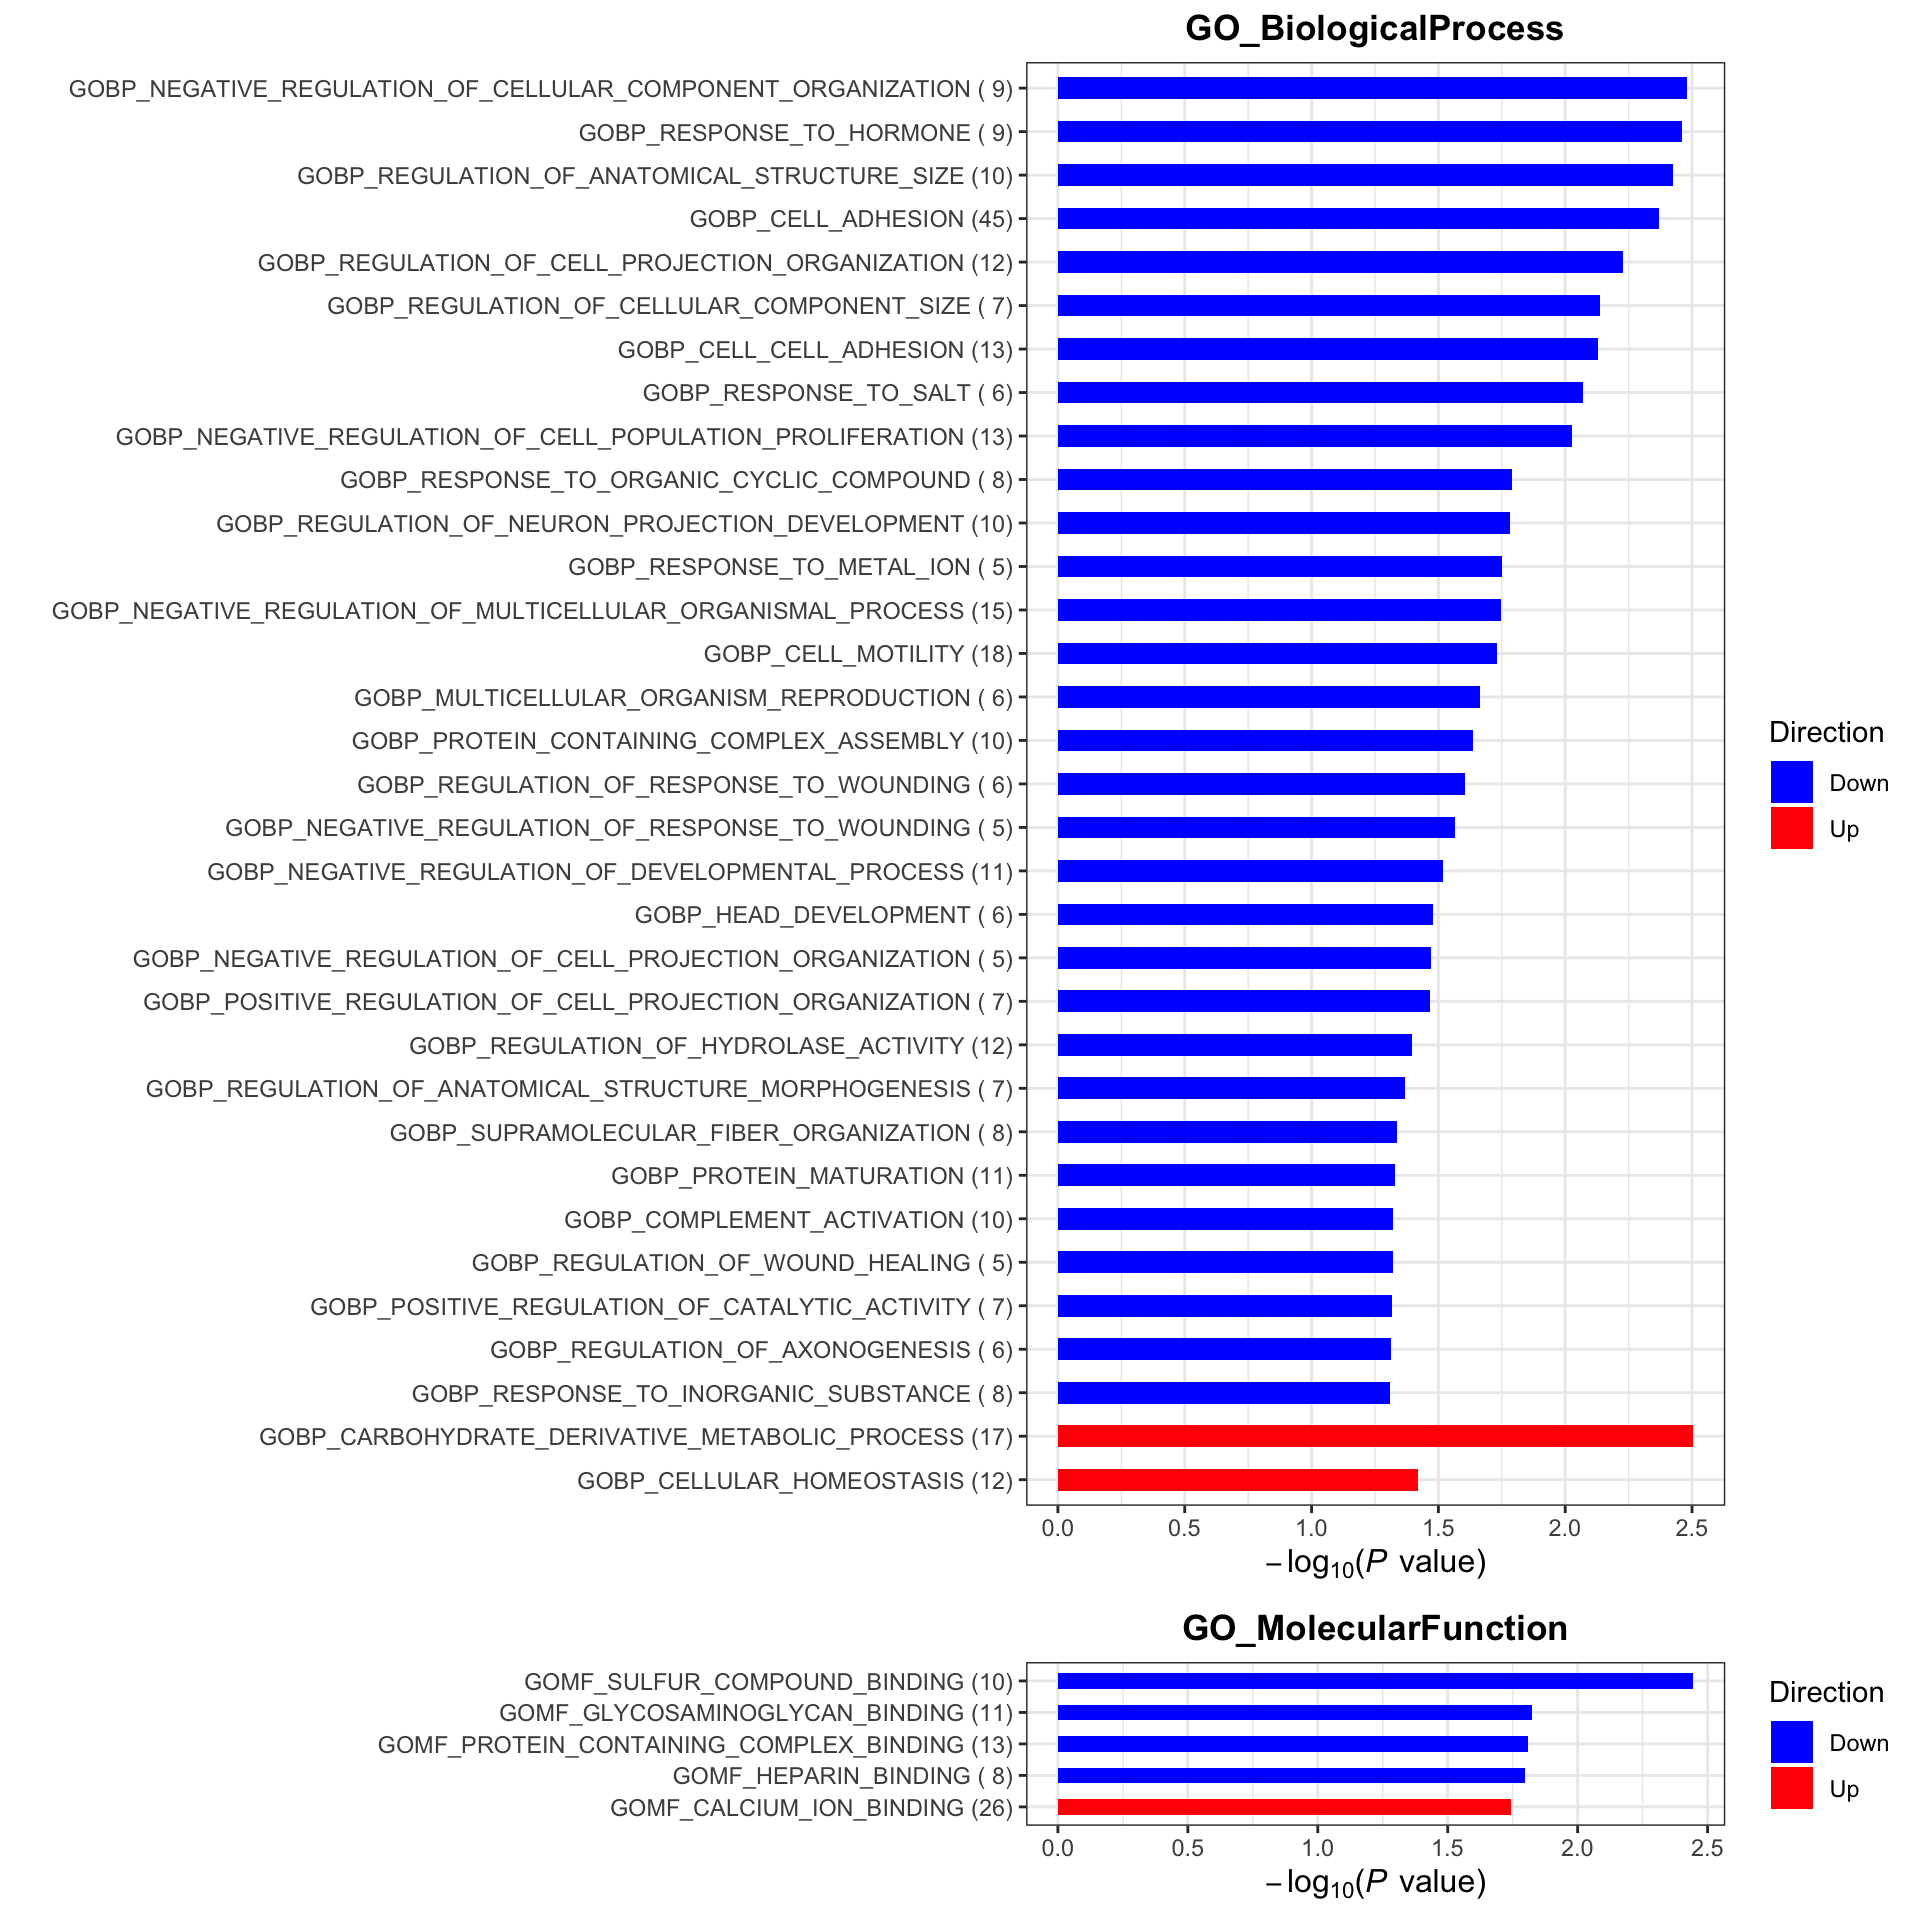
Change between baseline and after treatment (visit 8 - visit3)
Subsetting
#subset for patients in the placebo group
protSub <- prepareProt(seProt_corr, filterCondi = list(Treatment = "1", Visit = c(3,8), nodeGroup="B"), perNA = 0.5)
[1] "Number of proteins: 377, number of samples: 66"protSub.before <- protSub[, protSub$Visit %in% 3 & !is.na(protSub$delta_UEMS)]
protSub.after <- protSub[,protSub$Visit %in% 8 & !is.na(protSub$delta_UEMS)]
overPat <- intersect(protSub.after$PSN, protSub.before$PSN)
protSub.before <- protSub.before[,match(overPat, protSub.before$PSN)]
protSub.after <- protSub.after[,match(overPat, protSub.after$PSN)]
colnames(protSub.after) <- overPat
colnames(protSub.before) <- overPat
protSub <- protSub.before
assays(protSub)[[1]] <- assays(protSub.after)[[1]] - assays(protSub.before)[[1]]
assays(protSub)[[2]] <- assays(protSub.after)[[2]] - assays(protSub.before)[[2]]
#remove feature with too many missings
#protSub <- protSub[rowSums(is.na(assay(protSub)))/ncol(protSub) < 0.5,]
print("How many proteins and samples")[1] "How many proteins and samples"dim(protSub)[1] 377 28Differential expression
design <- model.matrix(~ delta_UEMS, colData(protSub))

resTab <- testDiff(protSub, design, coef = "delta_UEMS", assayName = "imputed")

allResList[["corrOutcome_diff83_treatedB"]] <- resTab

hist(resTab$pval)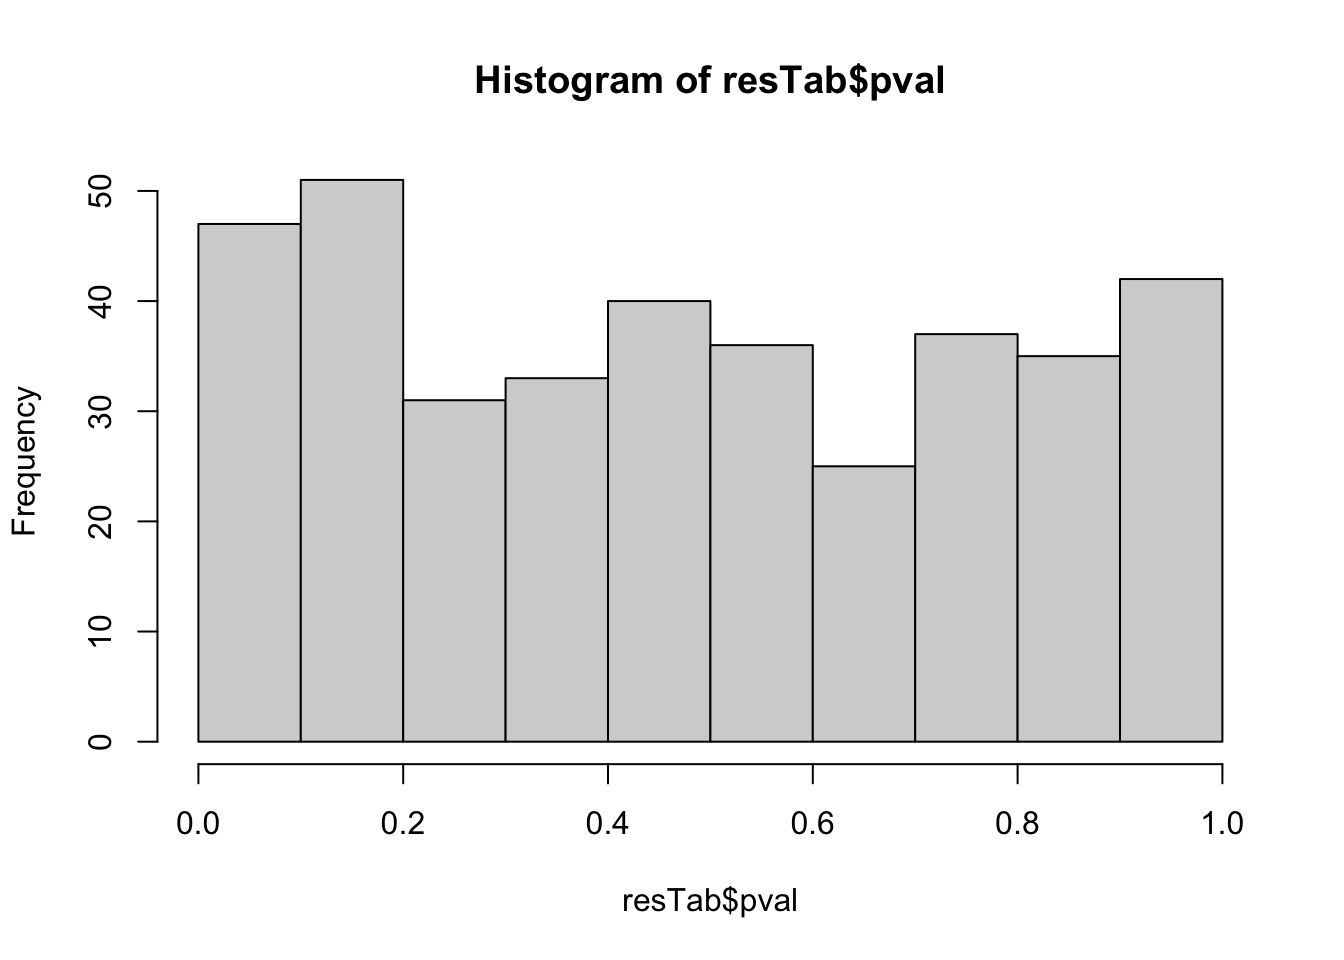
Table of proteins passed raw P-value < 0.05
filter(resTab, pval <= 0.05) %>% mutate(across(where(is.numeric), formatC, digits=2)) %>%
  select(name, symbol, pval, adj_pval, diff) %>%
  DT::datatable()
Correlation plot
exprMat <- assays(protSub)[[2]]
pList <- lapply(seq(20), function(i) {
    rec <- resTab[i,]
    plotTab <- tibble(expr = exprMat[rec$name,],
                      nodeGroup = protSub$nodeGroup,
                      delta_UEMS = protSub$delta_UEMS)
    ggplot(plotTab, aes(x=delta_UEMS, y=expr)) +
        geom_point(aes(col = nodeGroup)) +
        ggtitle(sprintf("%s (P=%s)",rec$symbol,formatC(rec$pval, digits = 2))) +
        #scale_color_gradient(low="green",high="red") +
        geom_smooth(method = "lm") +
        theme_bw() +
        theme(plot.title = element_text(hjust = 0.5, face = "bold"))
})

cowplot::plot_grid(plotlist = pList, ncol=4)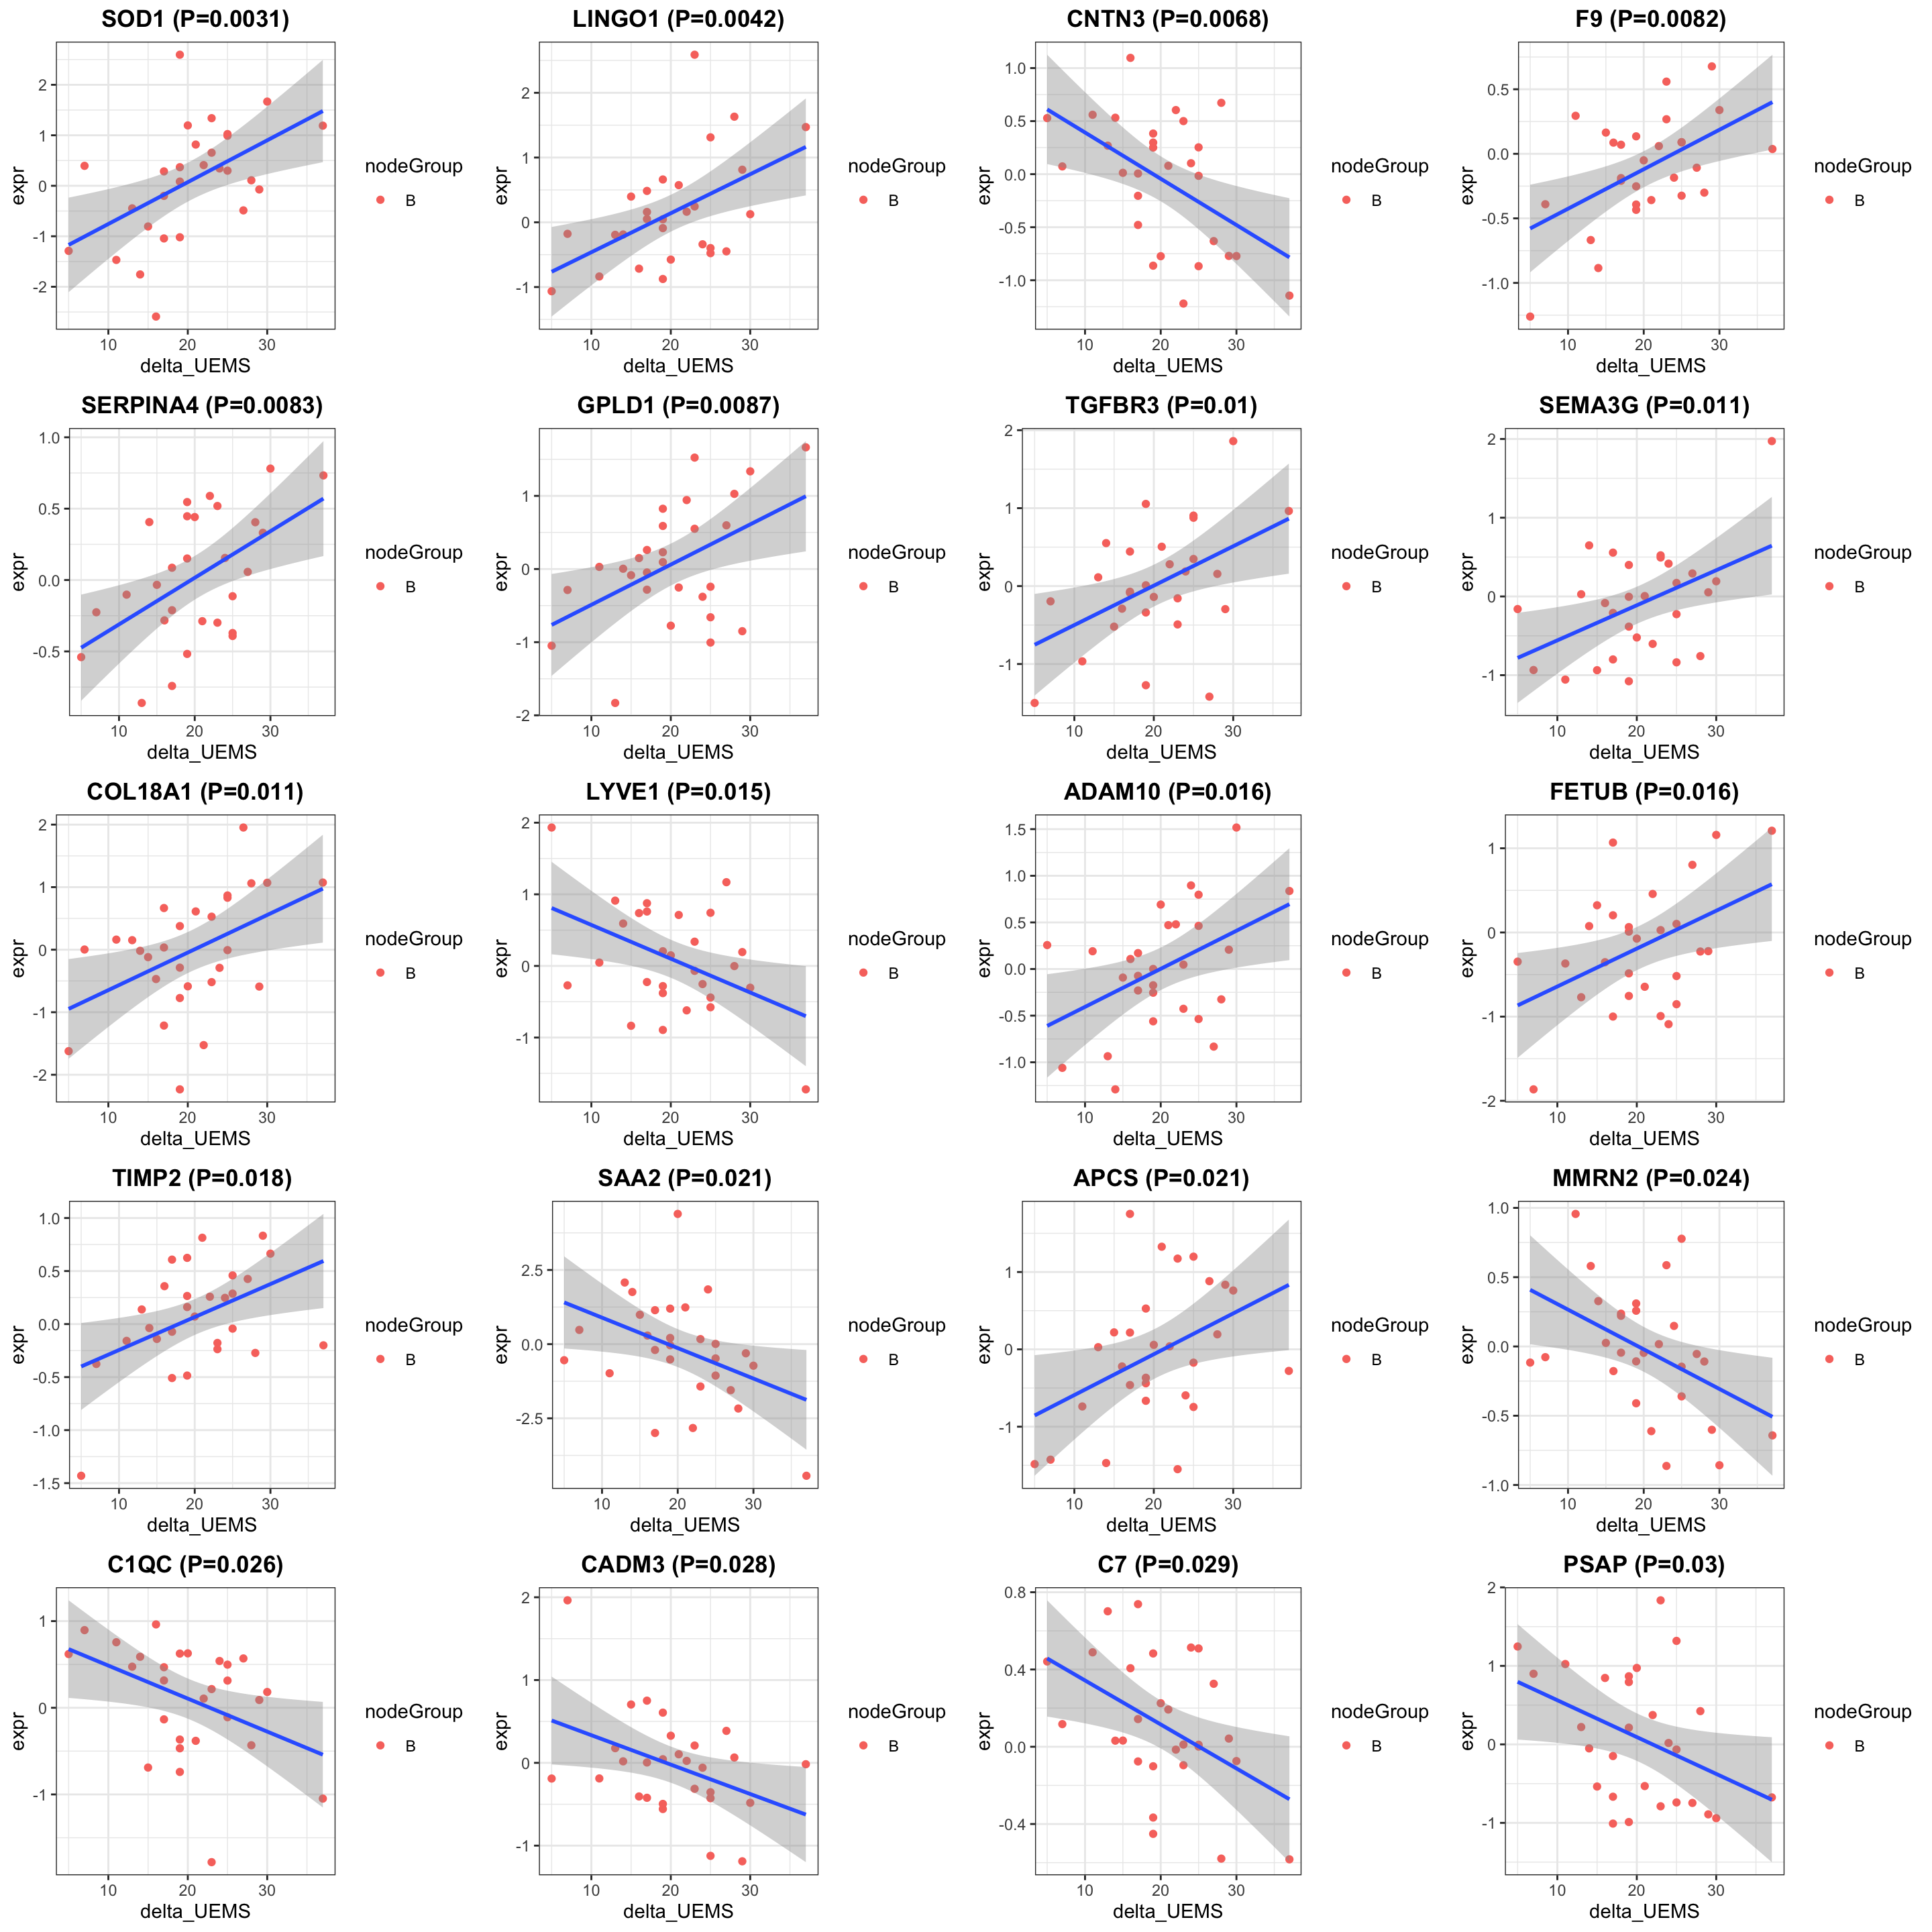
Enrichment analysis
gmts = list(GO_BiologicalProcess = "../data/gmts/c5.go.bp.v2023.2.Hs.symbols.gmt",
            GO_MolecularFunction = "../data/gmts/c5.go.mf.v2023.2.Hs.symbols.gmt")
plotList <- runGeneSetEnrichment(resTab, gmts, genePCut  = 1, pCutSet = 0.05, setFdr = FALSE, method = "gsea")
plotList$plot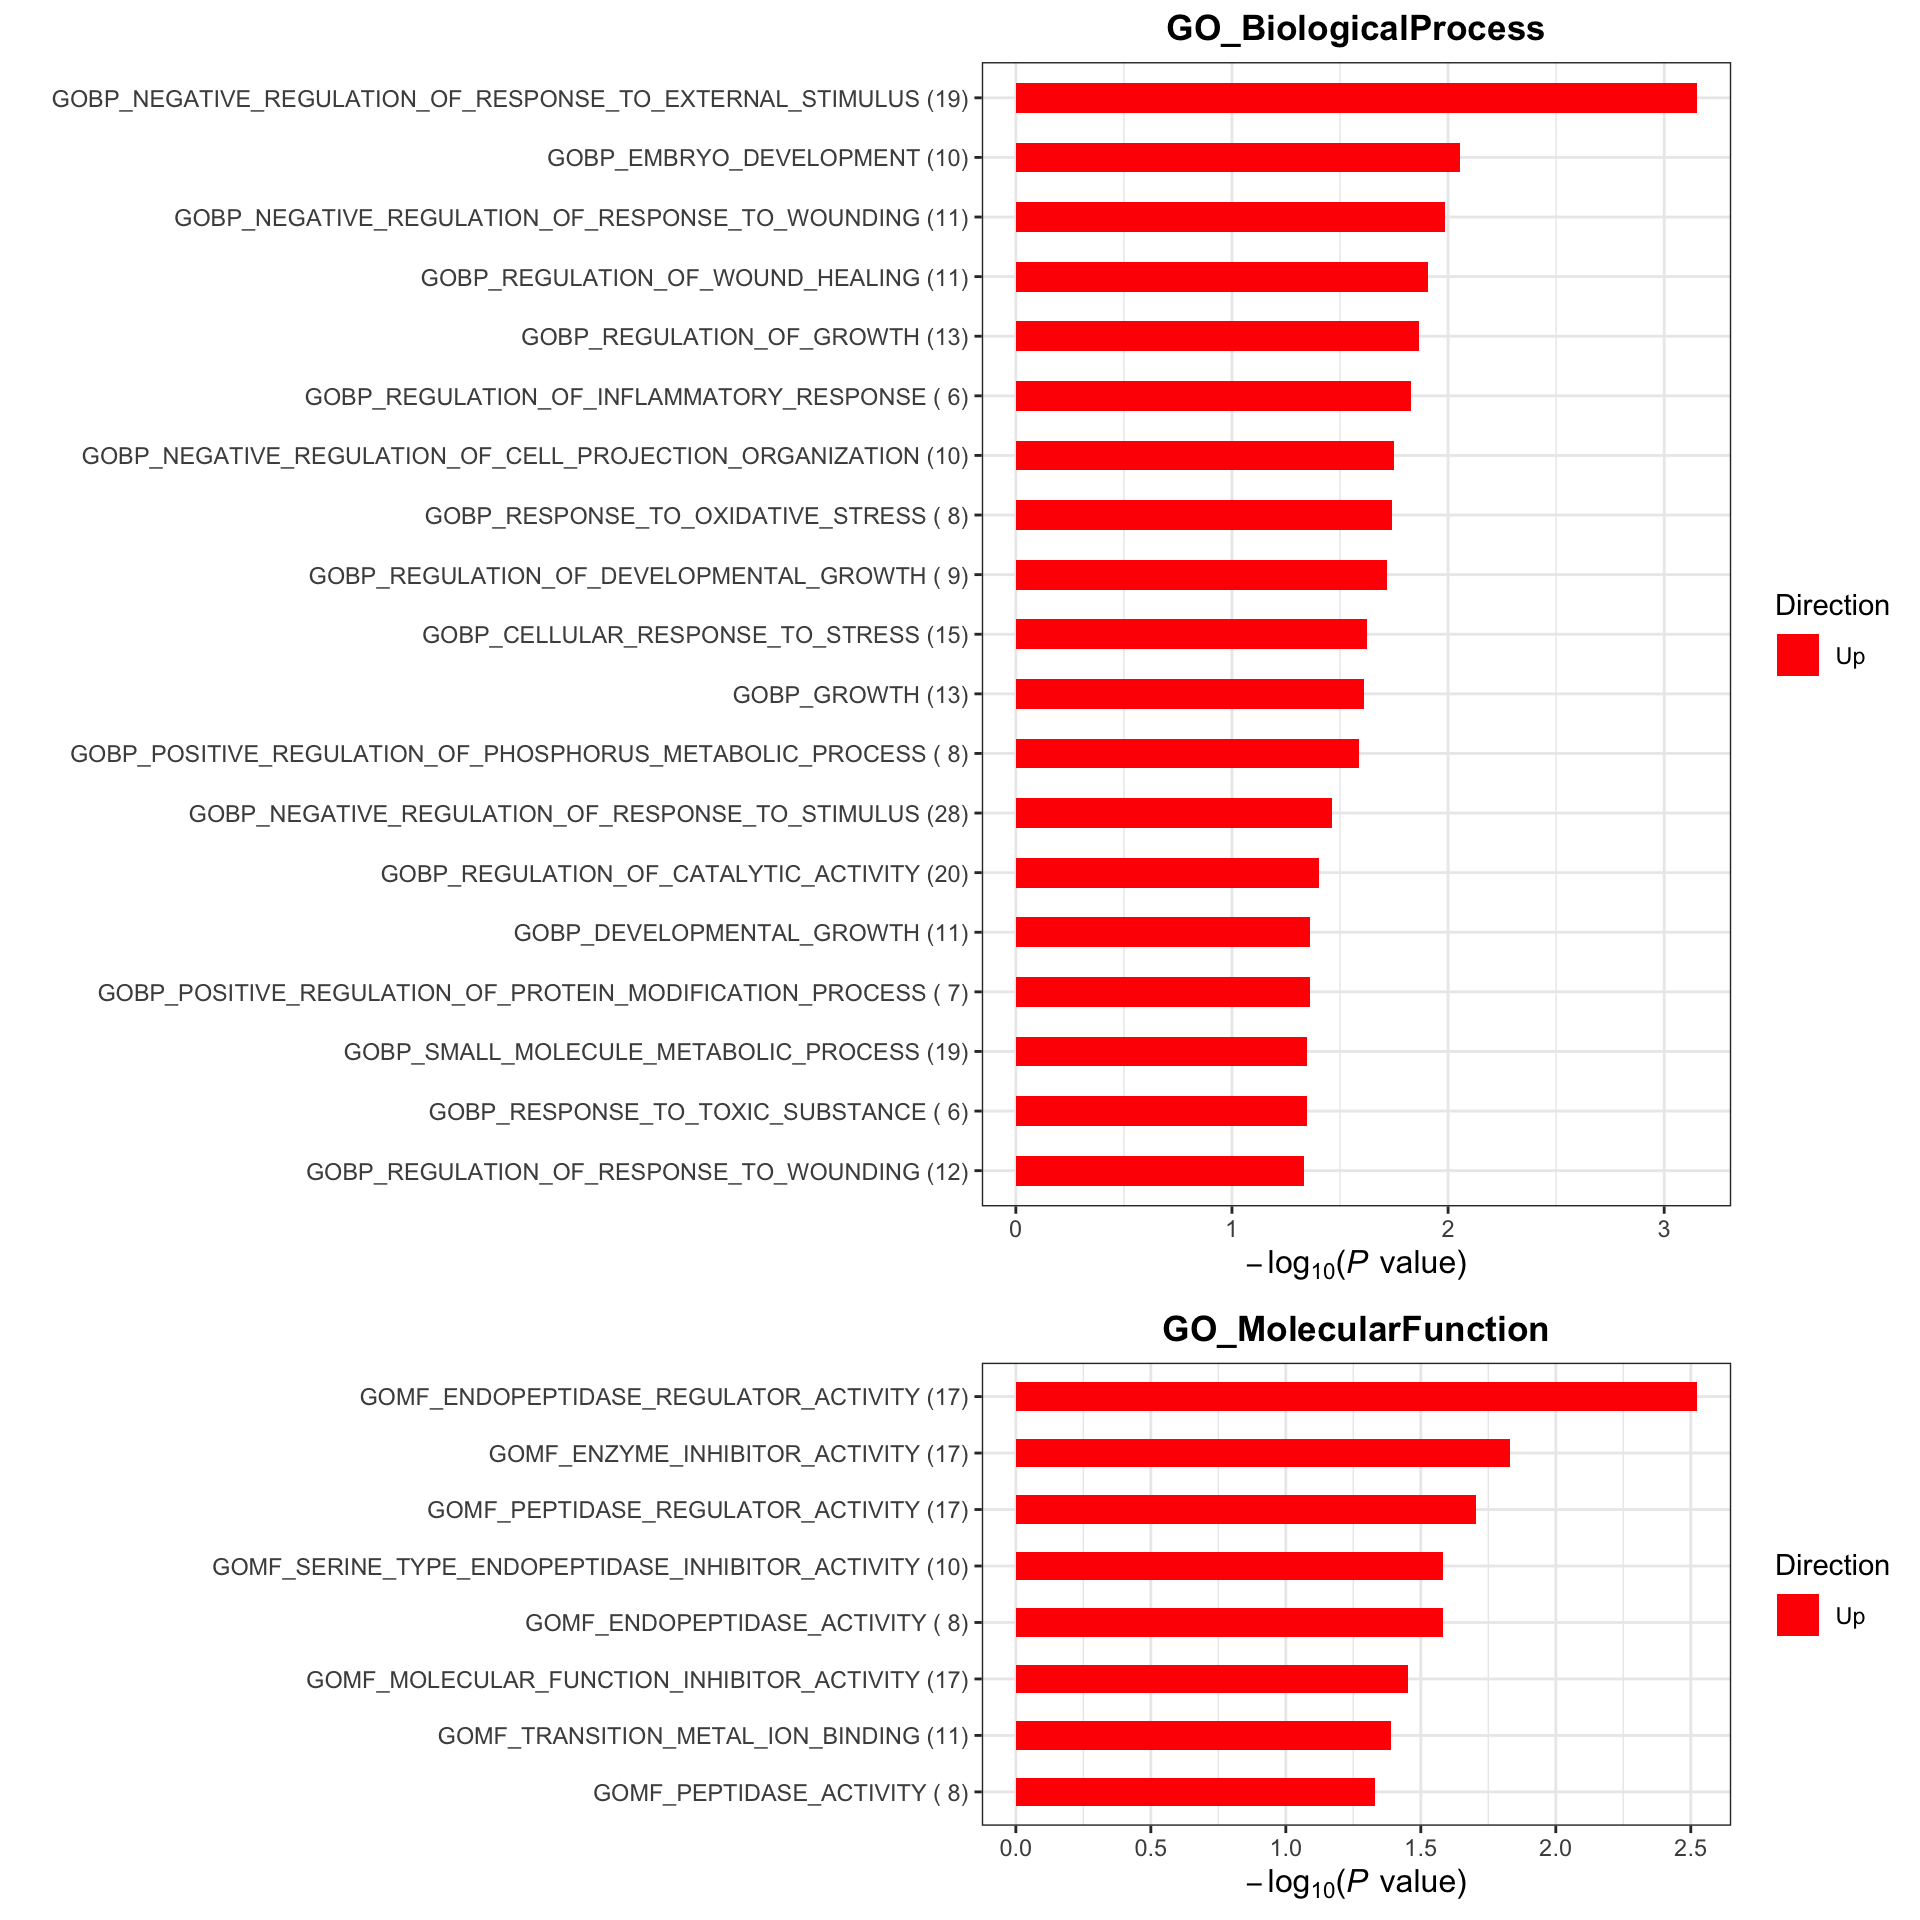
In untreated samples
Those proteins may predict natural recovery without drug
At baseline
Subsetting
#subset for patients in the placebo group
protSub <- prepareProt(seProt_corr, filterCondi = list(Treatment ="0", Visit = "3"), perNA = 0.5)
[1] "Number of proteins: 382, number of samples: 42"#protSub <- seProt_corr[,seProt_corr$Treatment %in% 1 & seProt_corr$Visit %in% 3 & !is.na(seProt_corr$delta_UEMS)]
print("How many proteins and samples")[1] "How many proteins and samples"dim(protSub)[1] 382 42Differential expression
design <- model.matrix(~ delta_UEMS, colData(protSub))

resTab <- testDiff(protSub, design, coef = "delta_UEMS", assayName = "imputed")

allResList[["corrOutcome_baseline_control"]] <- resTab
hist(resTab$pval)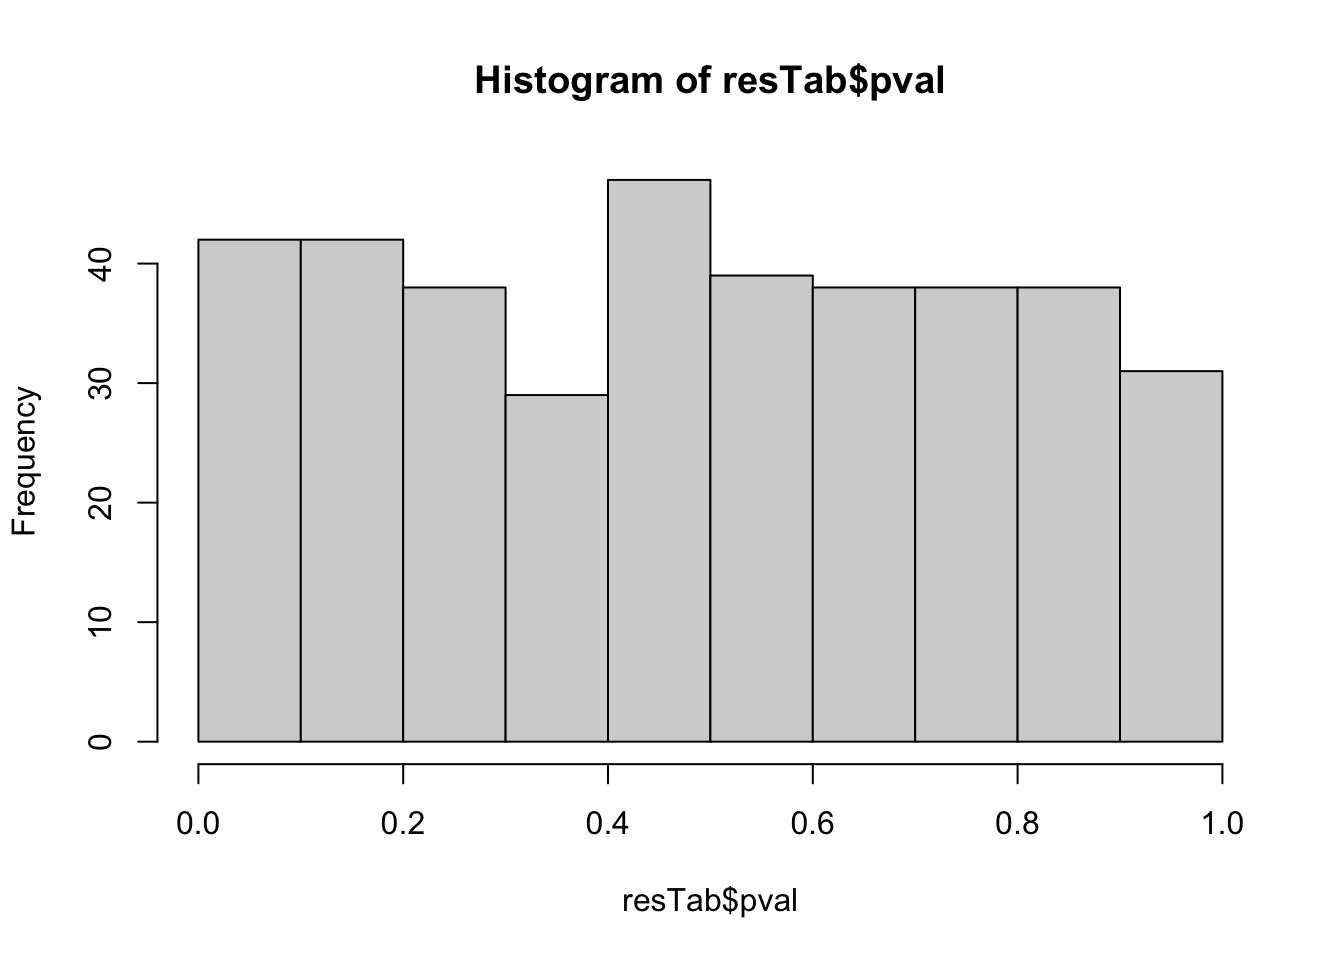
Table of proteins passed raw P-value < 0.05
filter(resTab, pval <= 0.05) %>% mutate(across(where(is.numeric), formatC, digits=2)) %>%
  select(name, symbol, pval, adj_pval, diff, n_obs) %>%
  DT::datatable()
Correlation plot
exprMat <- assays(protSub)[[2]]
pList <- lapply(seq(20), function(i) {
    rec <- resTab[i,]
    plotTab <- tibble(expr = exprMat[rec$name,],
                      nodeGroup = protSub$nodeGroup,
                      delta_UEMS = protSub$delta_UEMS)
    ggplot(plotTab, aes(x=delta_UEMS, y=expr)) +
        geom_point(aes(col = nodeGroup)) +
        ggtitle(sprintf("%s (P=%s)",rec$symbol,formatC(rec$pval, digits = 2))) +
        #scale_color_gradient(low="green",high="red") +
        geom_smooth(method = "lm") +
        theme_bw() +
        theme(plot.title = element_text(hjust = 0.5, face = "bold"))
})

cowplot::plot_grid(plotlist = pList, ncol=4)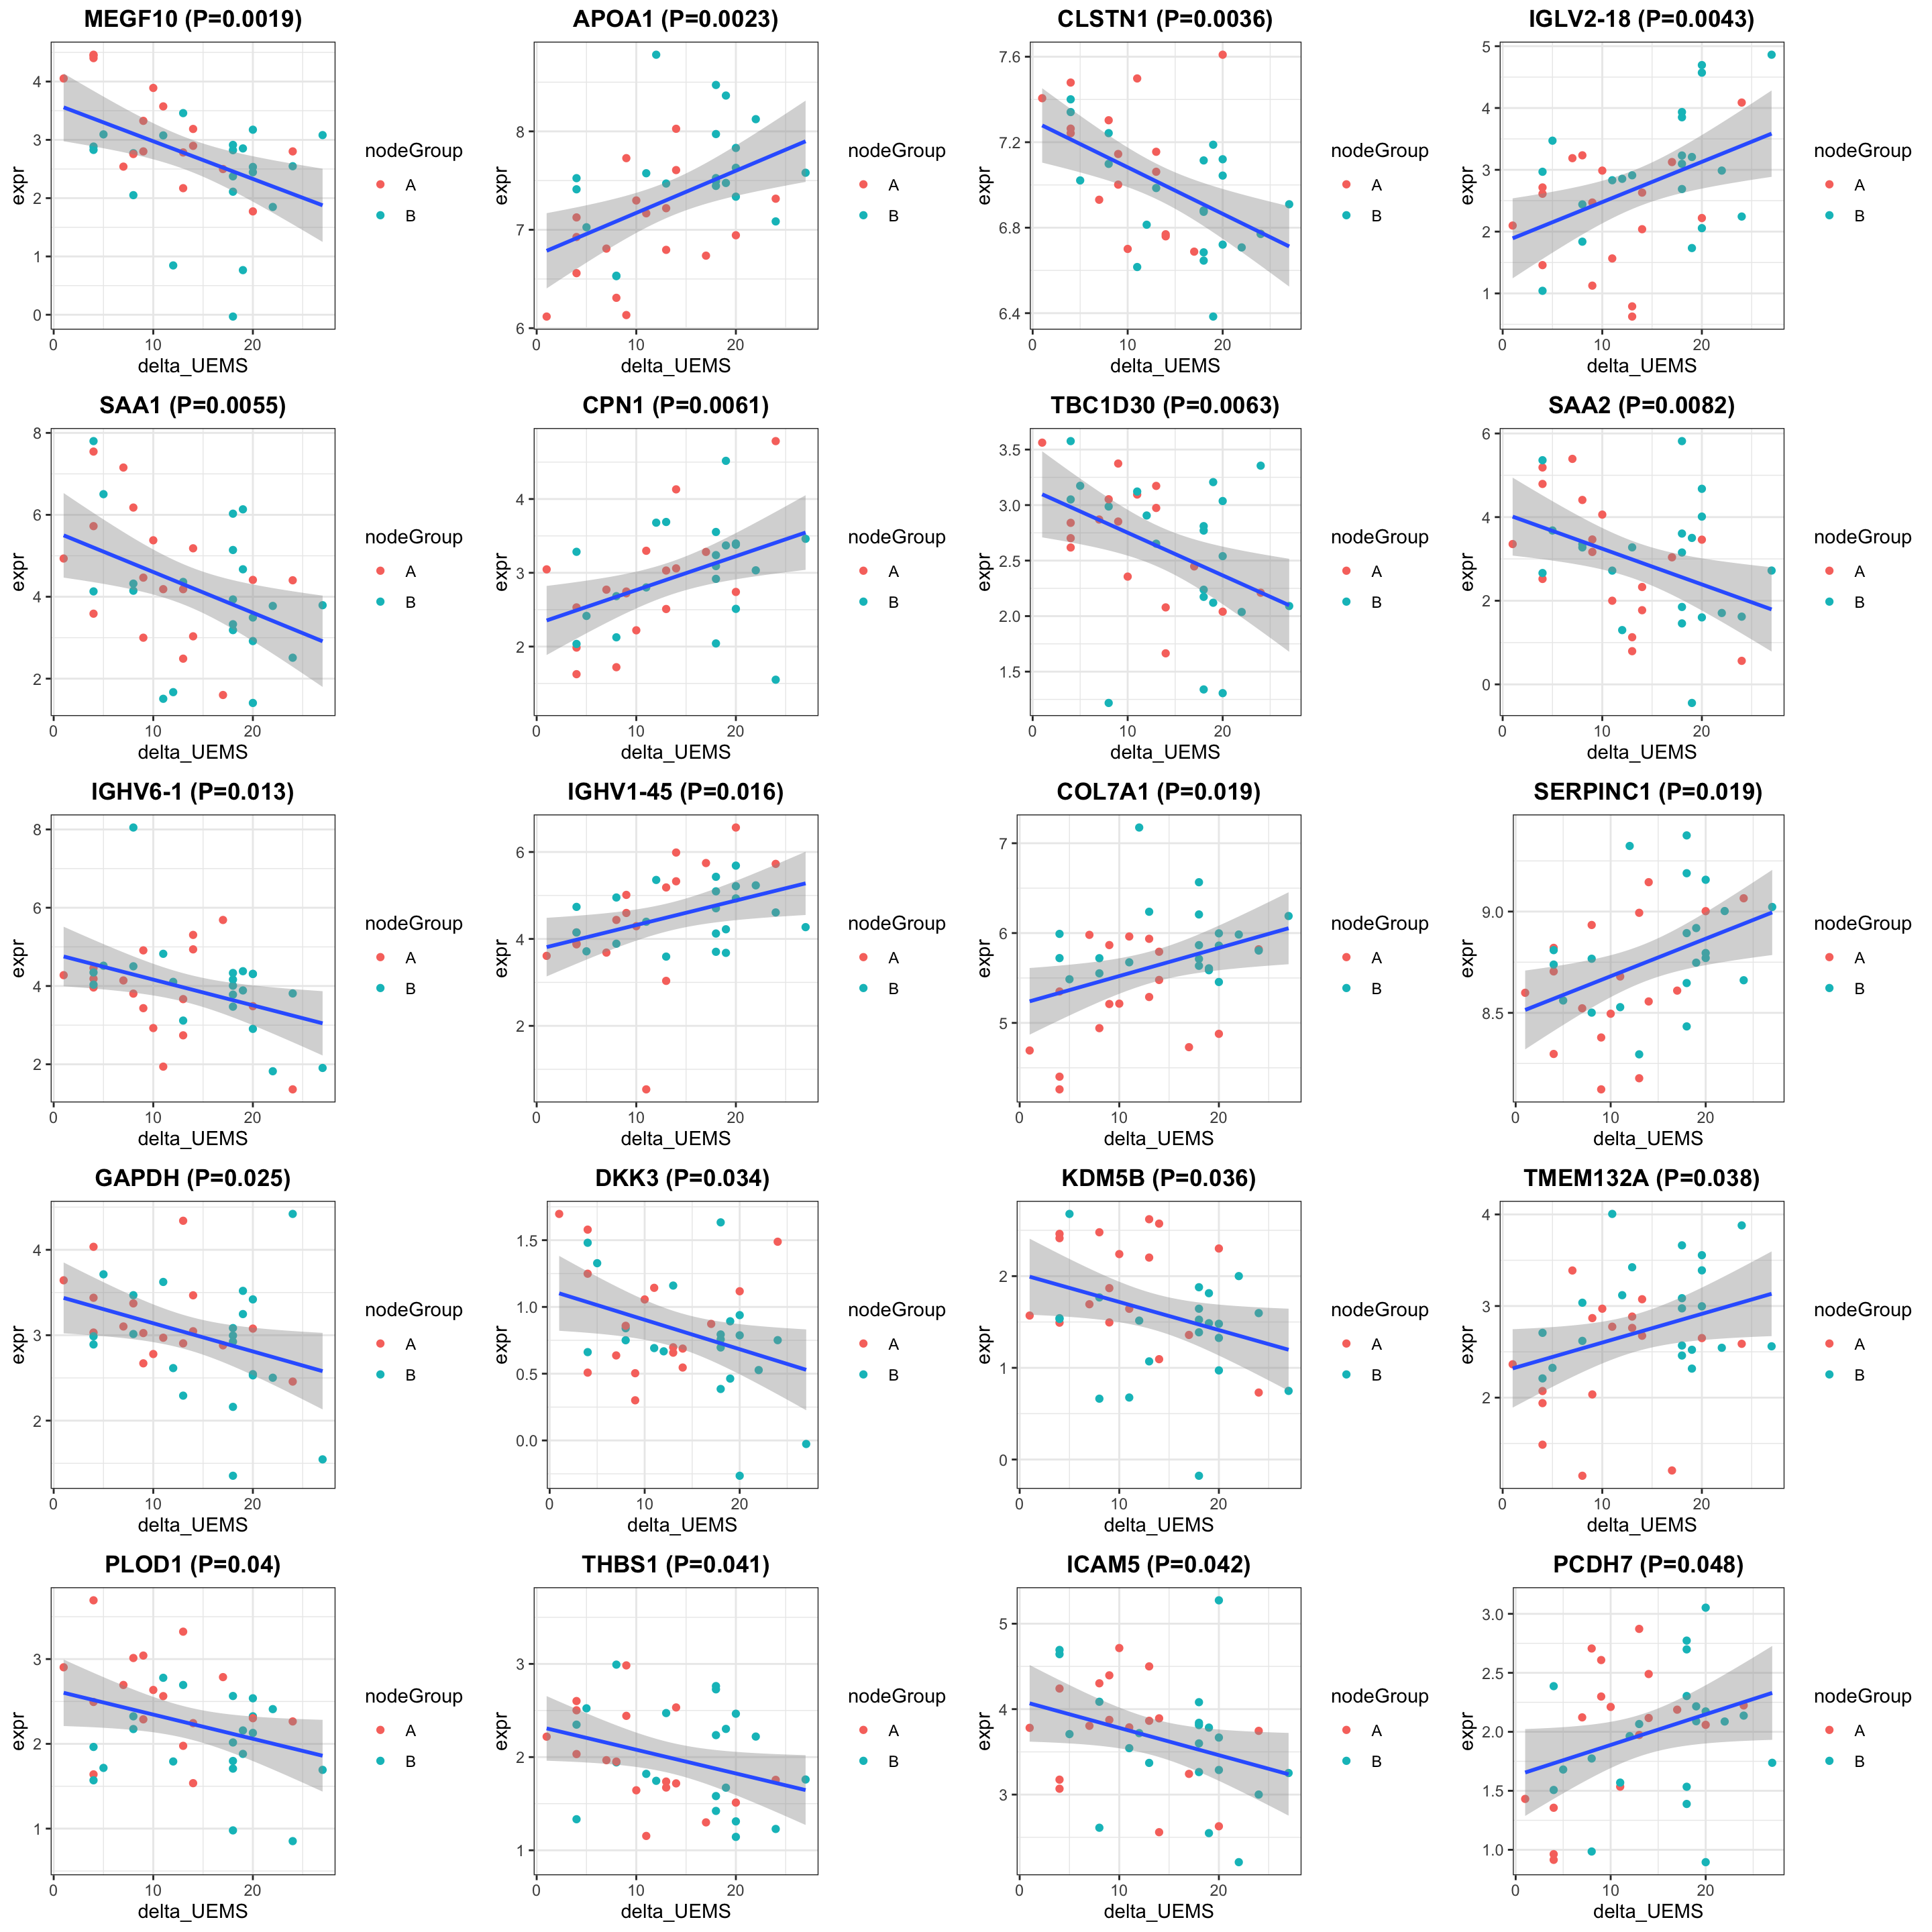
Enrichment analysis
gmts = list(GO_BiologicalProcess = "../data/gmts/c5.go.bp.v2023.2.Hs.symbols.gmt",
            GO_MolecularFunction = "../data/gmts/c5.go.mf.v2023.2.Hs.symbols.gmt")
plotList <- runGeneSetEnrichment(resTab, gmts, genePCut  = 1, pCutSet = 0.05, setFdr = FALSE, method = "gsea")
plotList$plot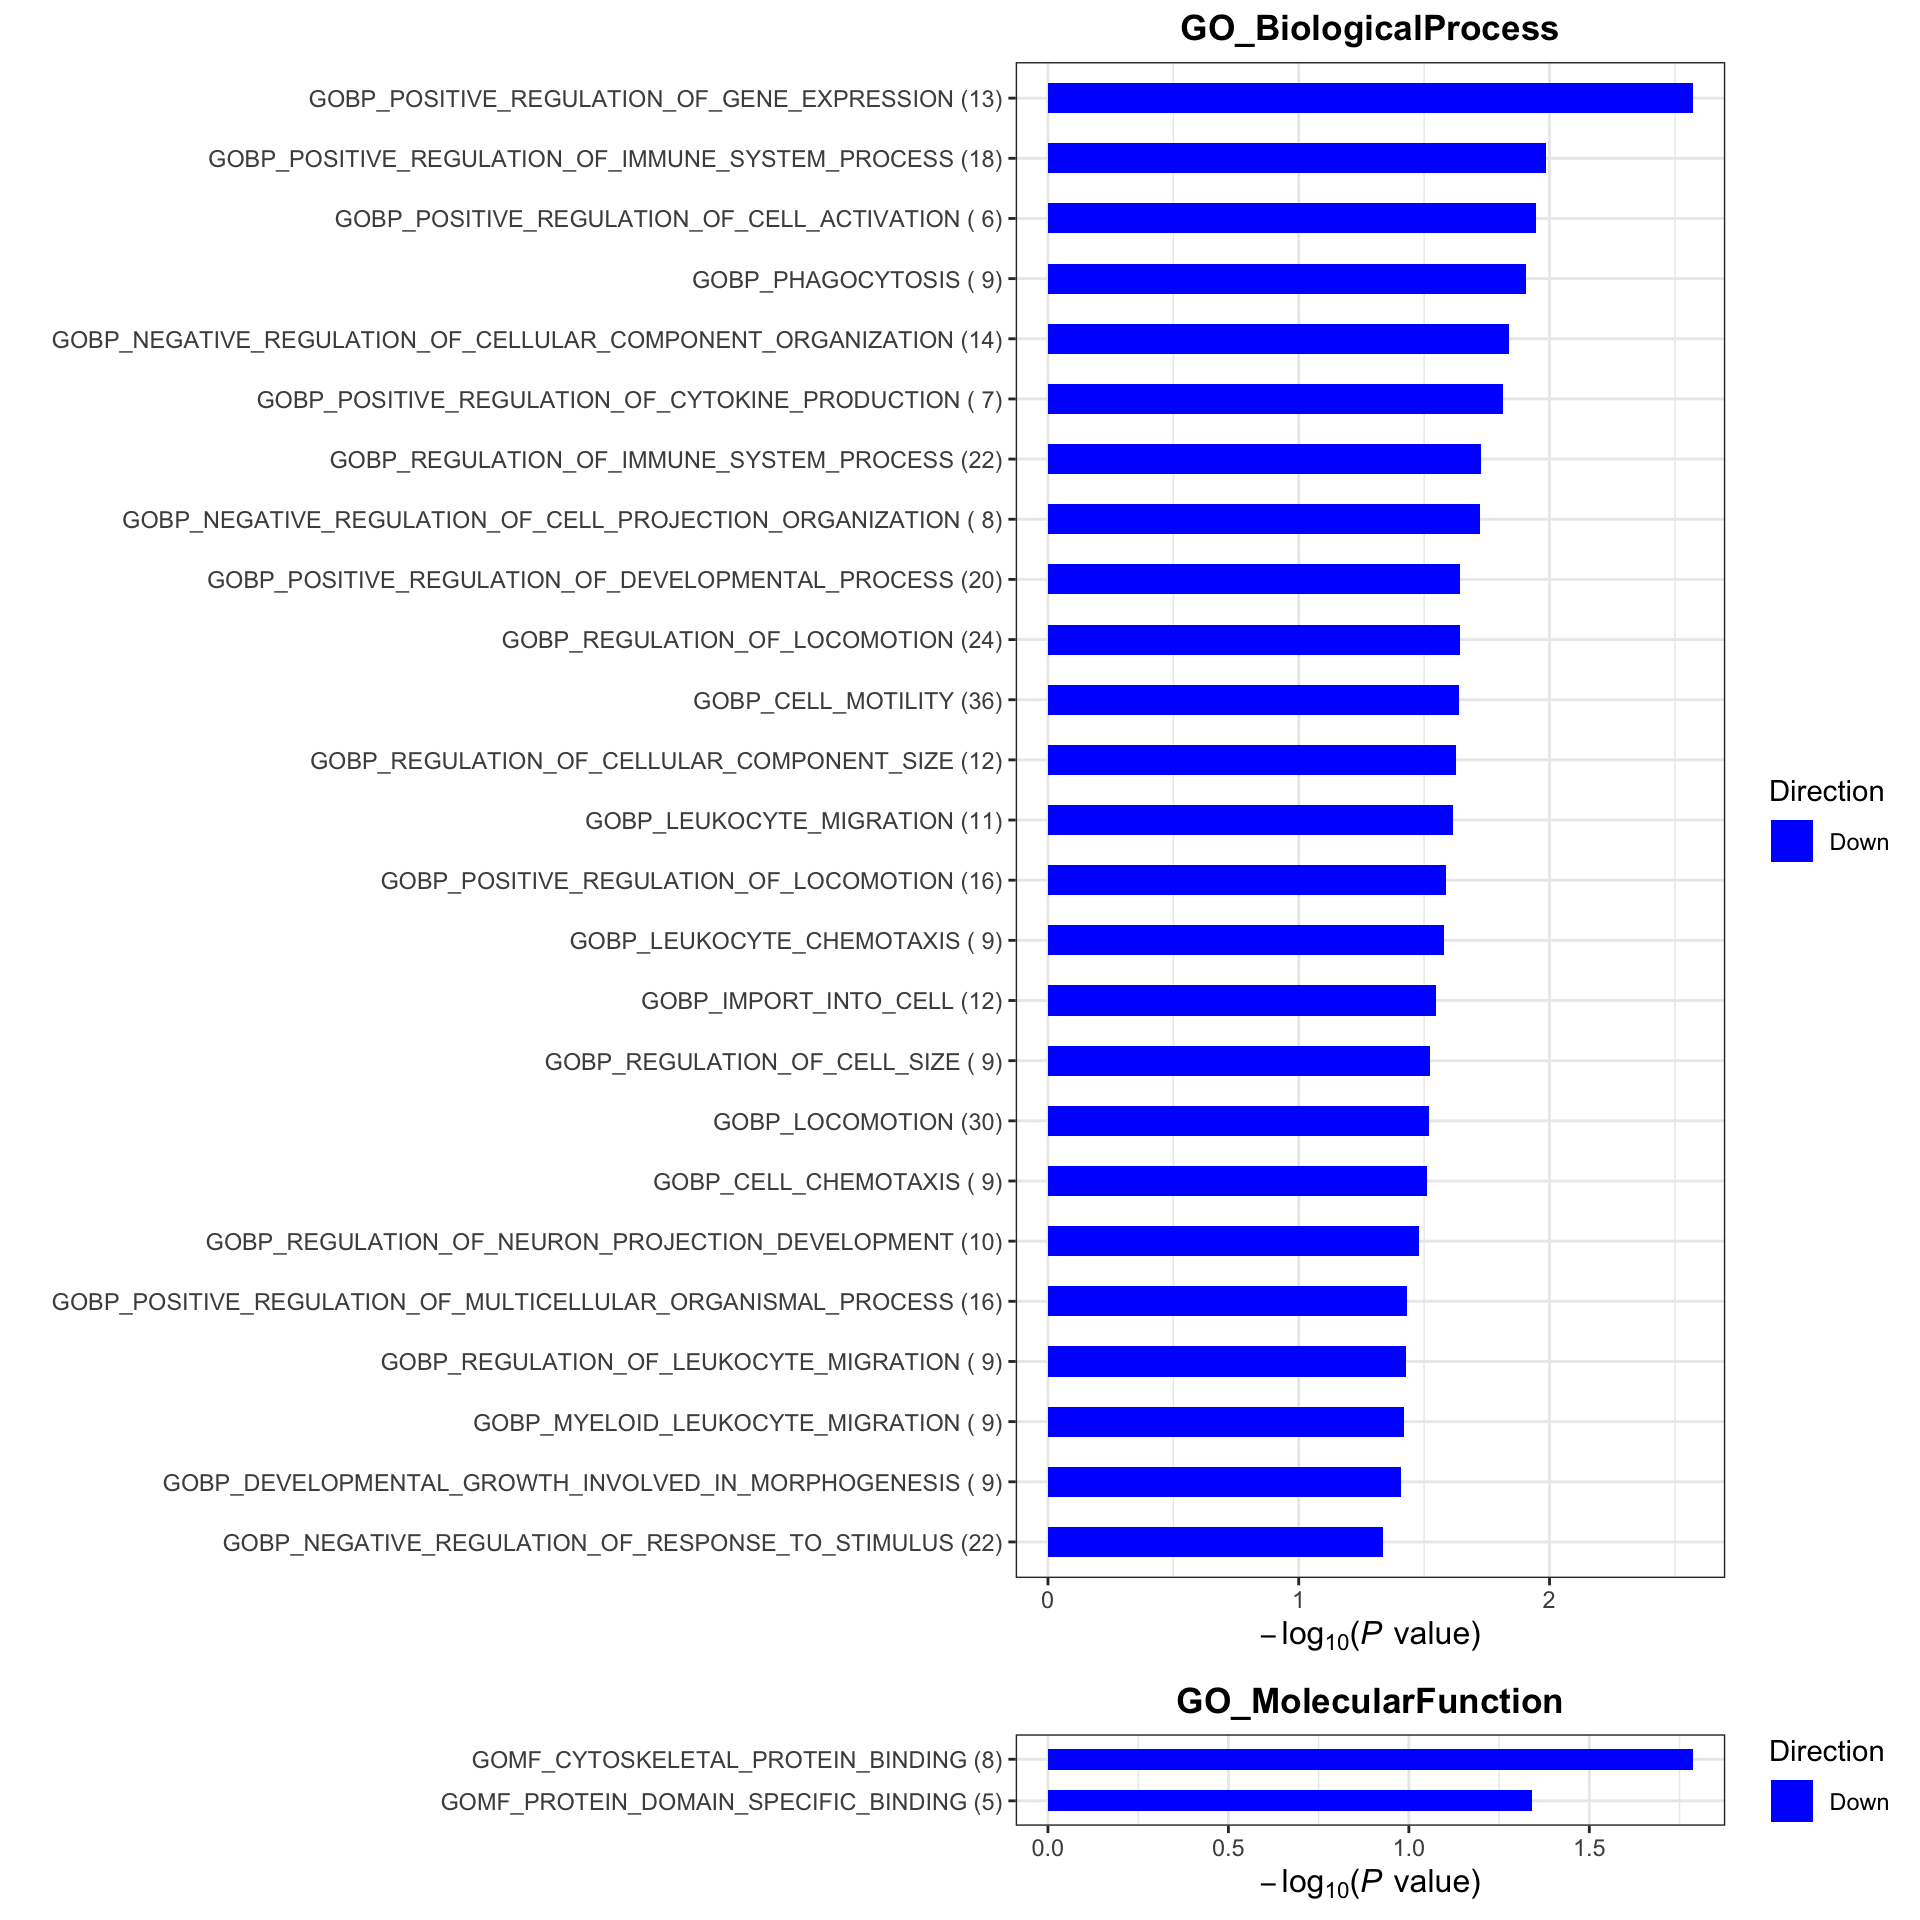
At visit 8
Subsetting
#subset for patients in the placebo group
protSub <- prepareProt(seProt_corr, filterCondi = list(Treatment ="0", Visit = "8"), perNA = 0.5)
[1] "Number of proteins: 377, number of samples: 41"#protSub <- seProt_corr[,seProt_corr$Treatment %in% 1 & seProt_corr$Visit %in% 3 & !is.na(seProt_corr$delta_UEMS)]
print("How many proteins and samples")[1] "How many proteins and samples"dim(protSub)[1] 377 41Differential expression
design <- model.matrix(~ delta_UEMS, colData(protSub))

resTab <- testDiff(protSub, design, coef = "delta_UEMS", assayName = "imputed")

allResList[["corrOutcome_visit8_control"]] <- resTab
hist(resTab$pval)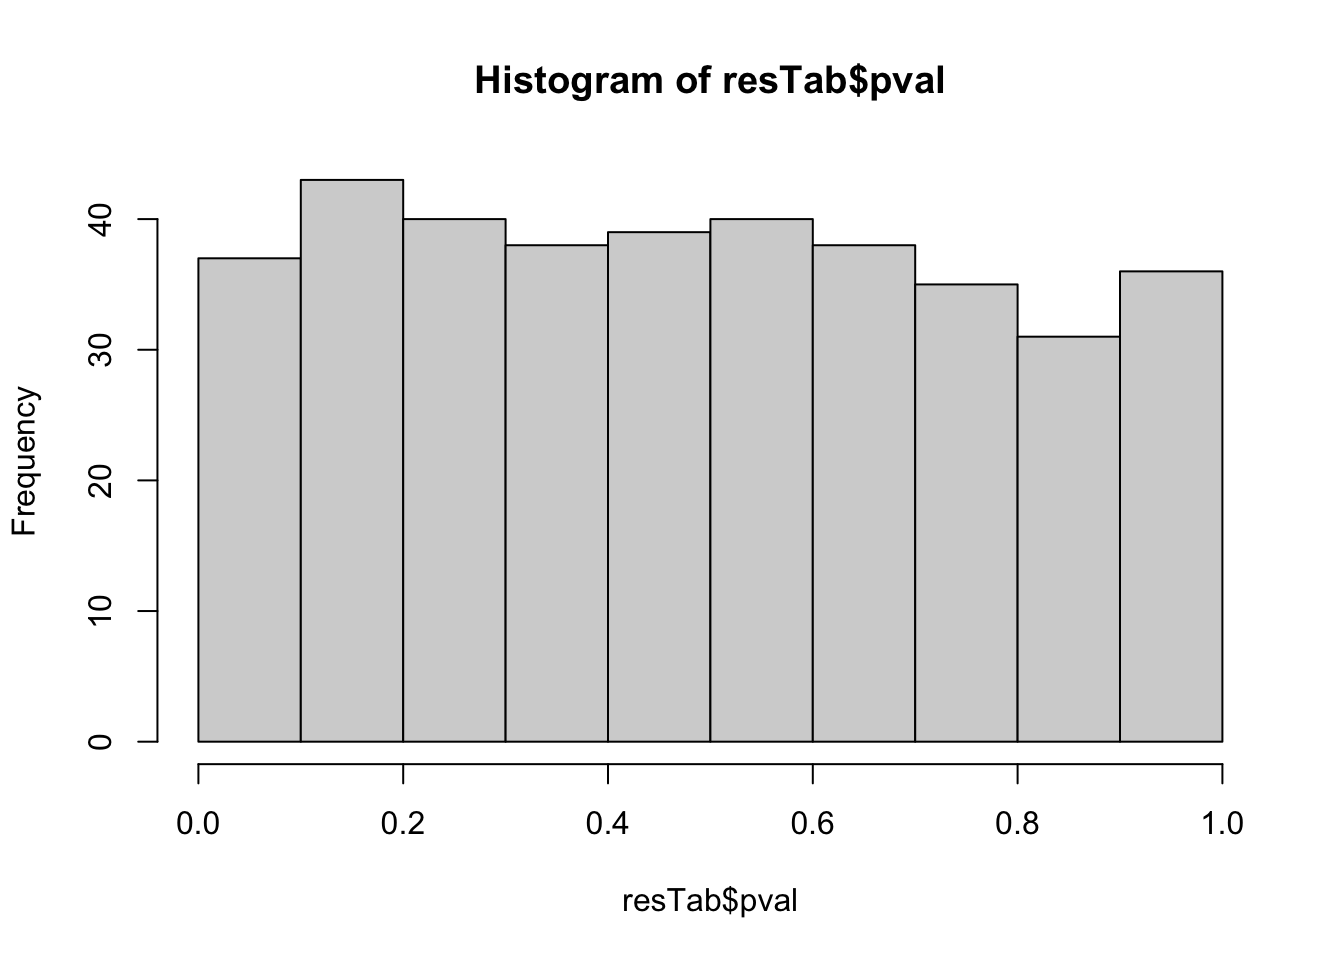
Table of proteins passed raw P-value < 0.05
filter(resTab, pval <= 0.05) %>% mutate(across(where(is.numeric), formatC, digits=2)) %>%
  select(name, symbol, pval, adj_pval, diff, n_obs) %>%
  DT::datatable()
Correlation plot
exprMat <- assay(protSub)
pList <- lapply(seq(20), function(i) {
    rec <- resTab[i,]
    plotTab <- tibble(expr = exprMat[rec$name,],
                      nodeGroup = protSub$nodeGroup,
                      delta_UEMS = protSub$delta_UEMS)
    ggplot(plotTab, aes(x=delta_UEMS, y=expr)) +
        geom_point(aes(col = nodeGroup)) +
        ggtitle(sprintf("%s (P=%s)",rec$symbol,formatC(rec$pval, digits = 2))) +
        #scale_color_gradient(low="green",high="red") +
        geom_smooth(method = "lm") +
        theme_bw() +
        theme(plot.title = element_text(hjust = 0.5, face = "bold"))
})

cowplot::plot_grid(plotlist = pList, ncol=4)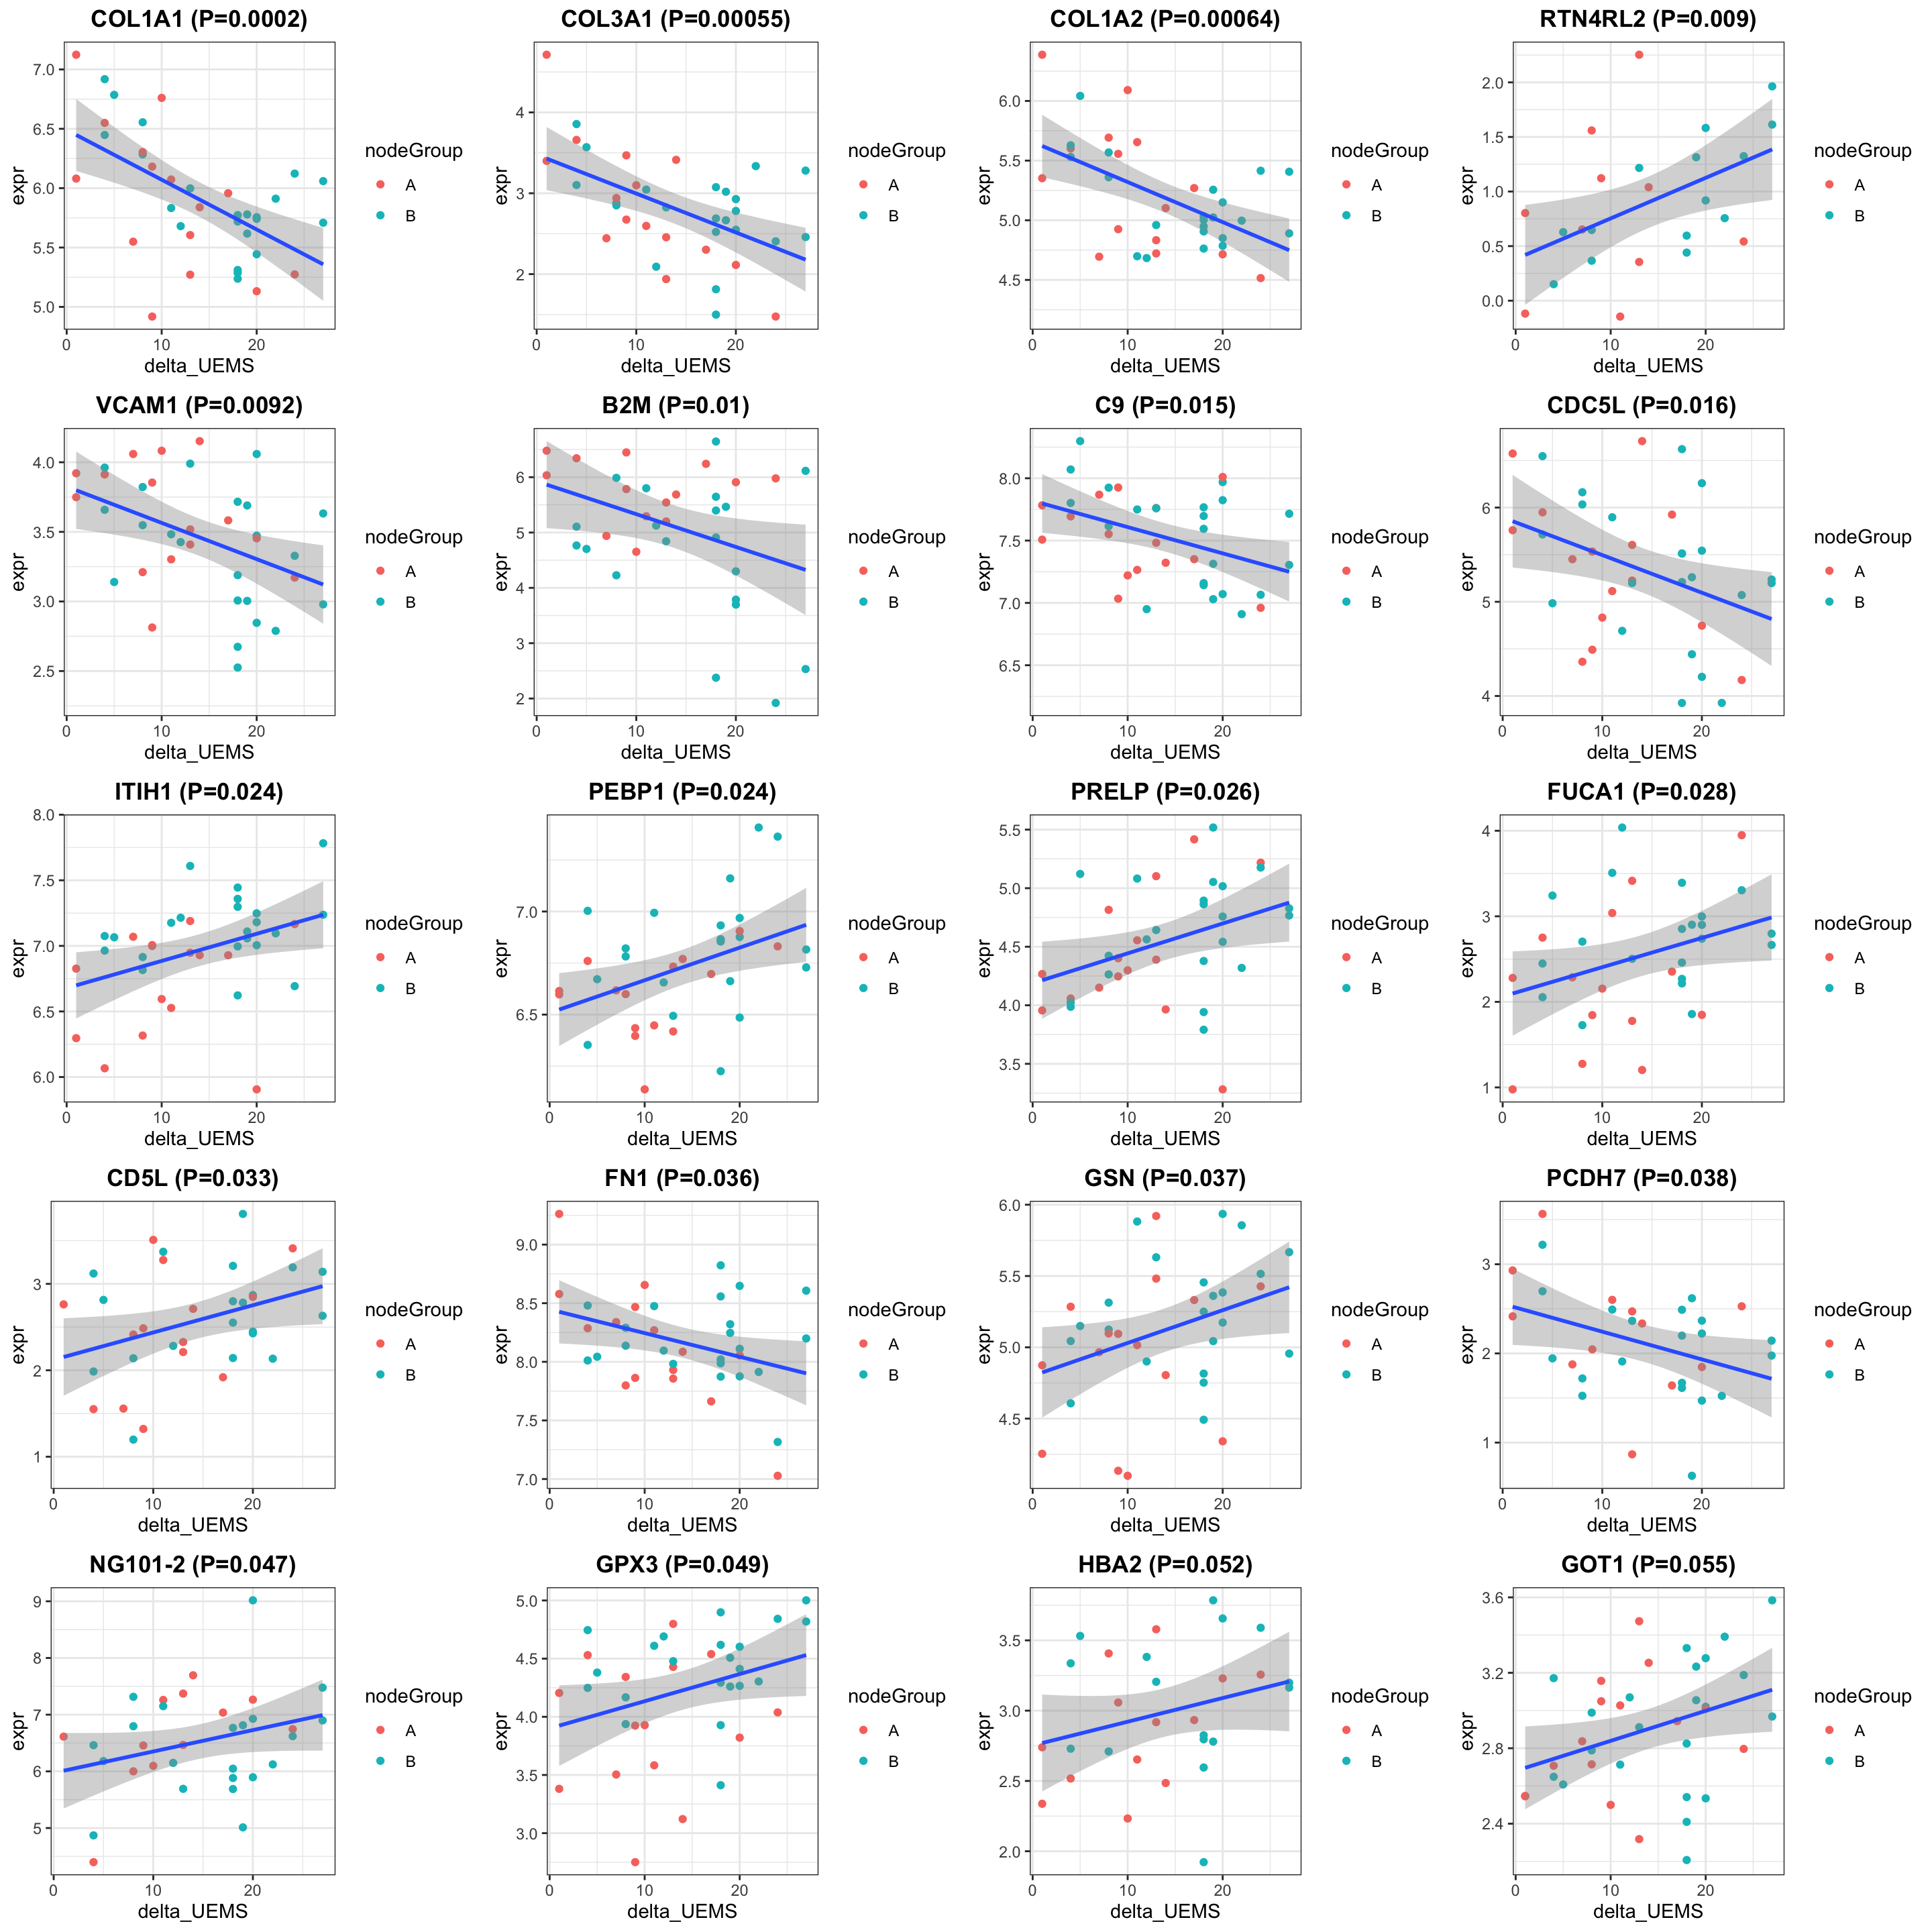
Enrichment analysis
gmts = list(GO_BiologicalProcess = "../data/gmts/c5.go.bp.v2023.2.Hs.symbols.gmt",
            GO_MolecularFunction = "../data/gmts/c5.go.mf.v2023.2.Hs.symbols.gmt")
plotList <- runGeneSetEnrichment(resTab, gmts, genePCut  = 1, pCutSet = 0.05, setFdr = FALSE, method = "gsea")
plotList$plot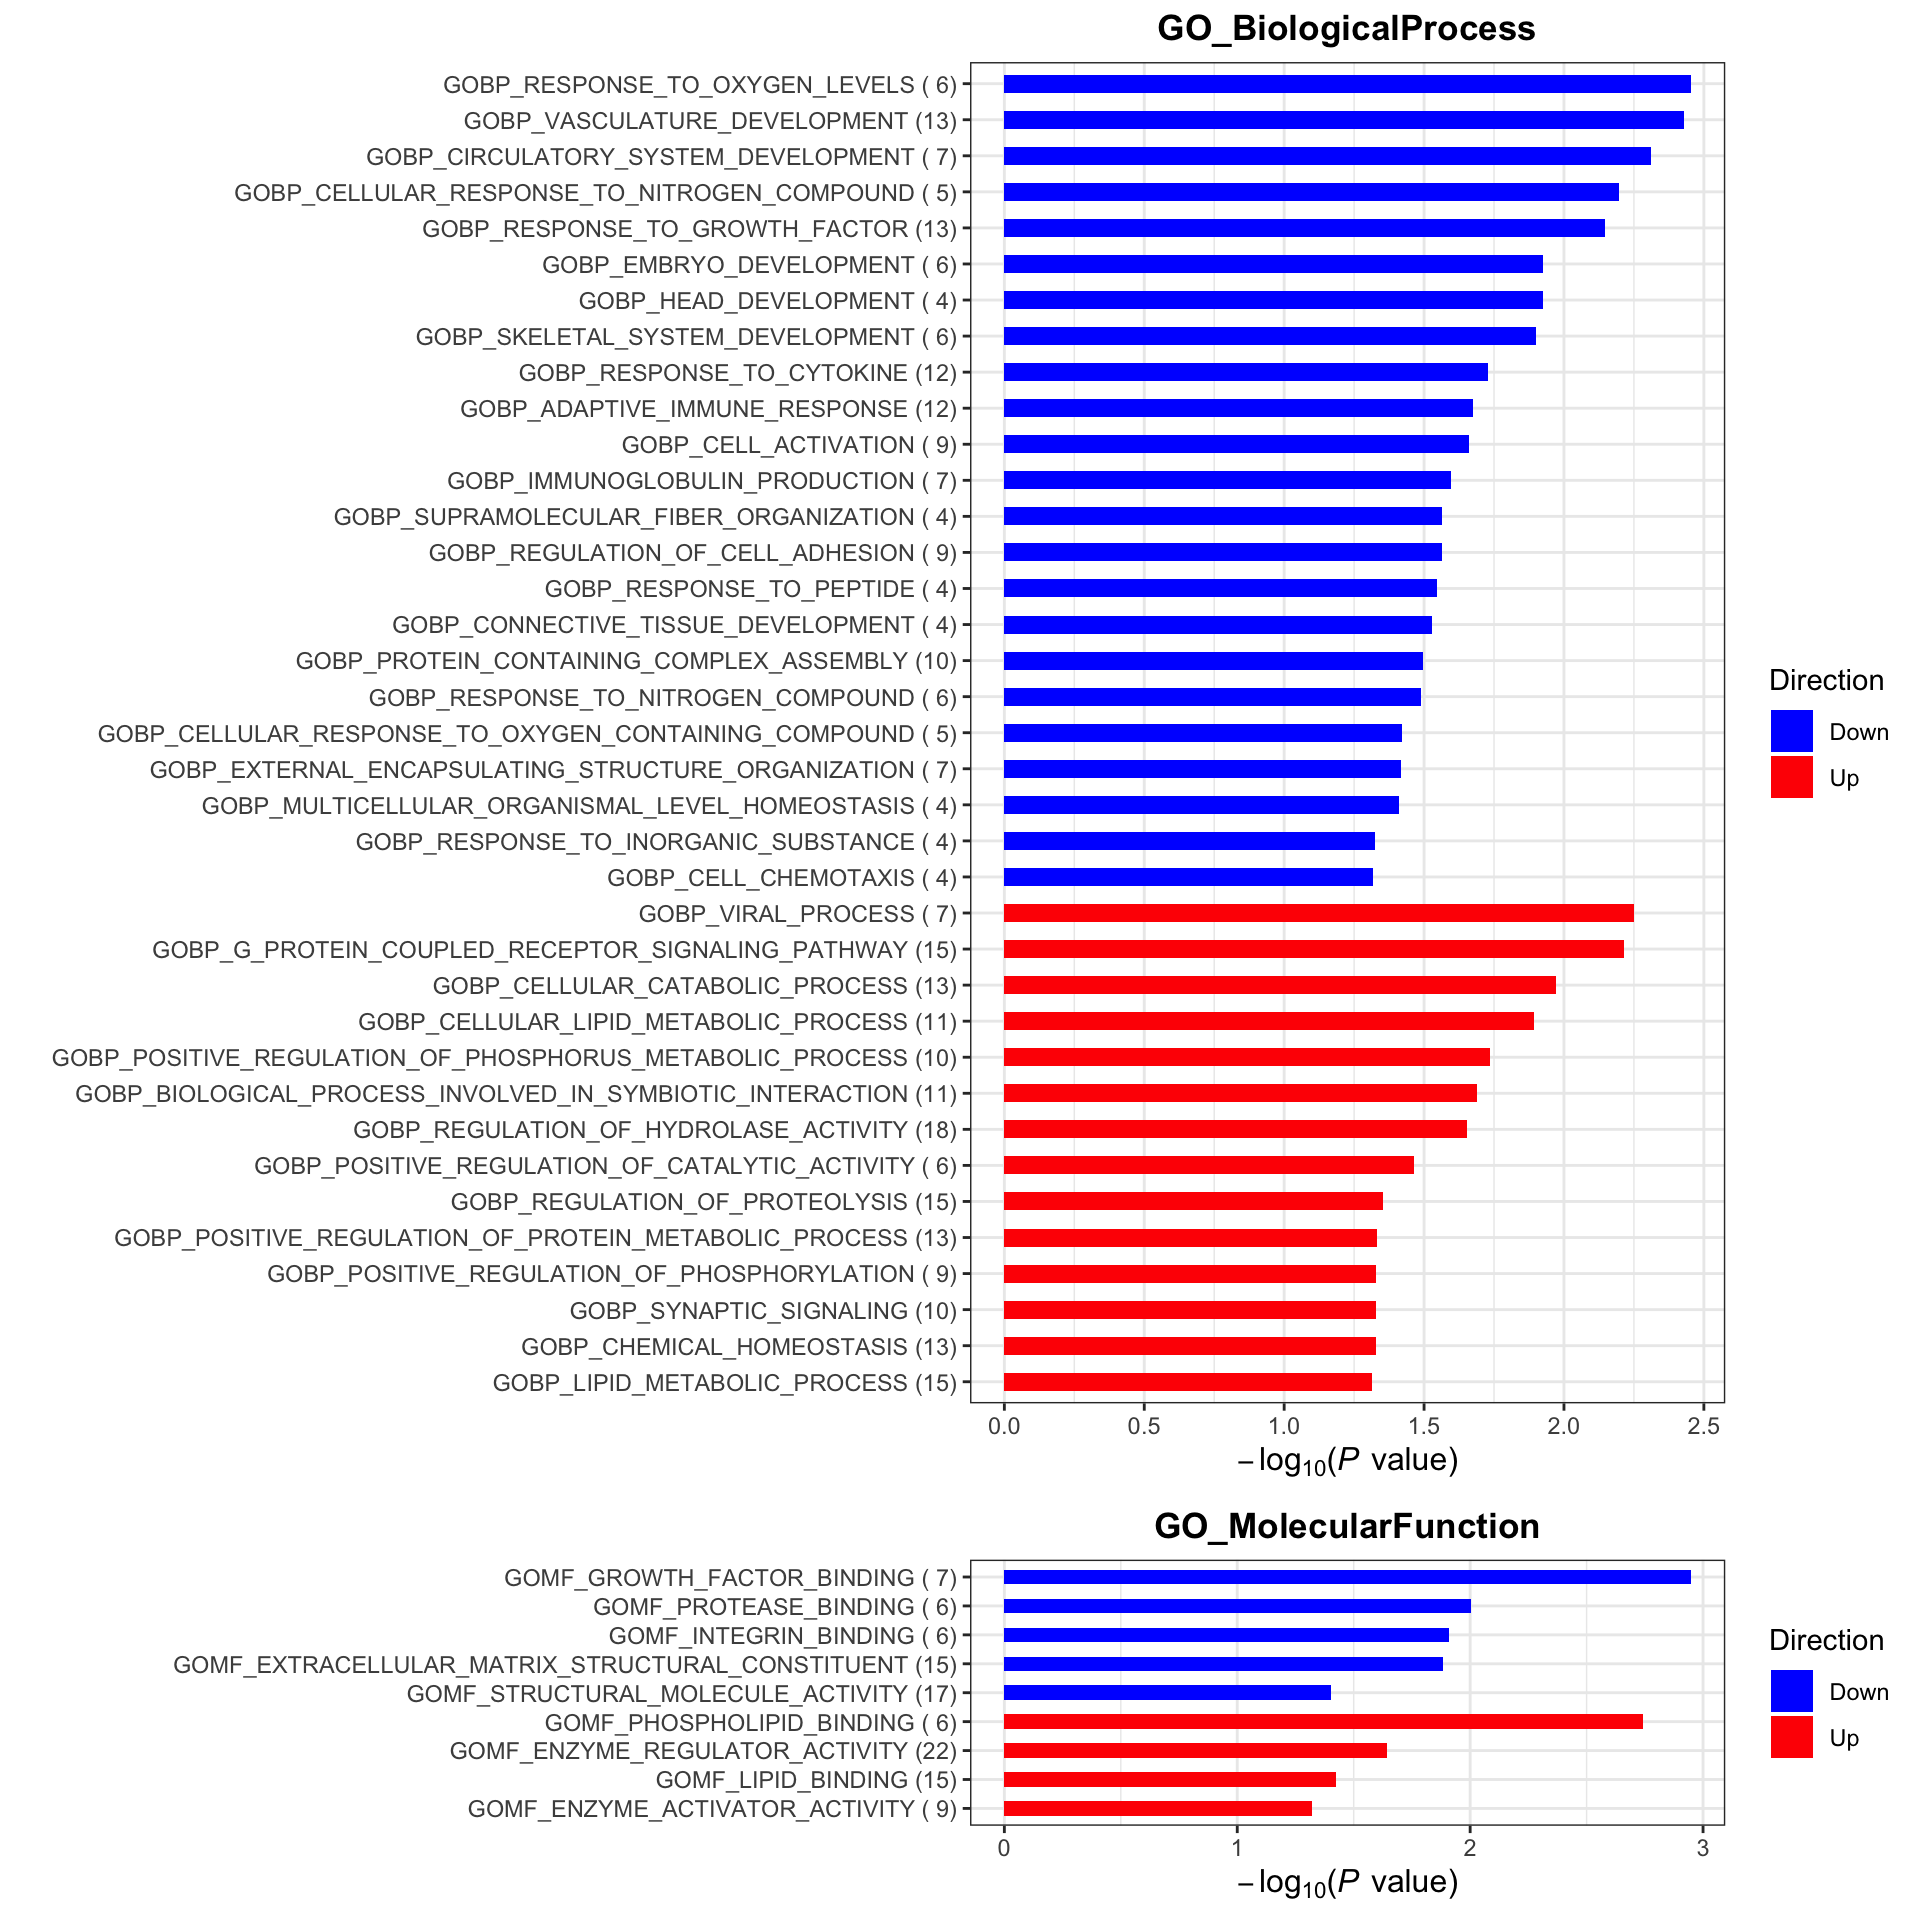
At endpoint (visit 10)
Subsetting
#subset for patients in the placebo group
protSub <- prepareProt(seProt_corr, filterCondi = list(Treatment ="0", Visit = "10"), perNA = 0.5)
[1] "Number of proteins: 376, number of samples: 33"#protSub <- seProt_corr[,seProt_corr$Treatment %in% 1 & seProt_corr$Visit %in% 3 & !is.na(seProt_corr$delta_UEMS)]
print("How many proteins and samples")[1] "How many proteins and samples"dim(protSub)[1] 376 33Differential expression
design <- model.matrix(~ delta_UEMS, colData(protSub))

resTab <- testDiff(protSub, design, coef = "delta_UEMS", assayName = "imputed")

allResList[["corrOutcome_visit10_control"]] <- resTab
hist(resTab$pval)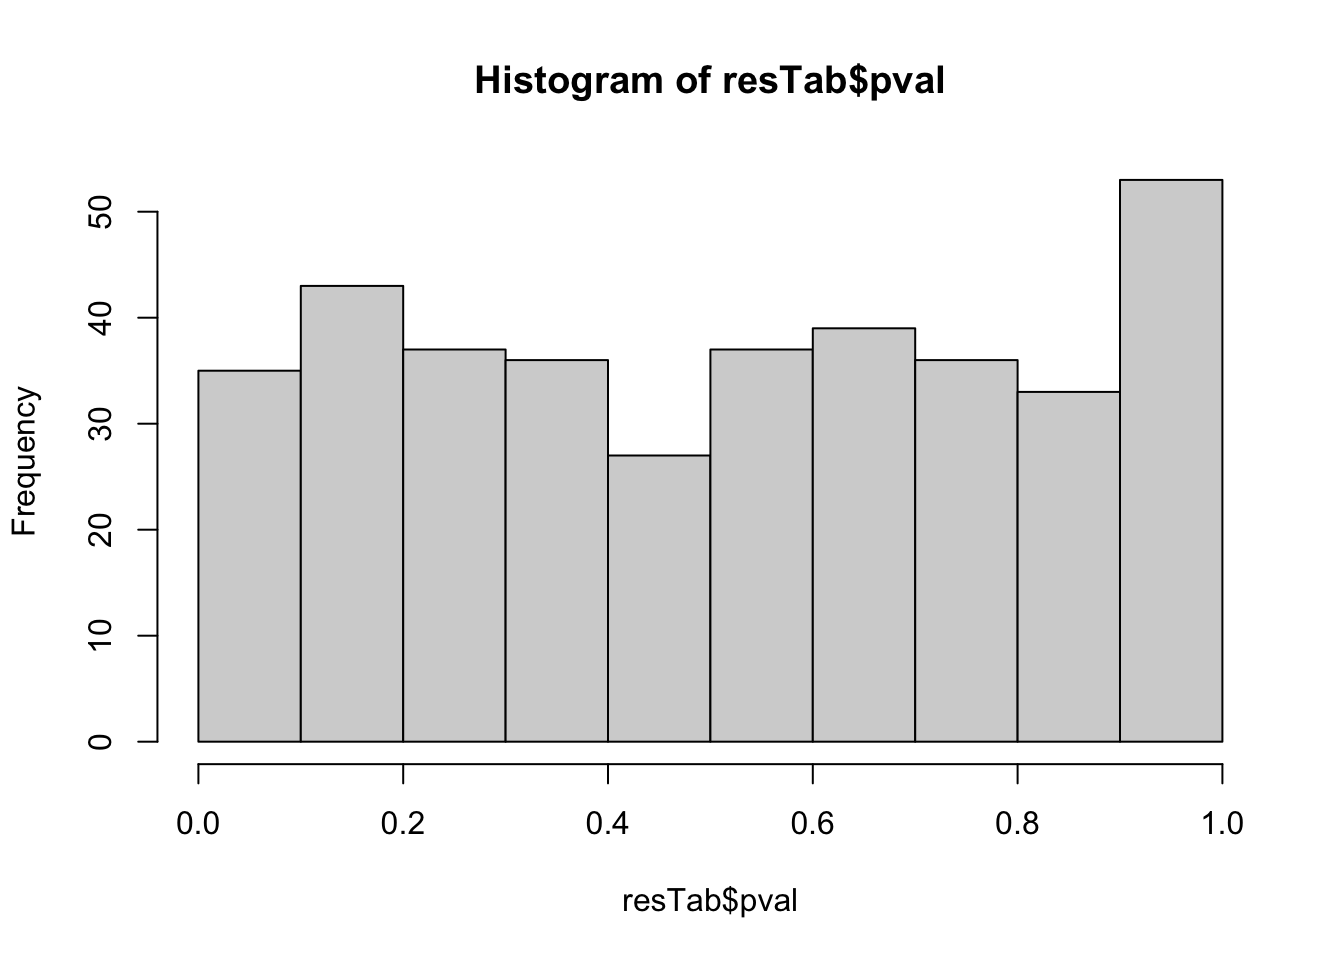
Table of proteins passed raw P-value < 0.05
filter(resTab, pval <= 0.05) %>% mutate(across(where(is.numeric), formatC, digits=2)) %>%
  select(name, symbol, pval, adj_pval, diff, n_obs) %>%
  DT::datatable()
Correlation plot
exprMat <- assays(protSub)[[2]]
pList <- lapply(seq(20), function(i) {
    rec <- resTab[i,]
    plotTab <- tibble(expr = exprMat[rec$name,],
                      nodeGroup = protSub$nodeGroup,
                      delta_UEMS = protSub$delta_UEMS)
    ggplot(plotTab, aes(x=delta_UEMS, y=expr)) +
        geom_point(aes(col = nodeGroup)) +
        ggtitle(sprintf("%s (P=%s)",rec$symbol,formatC(rec$pval, digits = 2))) +
        #scale_color_gradient(low="green",high="red") +
        geom_smooth(method = "lm") +
        theme_bw() +
        theme(plot.title = element_text(hjust = 0.5, face = "bold"))
})

cowplot::plot_grid(plotlist = pList, ncol=4)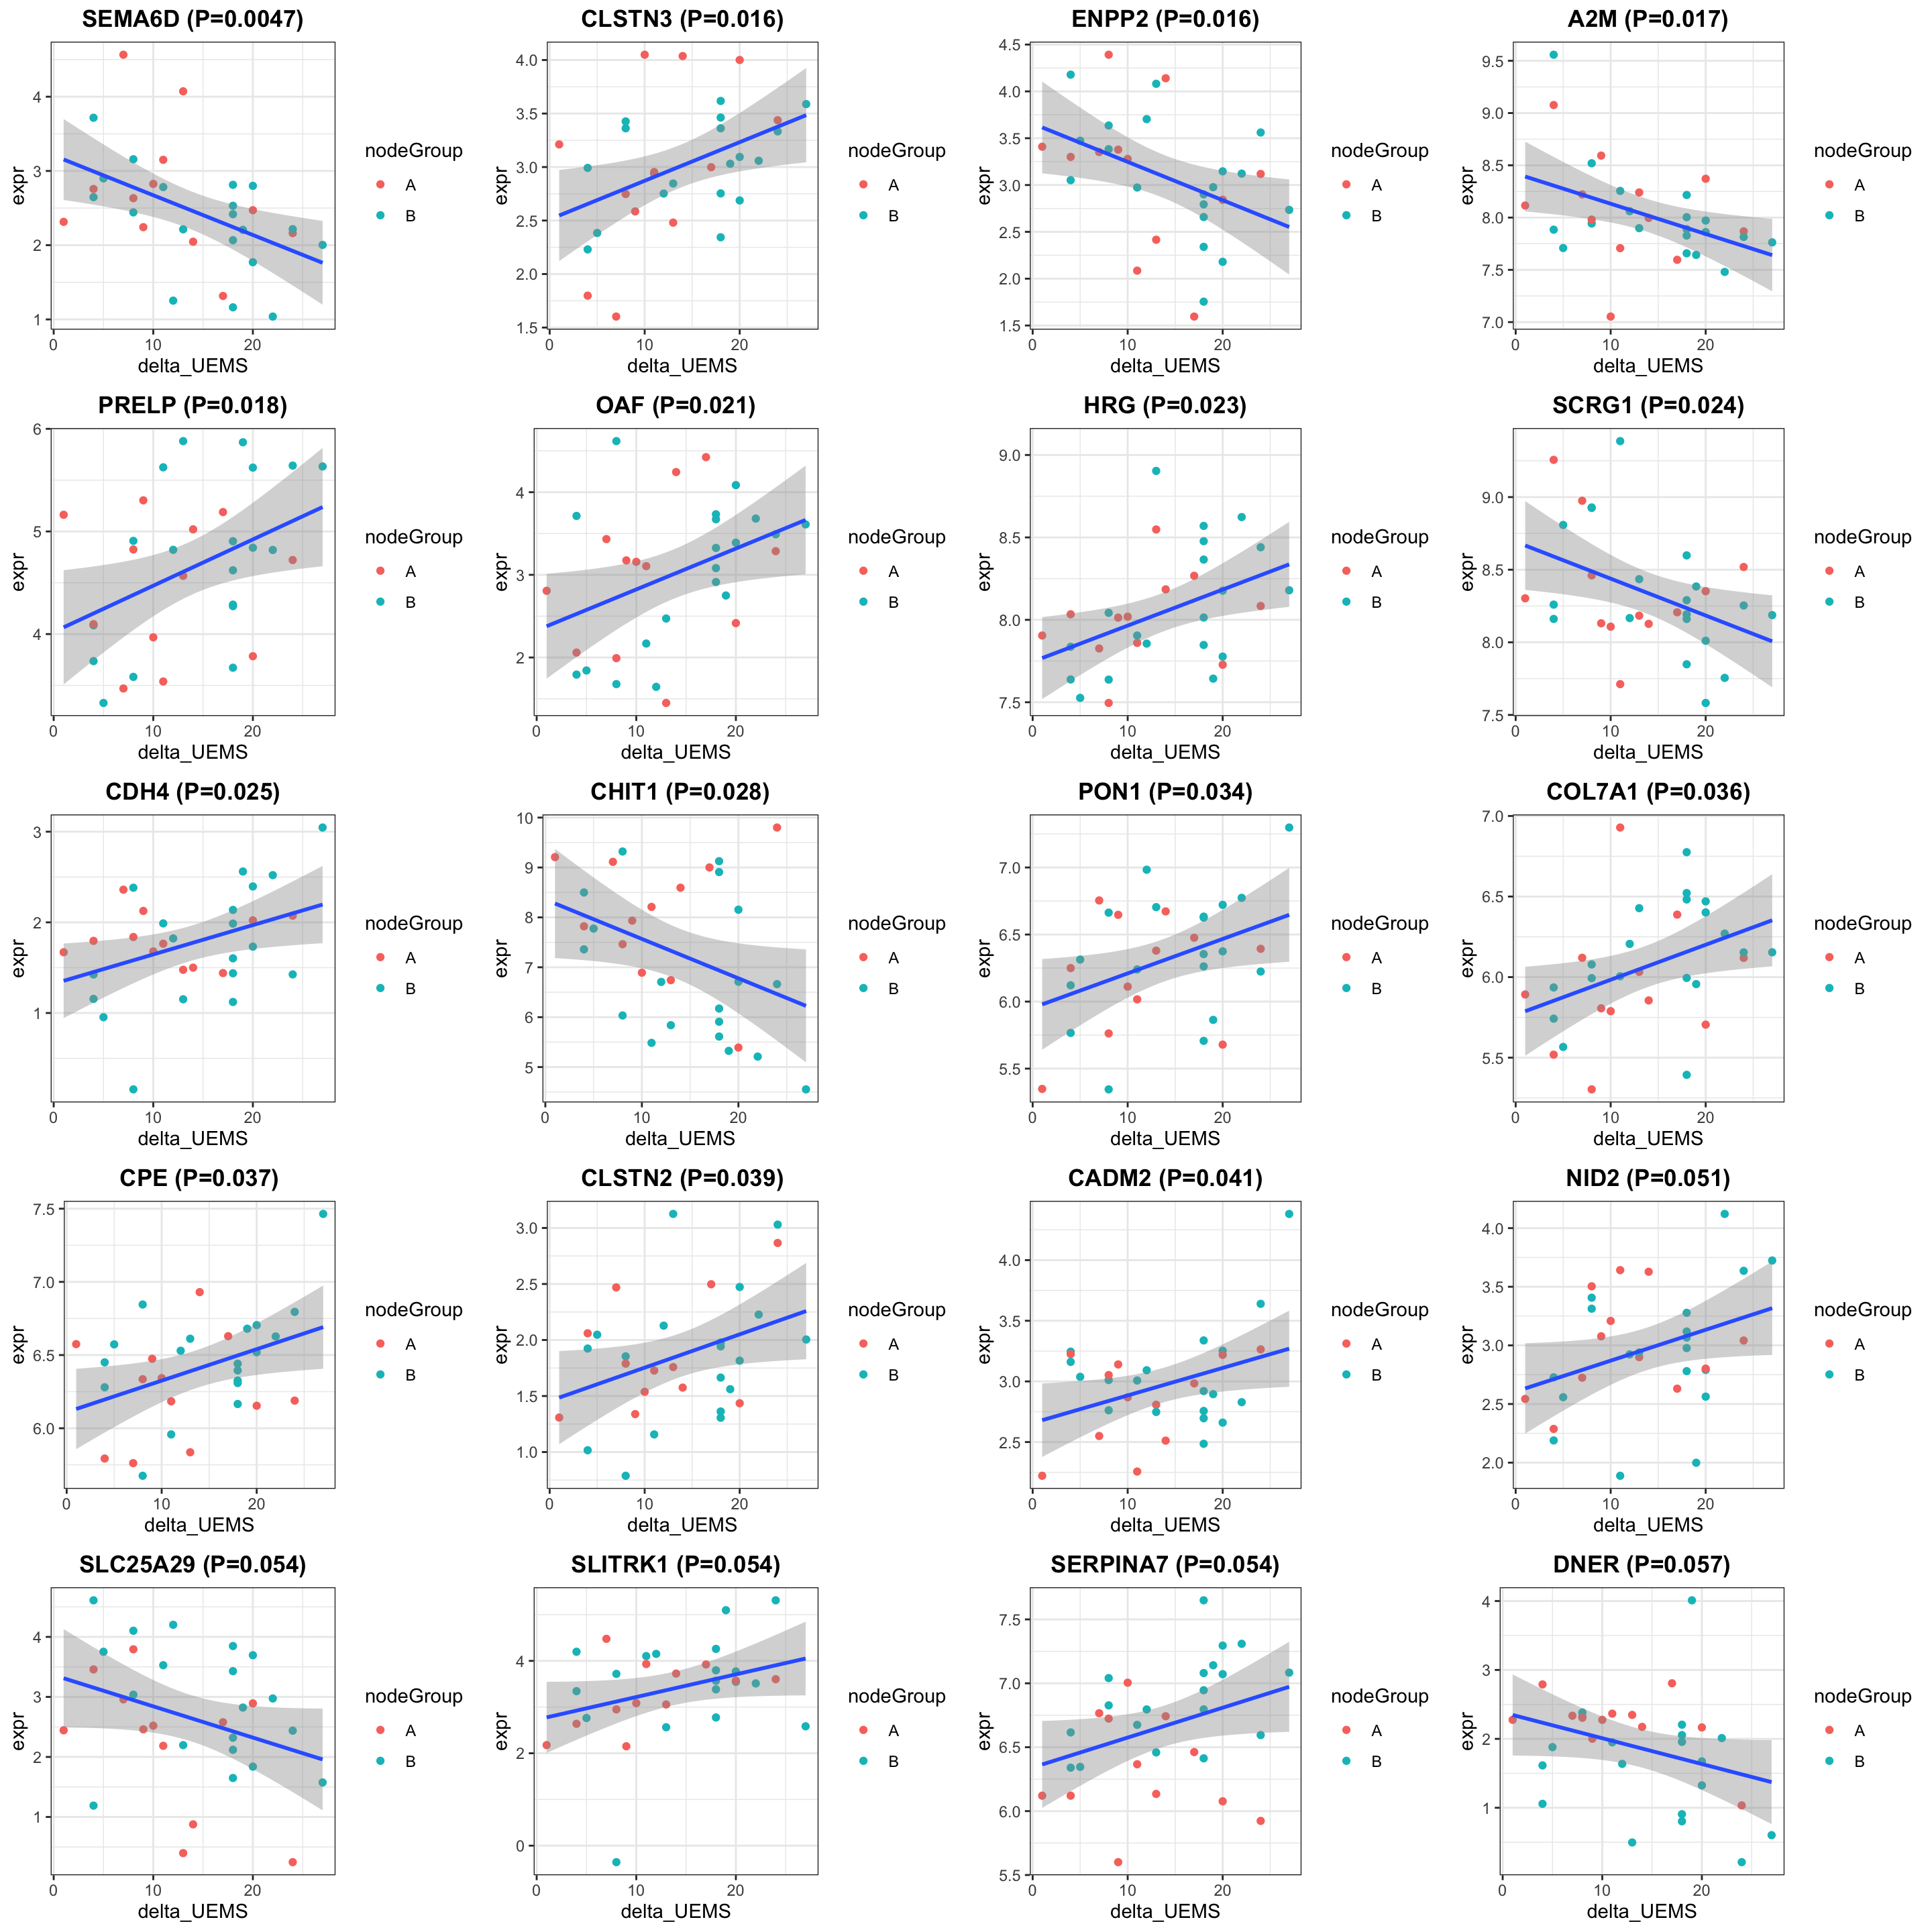
Enrichment analysis
gmts = list(GO_BiologicalProcess = "../data/gmts/c5.go.bp.v2023.2.Hs.symbols.gmt",
            GO_MolecularFunction = "../data/gmts/c5.go.mf.v2023.2.Hs.symbols.gmt")
plotList <- runGeneSetEnrichment(resTab, gmts, genePCut  = 1, pCutSet = 0.05, setFdr = FALSE, method = "gsea")
[1] "No sets passed the criteria"plotList$plot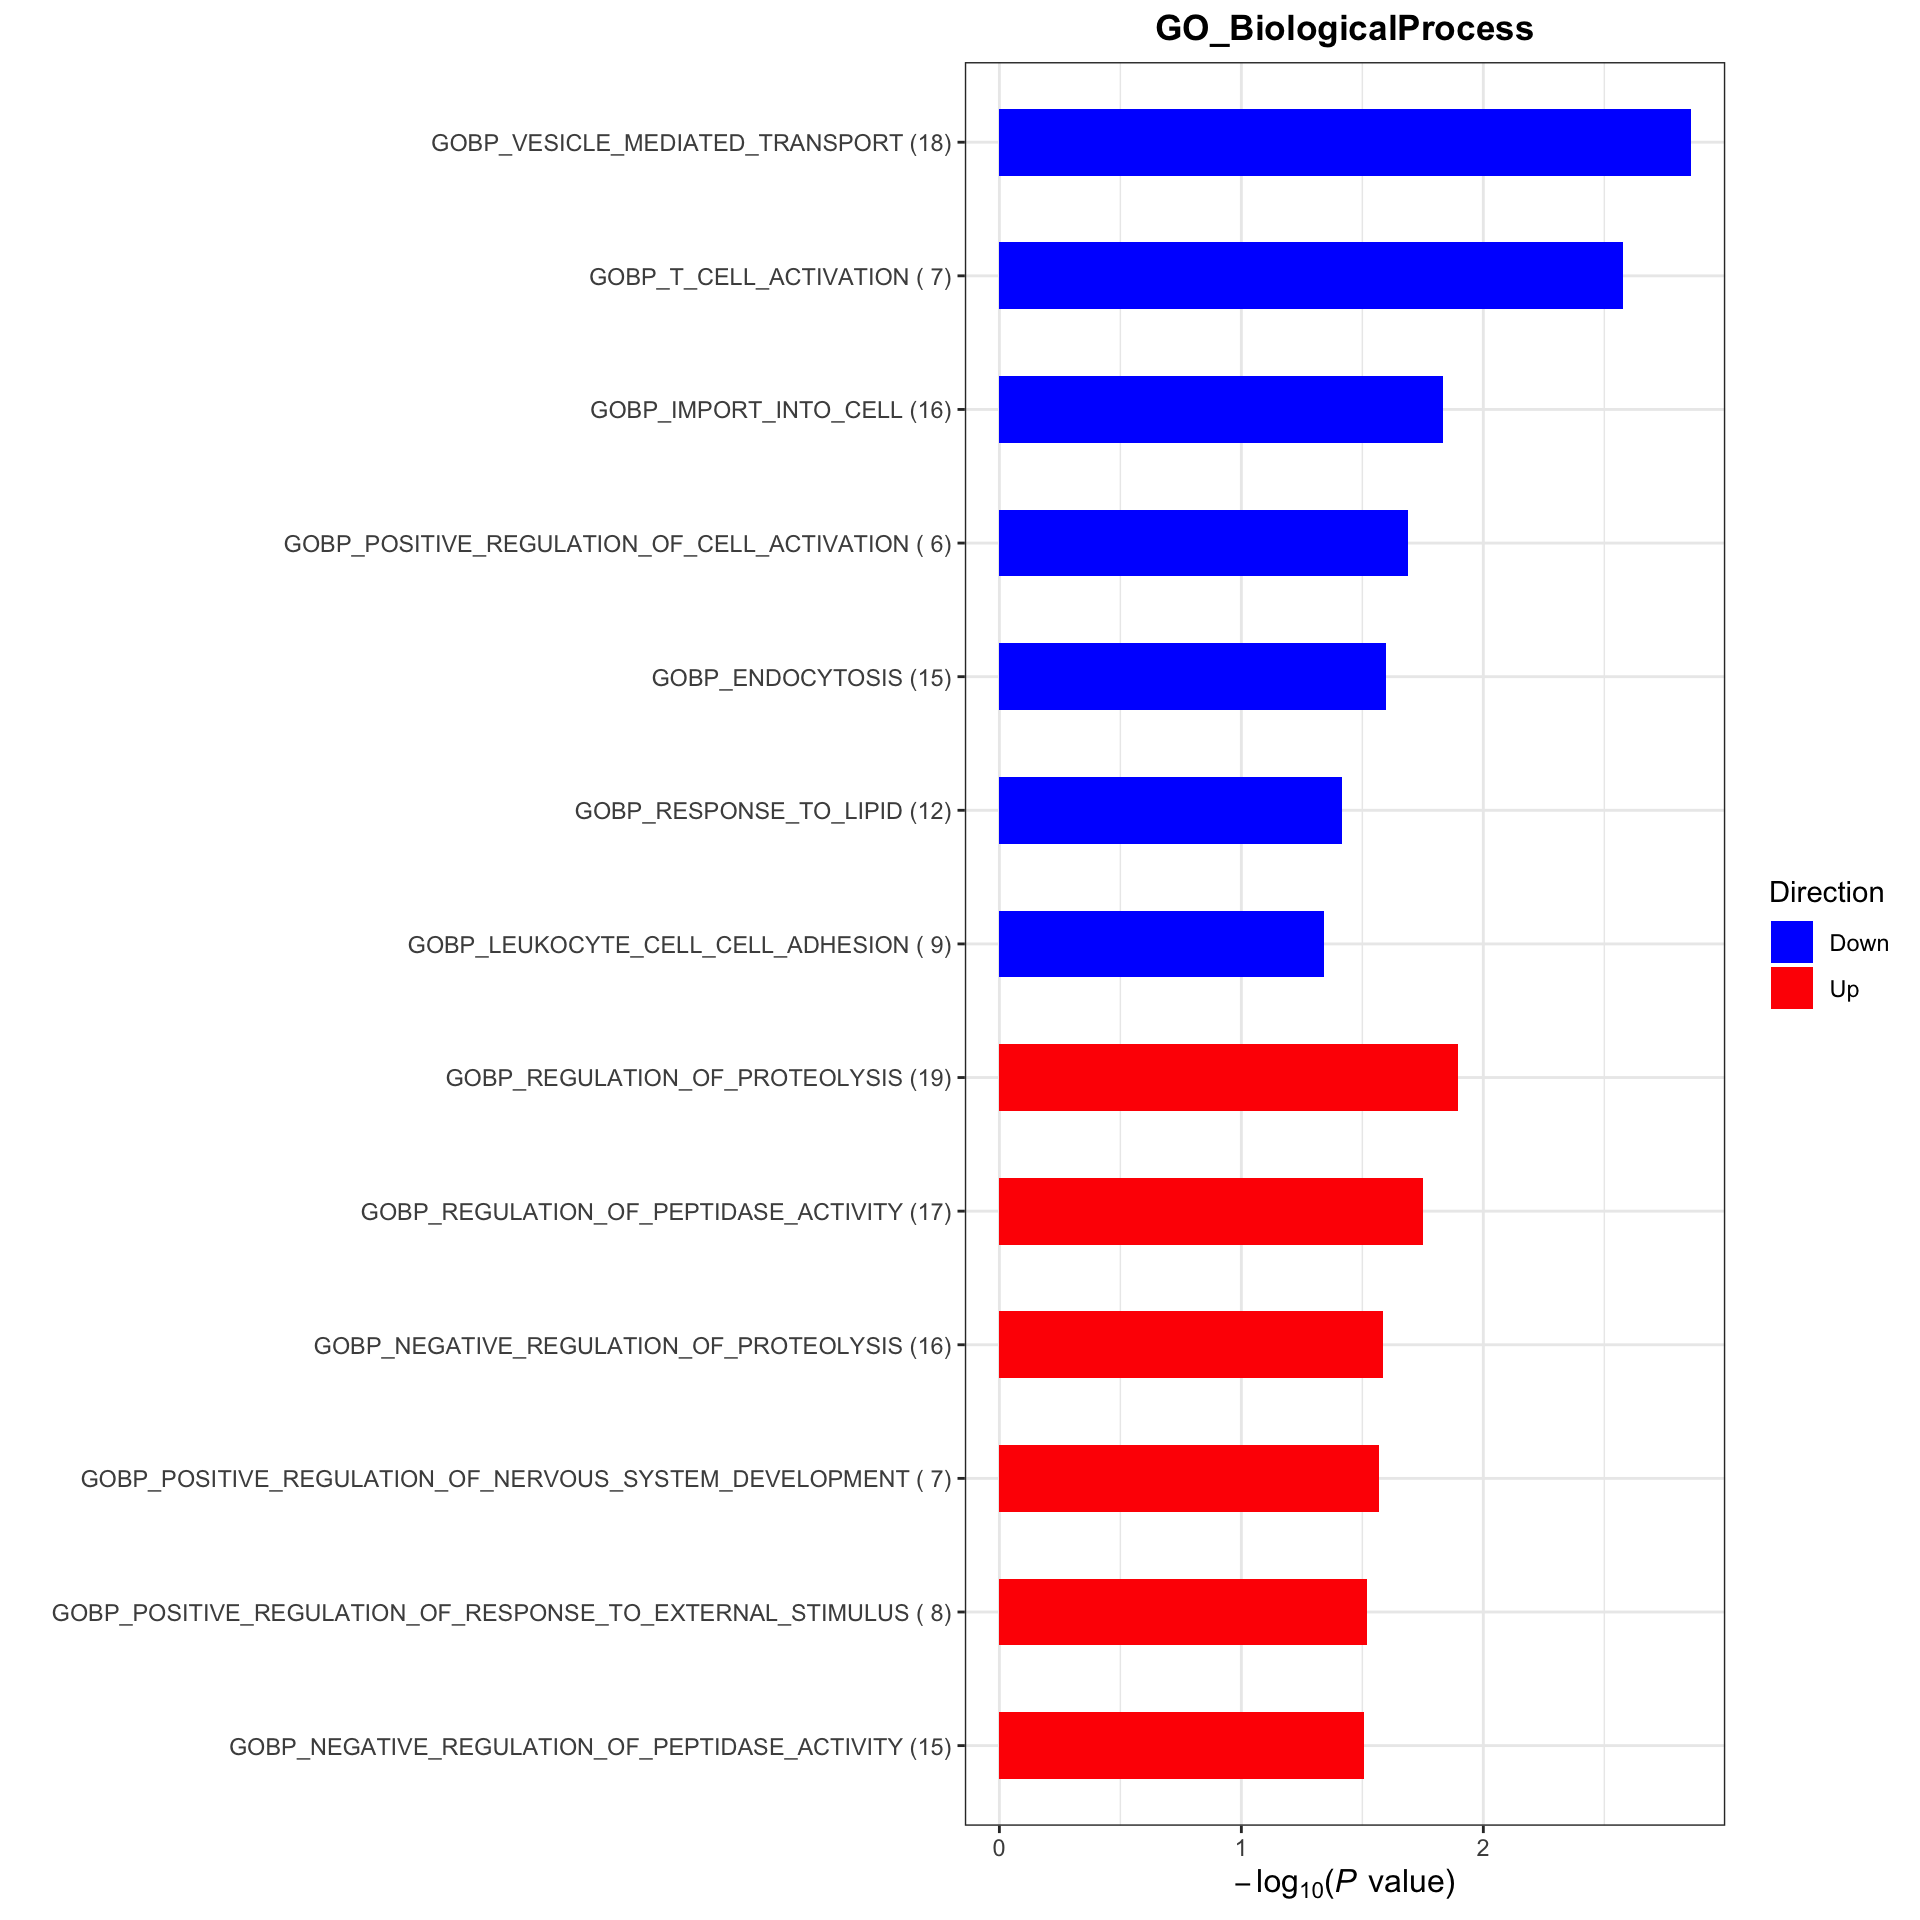
Change between baseline and visit 8 (visit 8 - visit3)
Subsetting
#subset for patients in the placebo group
protSub <- prepareProt(seProt_corr, filterCondi = list(Treatment = "0", Visit = c(3,8)), perNA = 0.5)
[1] "Number of proteins: 379, number of samples: 83"protSub.before <- protSub[, protSub$Visit %in% 3 & !is.na(protSub$delta_UEMS)]
protSub.after <- protSub[,protSub$Visit %in% 8 & !is.na(protSub$delta_UEMS)]
overPat <- intersect(protSub.after$PSN, protSub.before$PSN)
protSub.before <- protSub.before[,match(overPat, protSub.before$PSN)]
protSub.after <- protSub.after[,match(overPat, protSub.after$PSN)]
colnames(protSub.after) <- overPat
colnames(protSub.before) <- overPat
protSub <- protSub.before
assays(protSub)[[1]] <- assays(protSub.after)[[1]] - assays(protSub.before)[[1]]
assays(protSub)[[2]] <- assays(protSub.after)[[2]] - assays(protSub.before)[[2]]
#remove feature with too many missings
#protSub <- protSub[rowSums(is.na(assay(protSub)))/ncol(protSub) < 0.5,]
print("How many proteins and samples")[1] "How many proteins and samples"dim(protSub)[1] 379 35Differential expression
design <- model.matrix(~ delta_UEMS, colData(protSub))

resTab <- testDiff(protSub, design, coef = "delta_UEMS", assayName = "imputed")

allResList[["corrOutcome_diff83_control"]] <- resTab

hist(resTab$pval)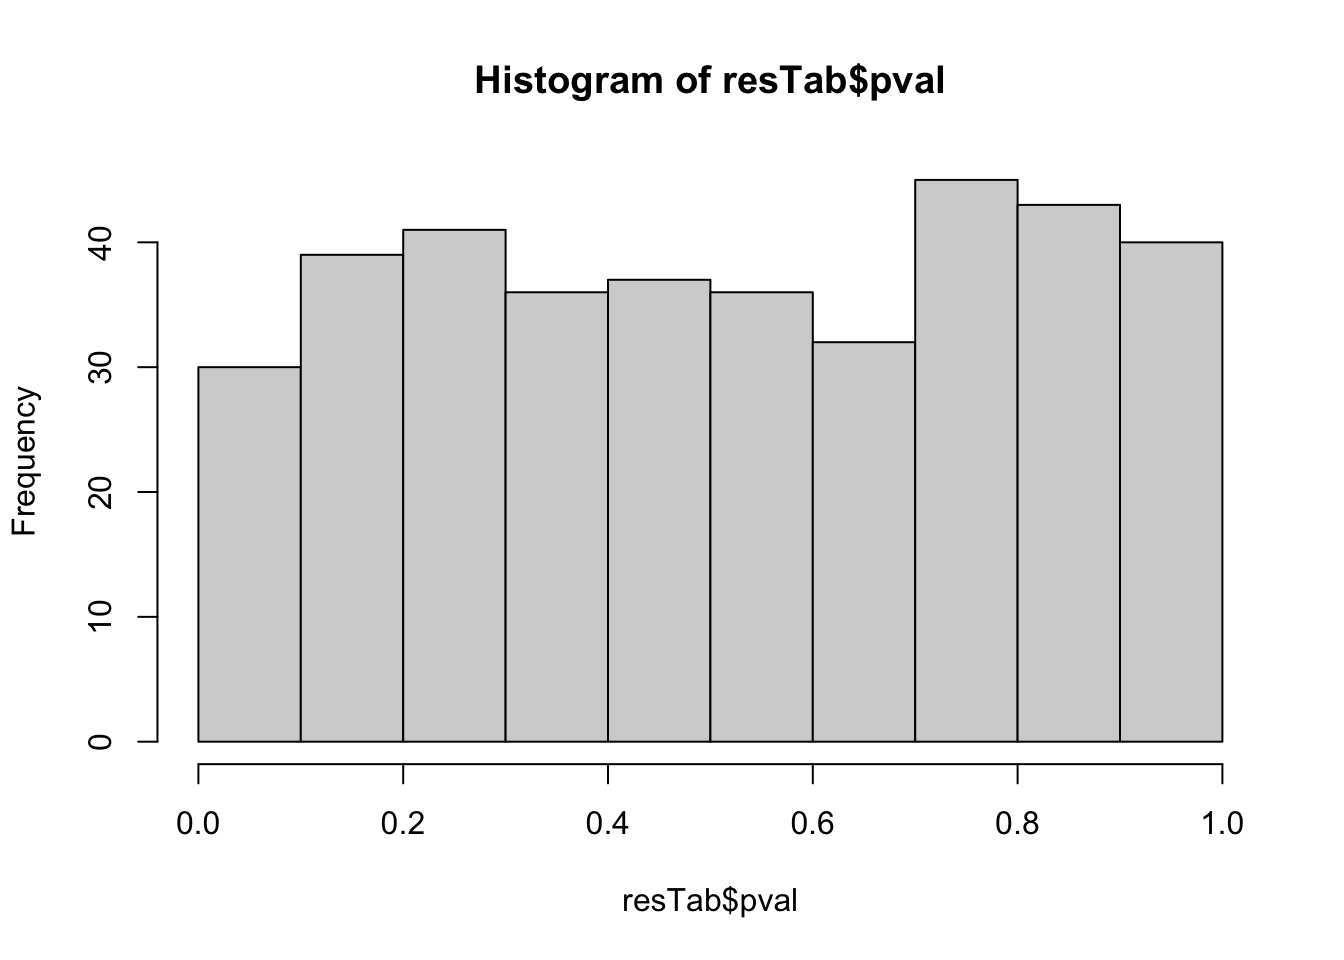
Table of proteins passed raw P-value < 0.05
filter(resTab, pval <= 0.05) %>% mutate(across(where(is.numeric), formatC, digits=2)) %>%
  select(name, symbol, pval, adj_pval, diff) %>%
  DT::datatable()
Correlation plot
exprMat <- assays(protSub)[[2]]
pList <- lapply(seq(20), function(i) {
    rec <- resTab[i,]
    plotTab <- tibble(expr = exprMat[rec$name,],
                      nodeGroup = protSub$nodeGroup,
                      delta_UEMS = protSub$delta_UEMS)
    ggplot(plotTab, aes(x=delta_UEMS, y=expr)) +
        geom_point(aes(col = nodeGroup)) +
        ggtitle(sprintf("%s (P=%s)",rec$symbol,formatC(rec$pval, digits = 2))) +
        #scale_color_gradient(low="green",high="red") +
        geom_smooth(method = "lm") +
        theme_bw() +
        theme(plot.title = element_text(hjust = 0.5, face = "bold"))
})

cowplot::plot_grid(plotlist = pList, ncol=4)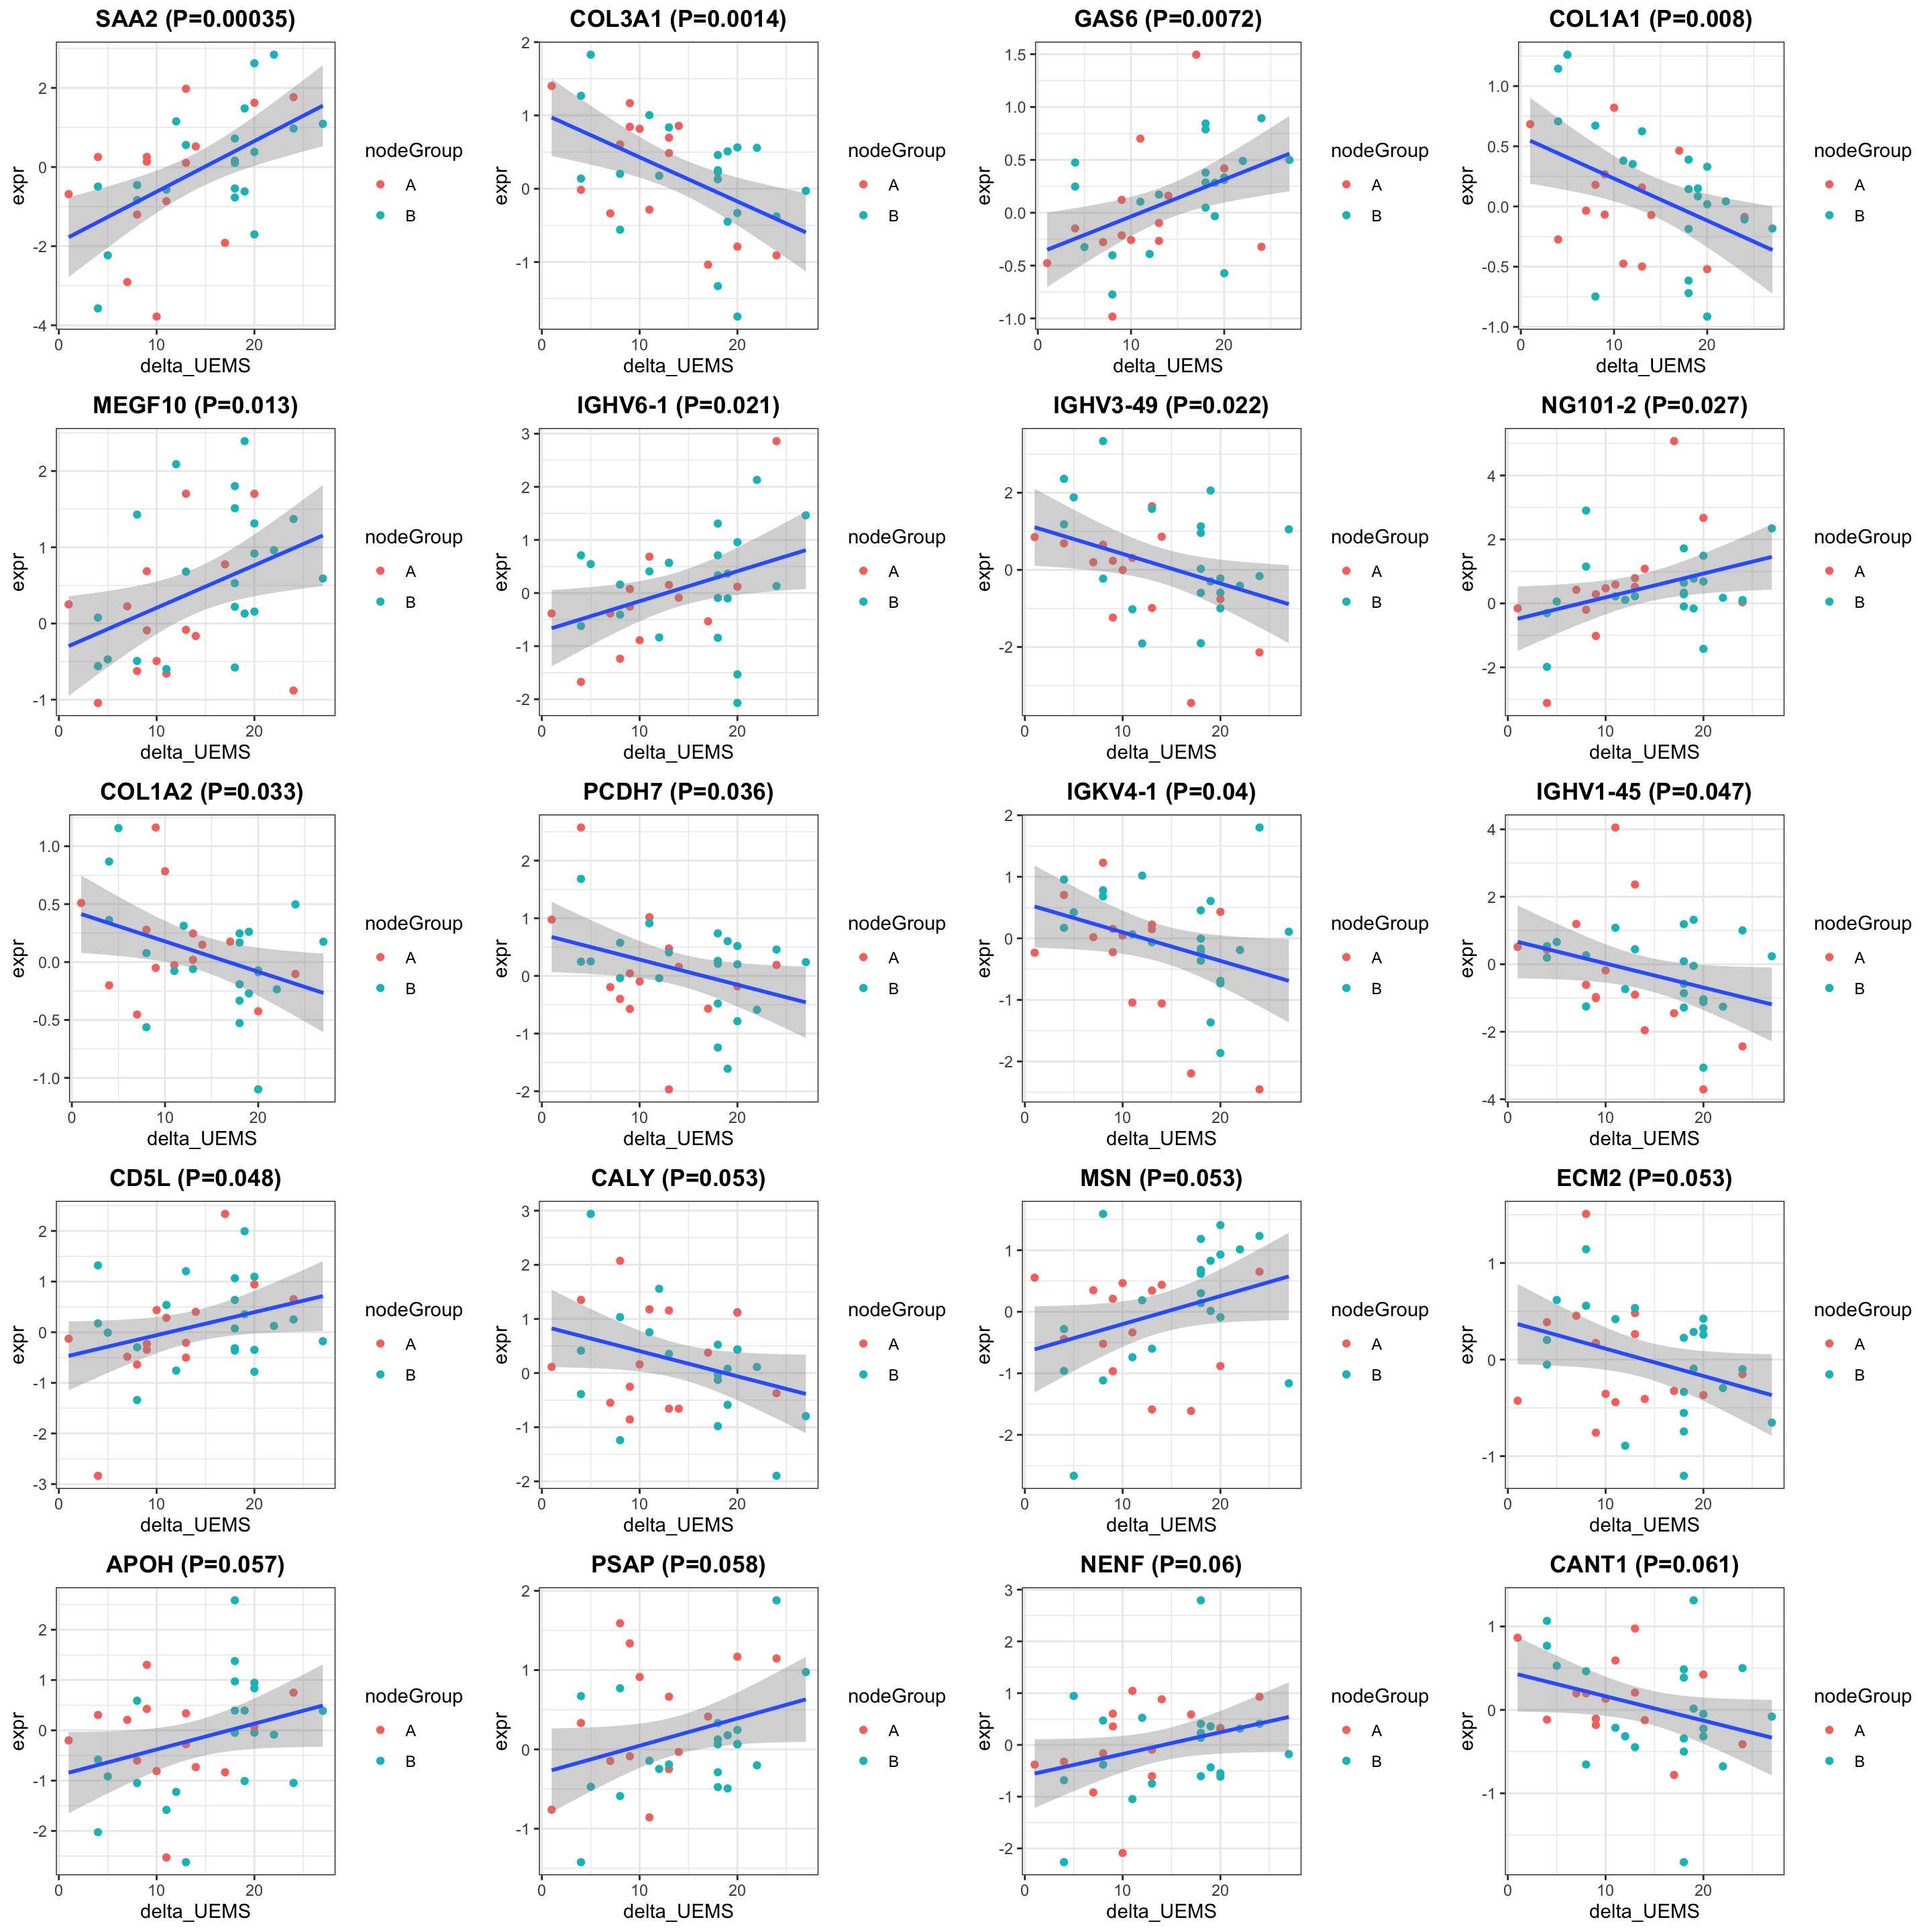
Enrichment analysis
gmts = list(GO_BiologicalProcess = "../data/gmts/c5.go.bp.v2023.2.Hs.symbols.gmt",
            GO_MolecularFunction = "../data/gmts/c5.go.mf.v2023.2.Hs.symbols.gmt")
plotList <- runGeneSetEnrichment(resTab, gmts, genePCut  = 1, pCutSet = 0.05, setFdr = FALSE, method = "gsea")
plotList$plot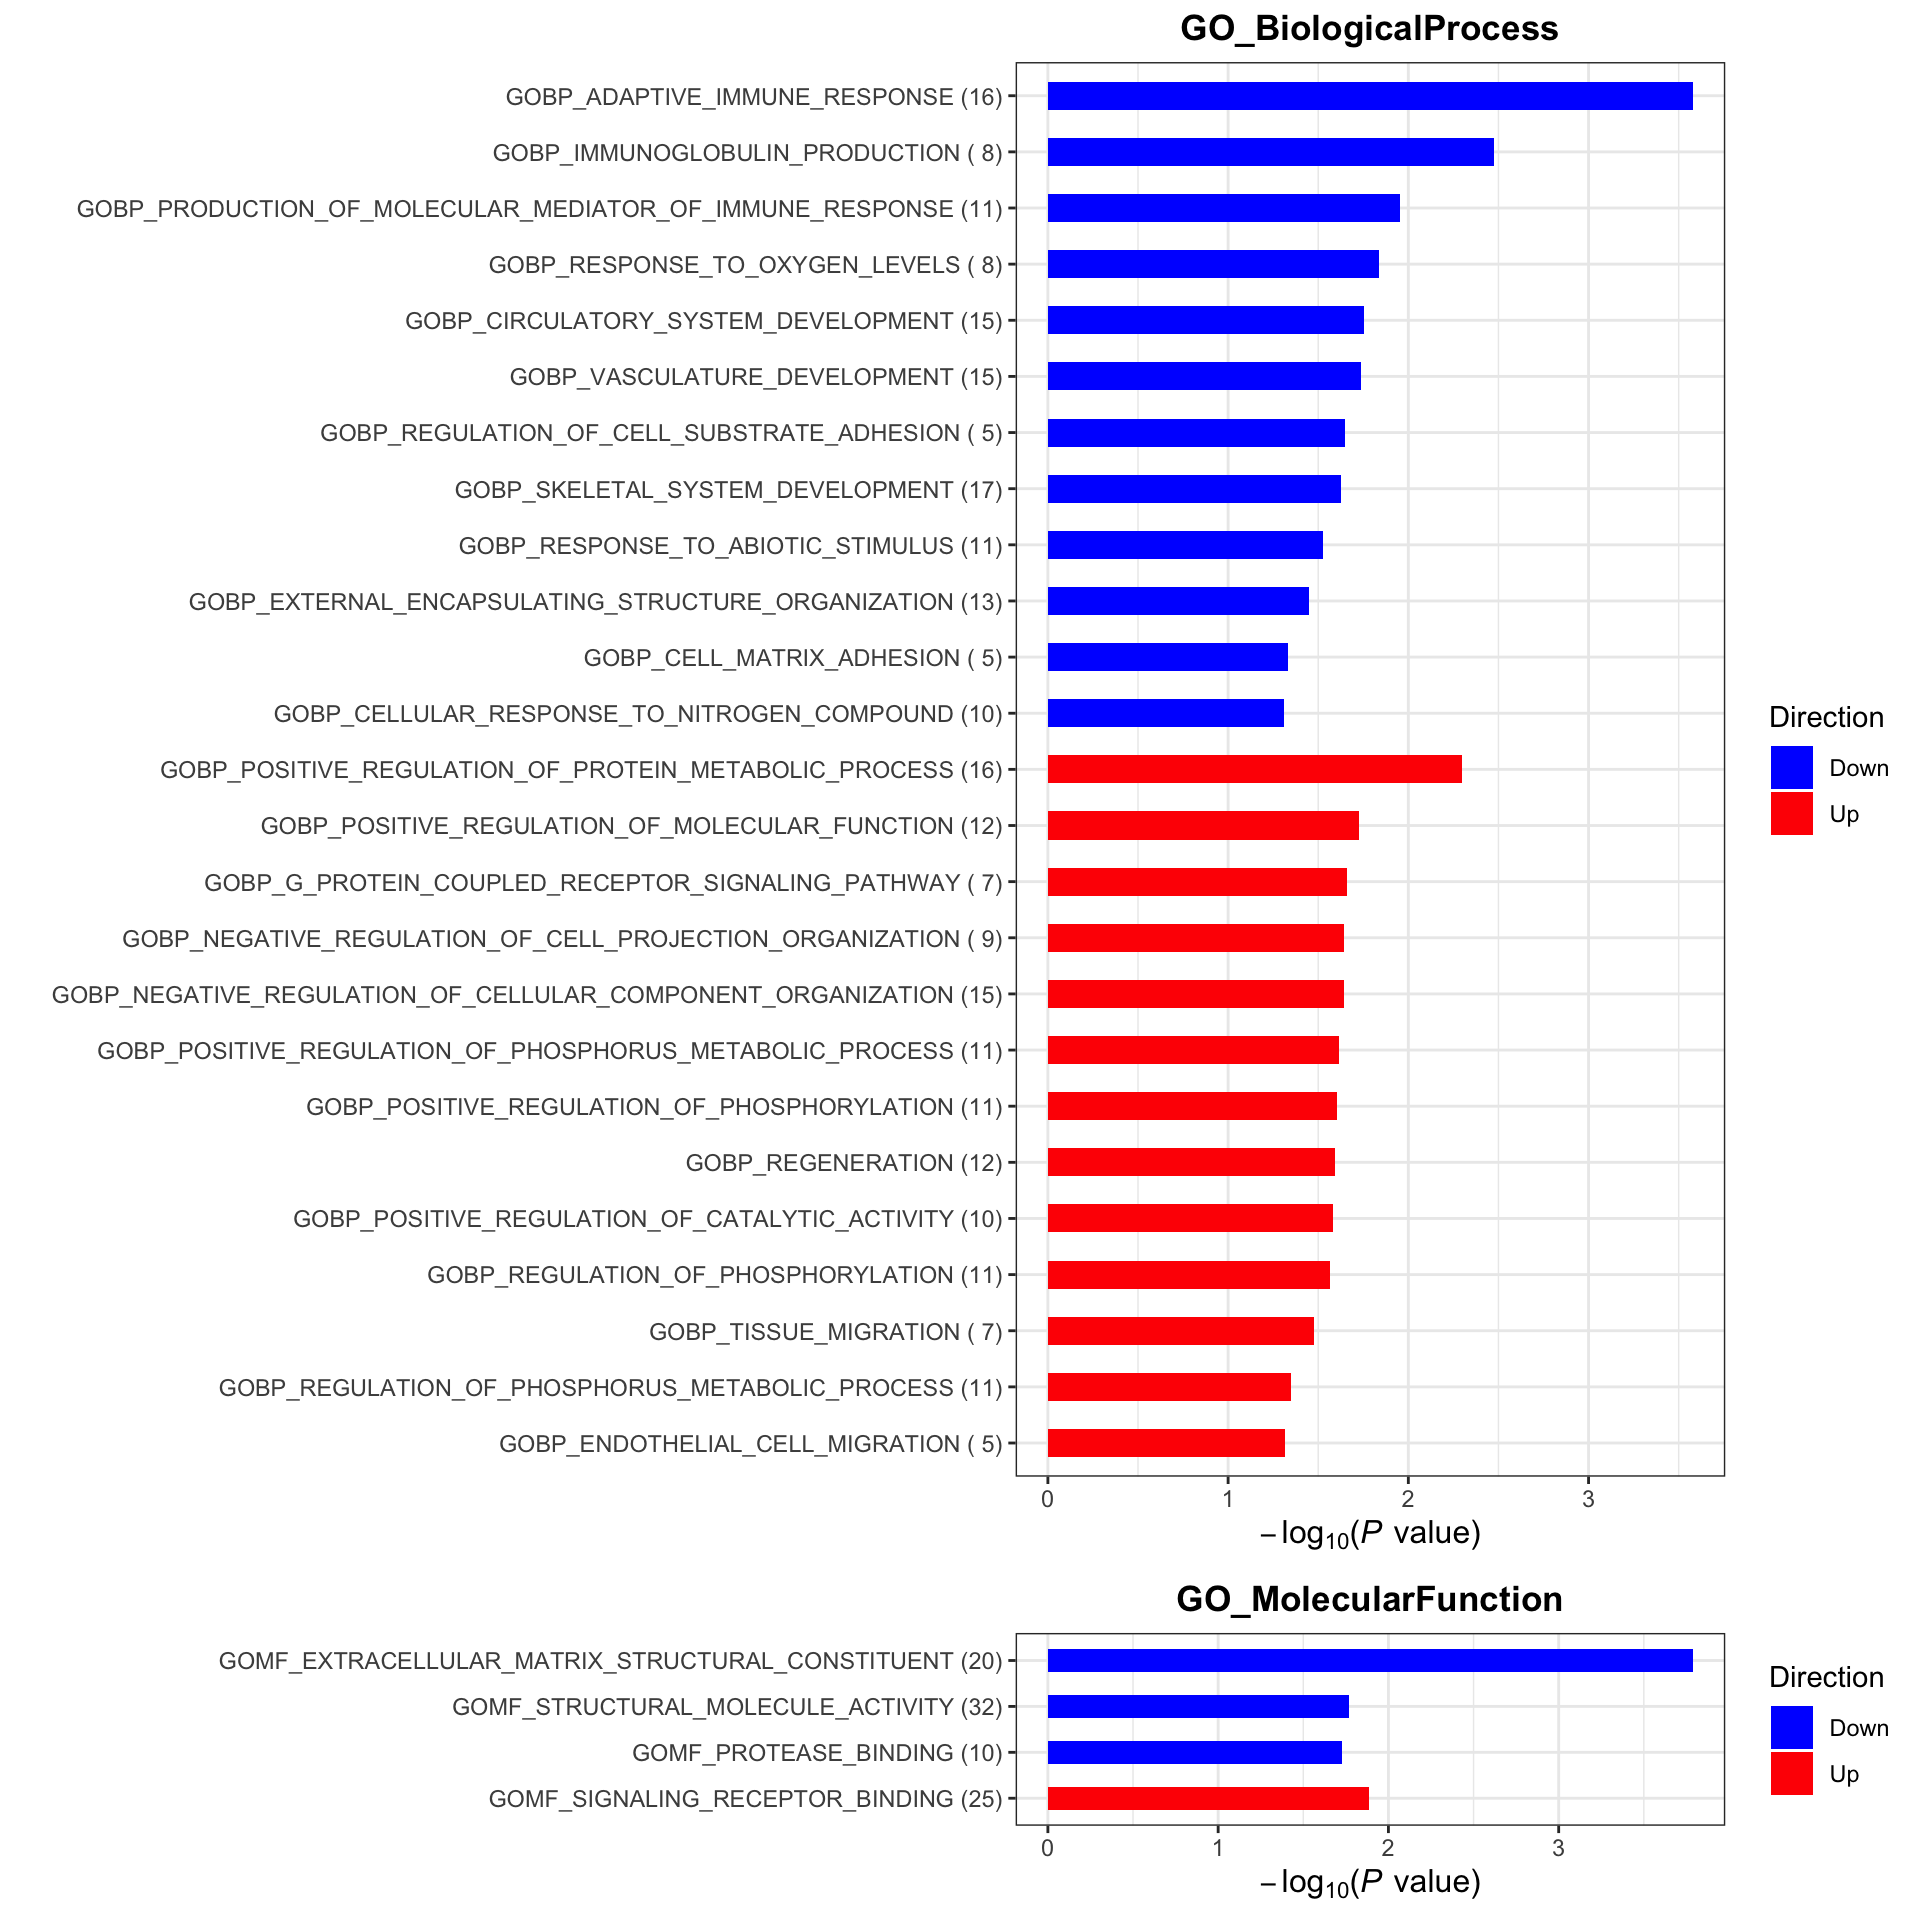
In untreated samples from group B
At baseline
Subsetting
#subset for patients in the placebo group
protSub <- prepareProt(seProt_corr, filterCondi = list(Treatment ="0", Visit = "3", nodeGroup="B"), perNA = 0.5)
[1] "Number of proteins: 369, number of samples: 23"#protSub <- seProt_corr[,seProt_corr$Treatment %in% 1 & seProt_corr$Visit %in% 3 & !is.na(seProt_corr$delta_UEMS)]
print("How many proteins and samples")[1] "How many proteins and samples"dim(protSub)[1] 369 23Differential expression
design <- model.matrix(~ delta_UEMS, colData(protSub))

resTab <- testDiff(protSub, design, coef = "delta_UEMS", assayName = "imputed")

allResList[["corrOutcome_baseline_controlB"]] <- resTab
hist(resTab$pval)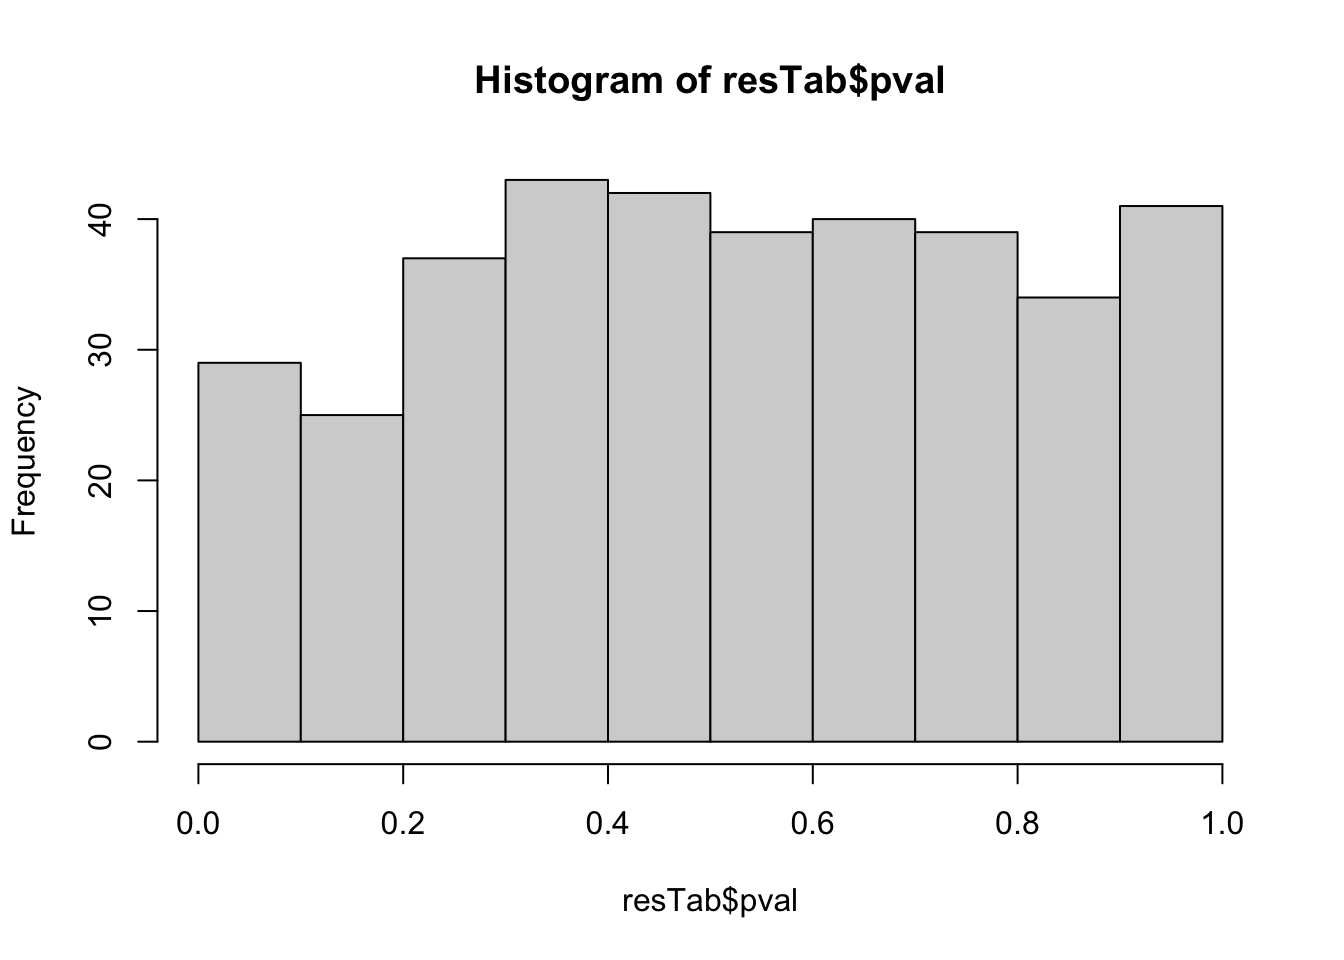
Table of proteins passed raw P-value < 0.05
filter(resTab, pval <= 0.05) %>% mutate(across(where(is.numeric), formatC, digits=2)) %>%
  select(name, symbol, pval, adj_pval, diff, n_obs) %>%
  DT::datatable()
Correlation plot
exprMat <- assays(protSub)[[2]]
pList <- lapply(seq(20), function(i) {
    rec <- resTab[i,]
    plotTab <- tibble(expr = exprMat[rec$name,],
                      nodeGroup = protSub$nodeGroup,
                      delta_UEMS = protSub$delta_UEMS)
    ggplot(plotTab, aes(x=delta_UEMS, y=expr)) +
        geom_point(aes(col = nodeGroup)) +
        ggtitle(sprintf("%s (P=%s)",rec$symbol,formatC(rec$pval, digits = 2))) +
        #scale_color_gradient(low="green",high="red") +
        geom_smooth(method = "lm") +
        theme_bw() +
        theme(plot.title = element_text(hjust = 0.5, face = "bold"))
})

cowplot::plot_grid(plotlist = pList, ncol=4)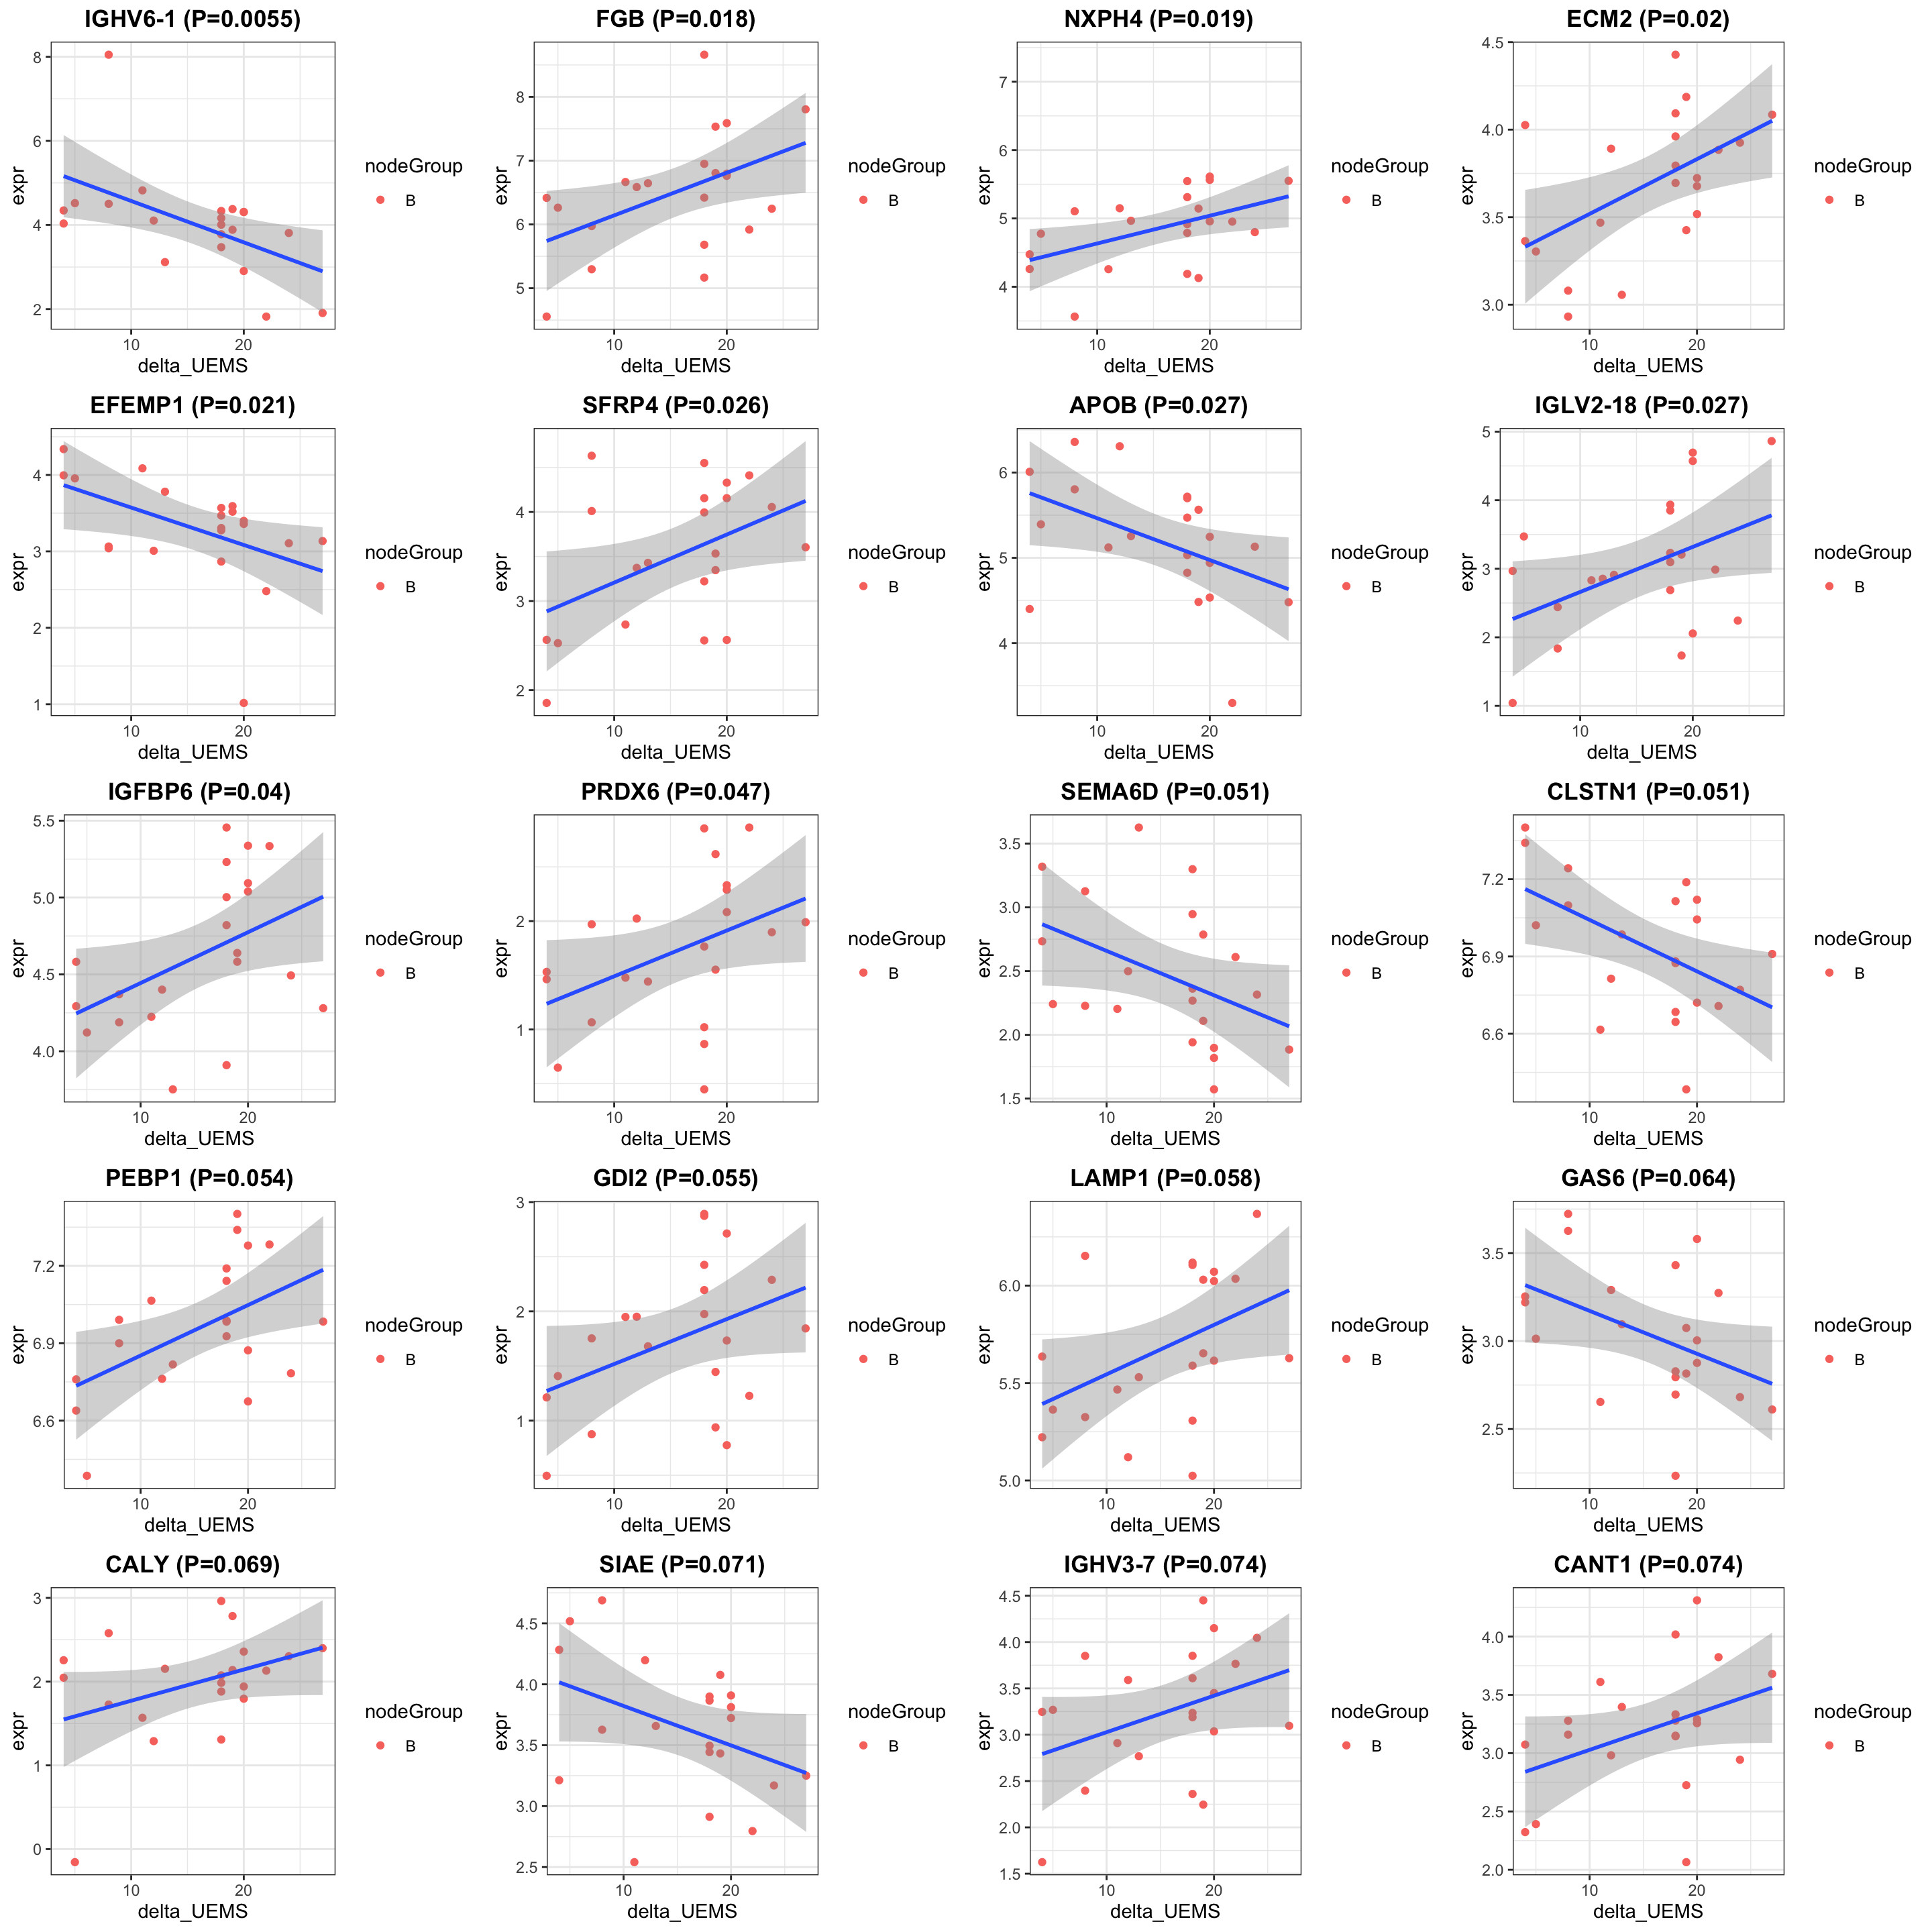
Enrichment analysis
gmts = list(GO_BiologicalProcess = "../data/gmts/c5.go.bp.v2023.2.Hs.symbols.gmt",
            GO_MolecularFunction = "../data/gmts/c5.go.mf.v2023.2.Hs.symbols.gmt")
plotList <- runGeneSetEnrichment(resTab, gmts, genePCut  = 1, pCutSet = 0.05, setFdr = FALSE, method = "gsea")
[1] "No sets passed the criteria"plotList$plot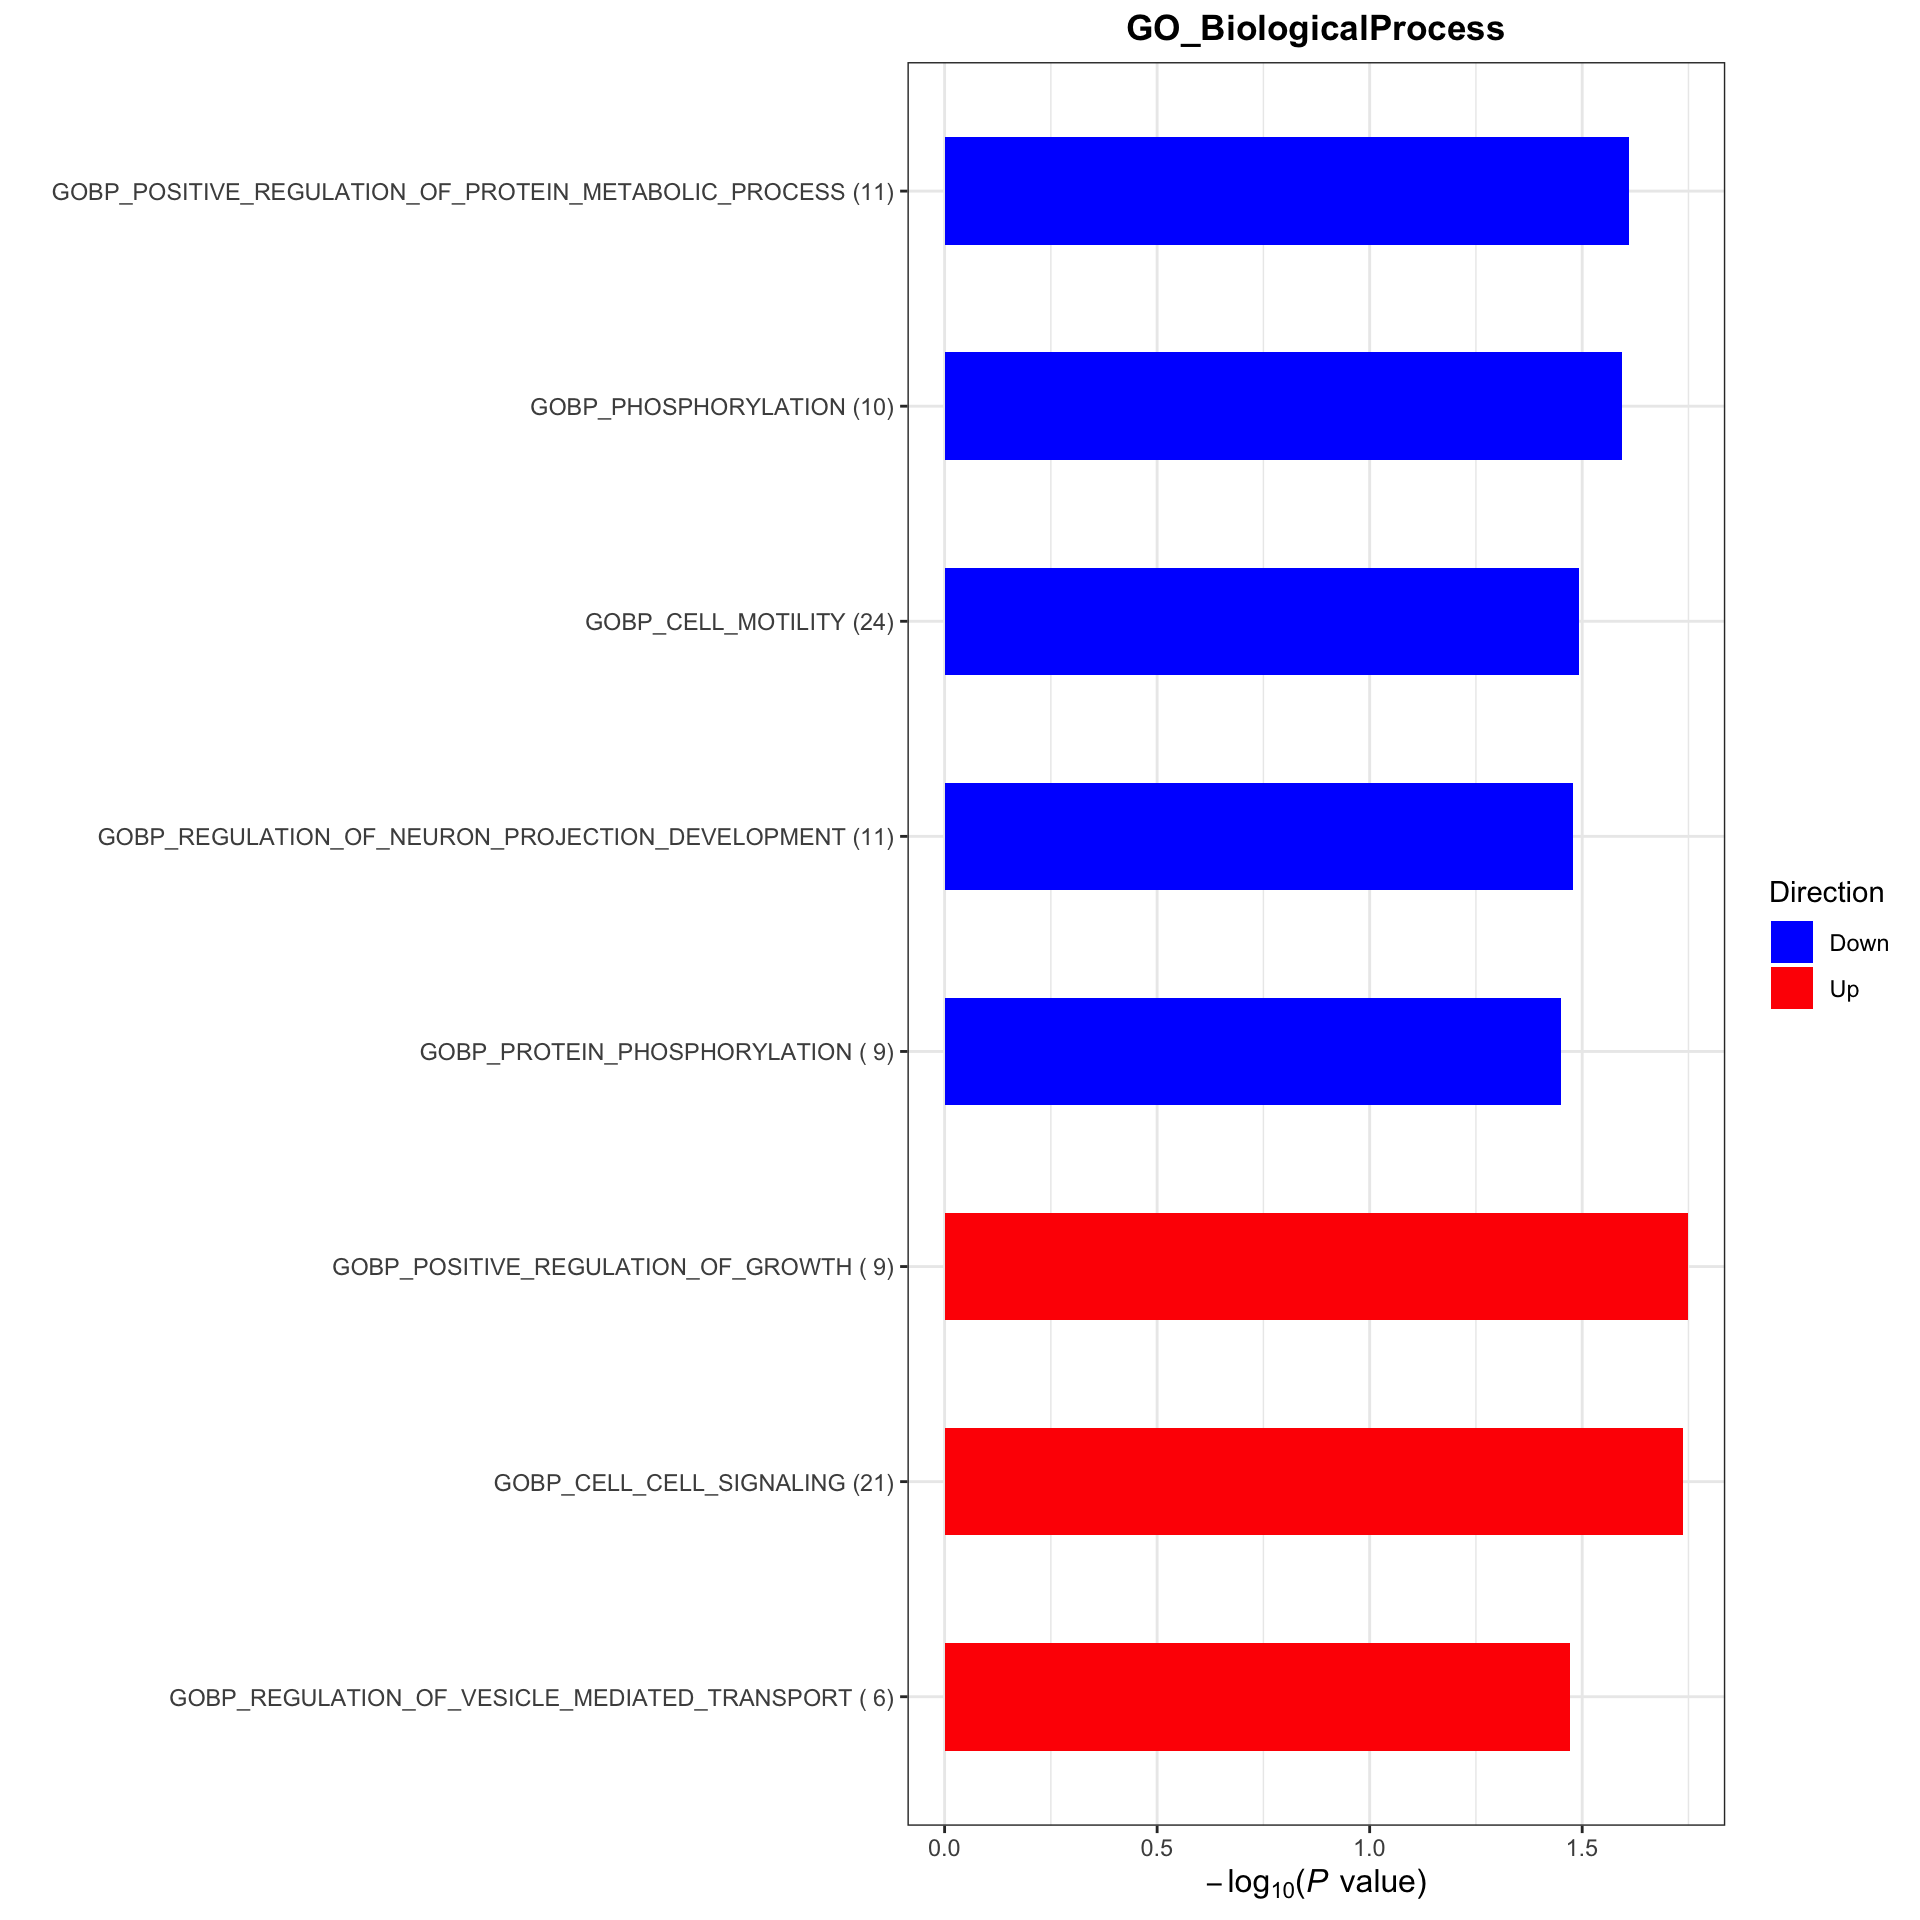
At visit 8
Subsetting
#subset for patients in the placebo group
protSub <- prepareProt(seProt_corr, filterCondi = list(Treatment ="0", Visit = "8", nodeGroup="B"), perNA = 0.5)
[1] "Number of proteins: 380, number of samples: 24"#protSub <- seProt_corr[,seProt_corr$Treatment %in% 1 & seProt_corr$Visit %in% 3 & !is.na(seProt_corr$delta_UEMS)]
print("How many proteins and samples")[1] "How many proteins and samples"dim(protSub)[1] 380 24Differential expression
design <- model.matrix(~ delta_UEMS, colData(protSub))

resTab <- testDiff(protSub, design, coef = "delta_UEMS", assayName = "imputed")

allResList[["corrOutcome_visit8_controlB"]] <- resTab
hist(resTab$pval)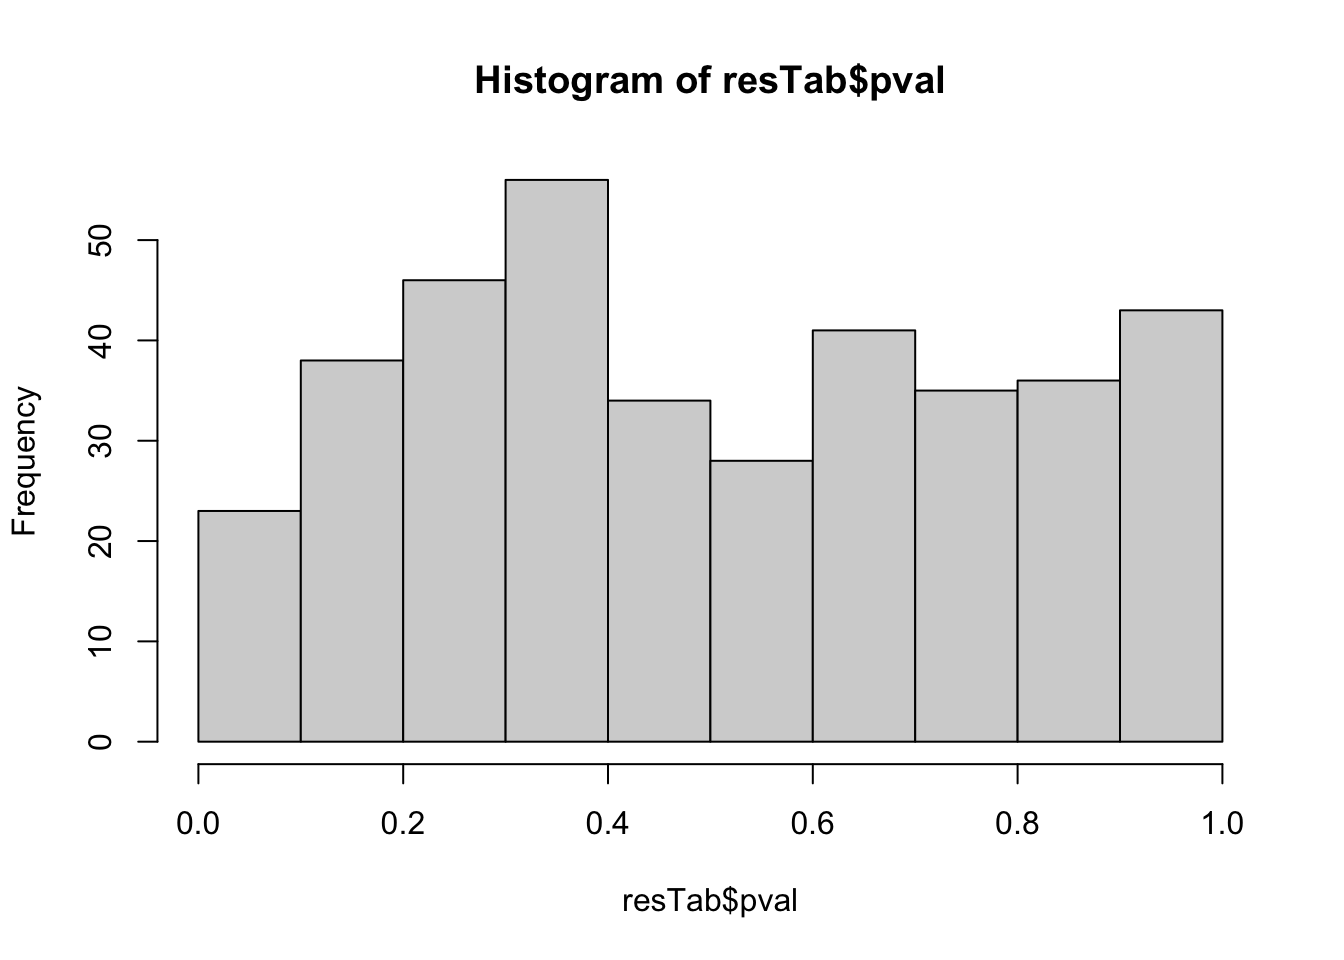
Table of proteins passed raw P-value < 0.05
filter(resTab, pval <= 0.05) %>% mutate(across(where(is.numeric), formatC, digits=2)) %>%
  select(name, symbol, pval, adj_pval, diff, n_obs) %>%
  DT::datatable()
Correlation plot
exprMat <- assay(protSub)
pList <- lapply(seq(20), function(i) {
    rec <- resTab[i,]
    plotTab <- tibble(expr = exprMat[rec$name,],
                      nodeGroup = protSub$nodeGroup,
                      delta_UEMS = protSub$delta_UEMS)
    ggplot(plotTab, aes(x=delta_UEMS, y=expr)) +
        geom_point(aes(col = nodeGroup)) +
        ggtitle(sprintf("%s (P=%s)",rec$symbol,formatC(rec$pval, digits = 2))) +
        #scale_color_gradient(low="green",high="red") +
        geom_smooth(method = "lm") +
        theme_bw() +
        theme(plot.title = element_text(hjust = 0.5, face = "bold"))
})

cowplot::plot_grid(plotlist = pList, ncol=4)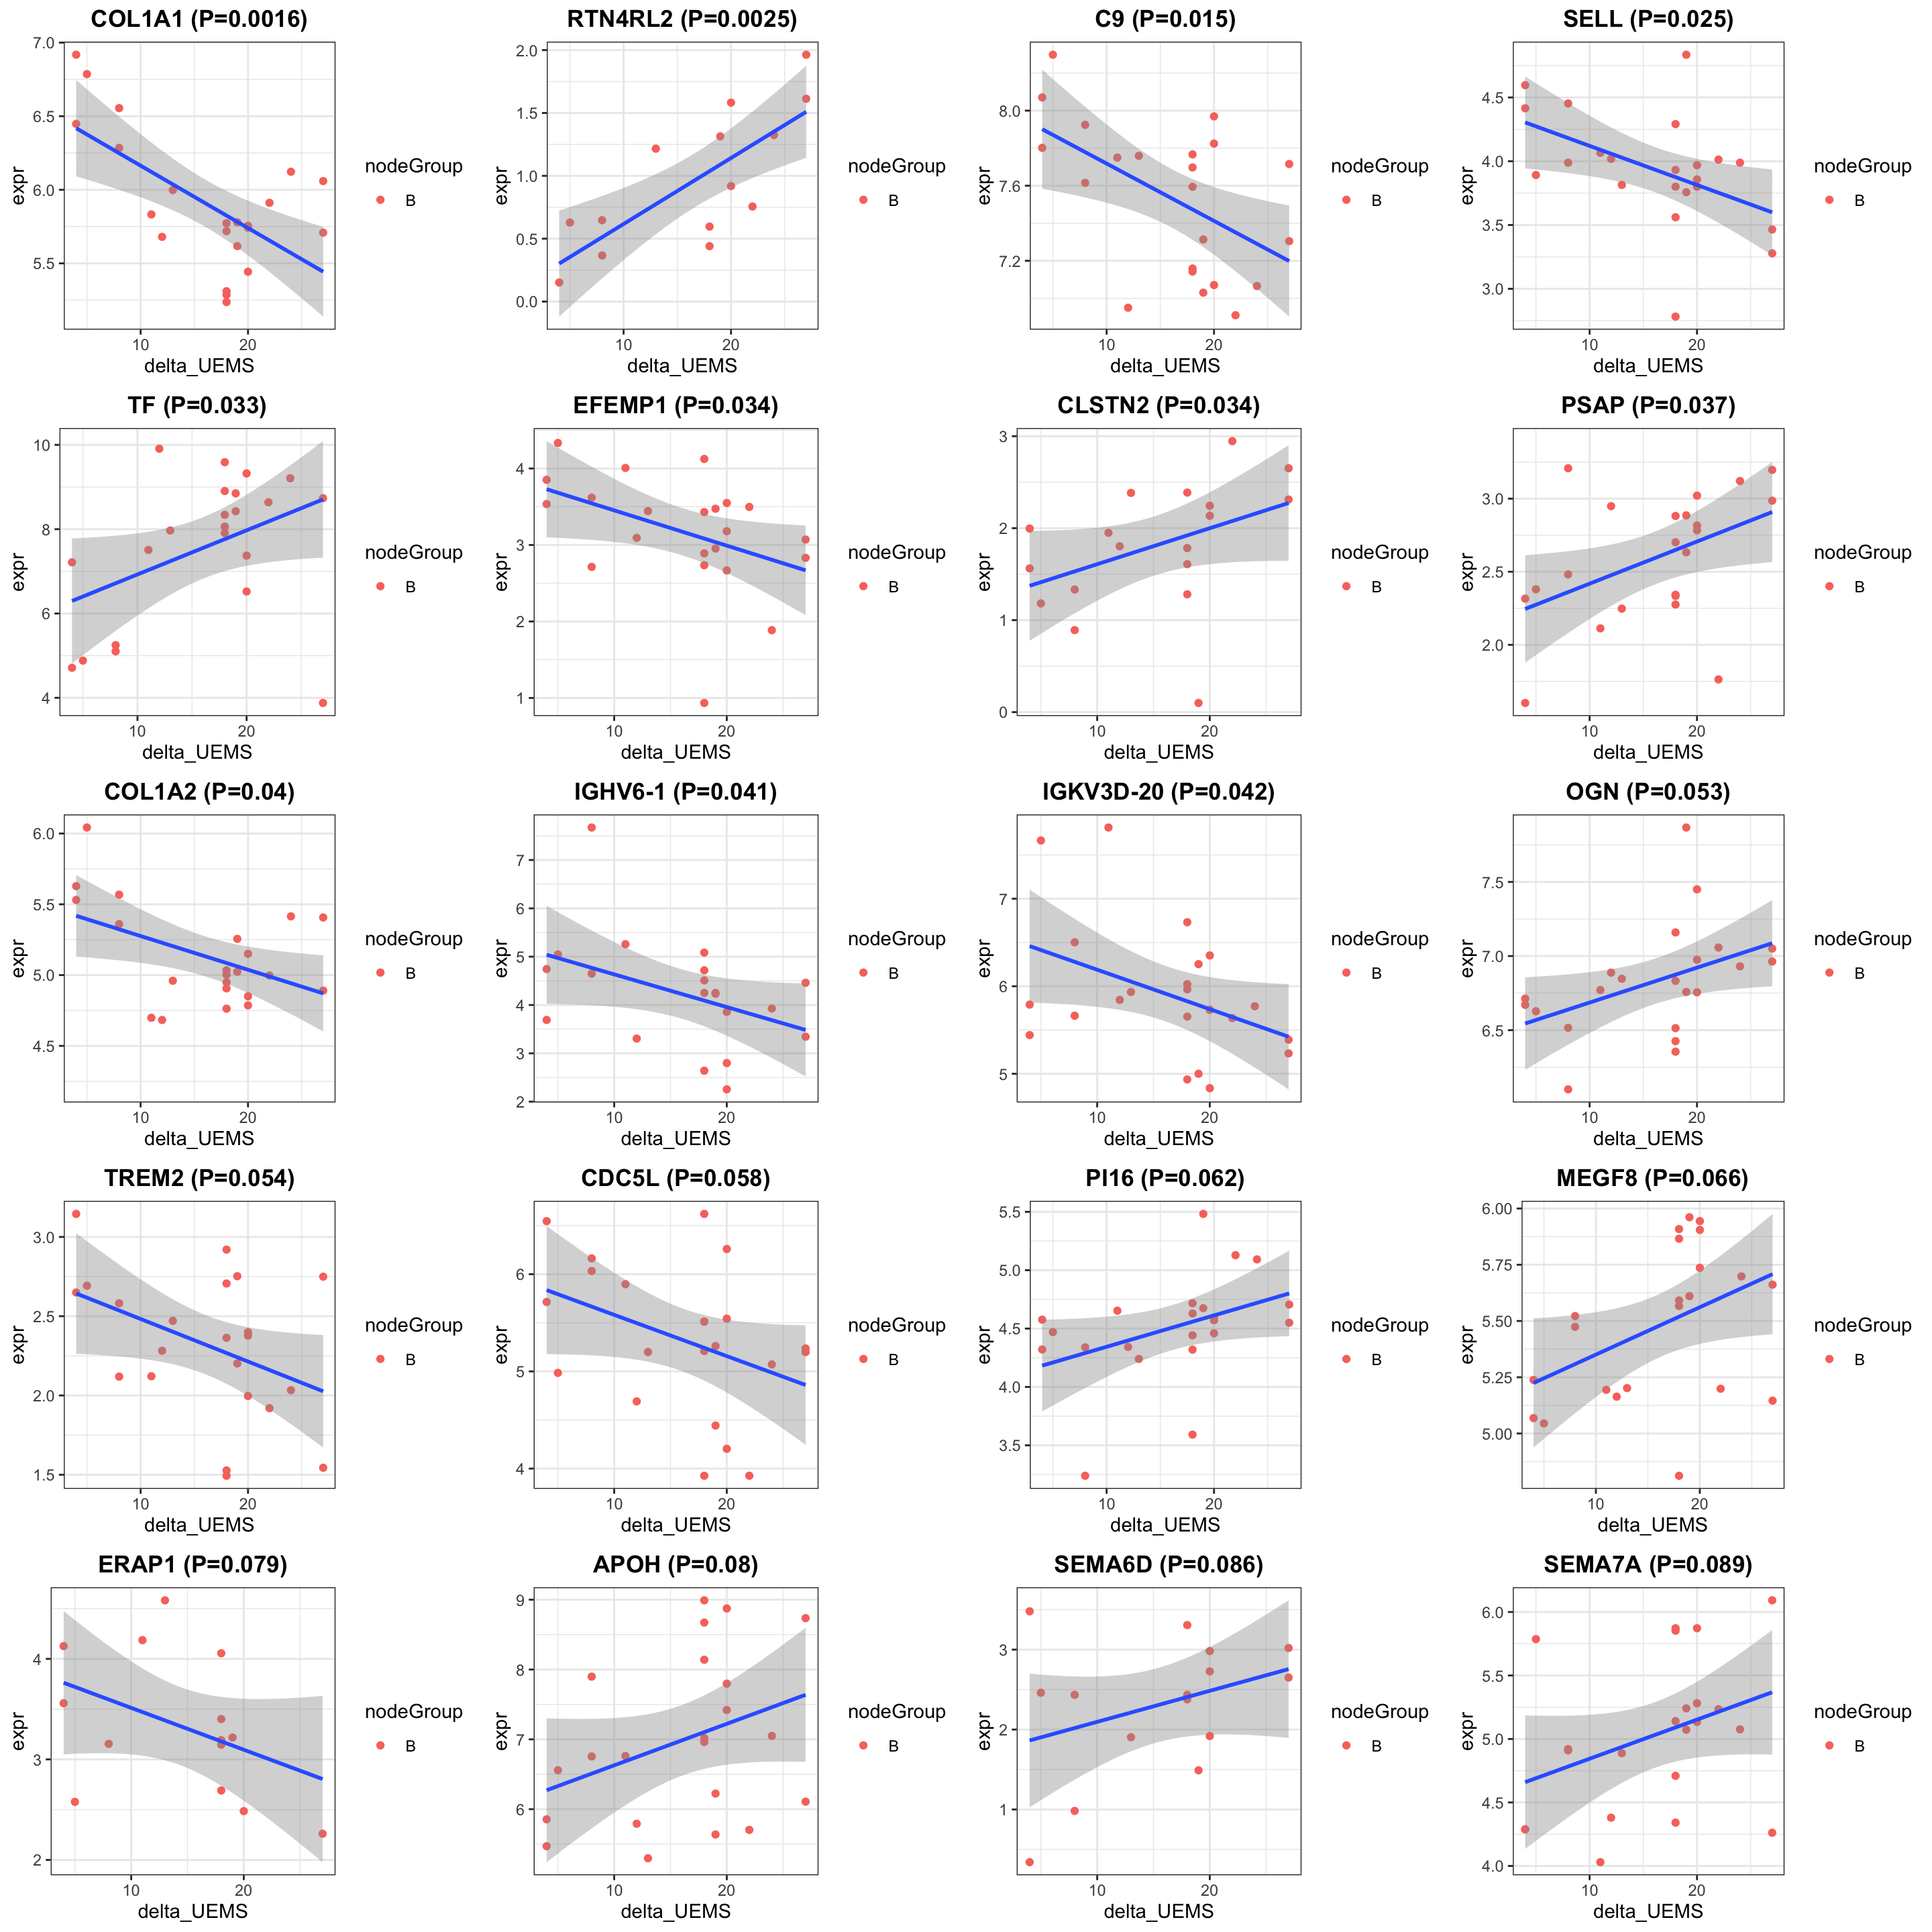
Enrichment analysis
gmts = list(GO_BiologicalProcess = "../data/gmts/c5.go.bp.v2023.2.Hs.symbols.gmt",
            GO_MolecularFunction = "../data/gmts/c5.go.mf.v2023.2.Hs.symbols.gmt")
plotList <- runGeneSetEnrichment(resTab, gmts, genePCut  = 1, pCutSet = 0.05, setFdr = FALSE, method = "gsea")
plotList$plot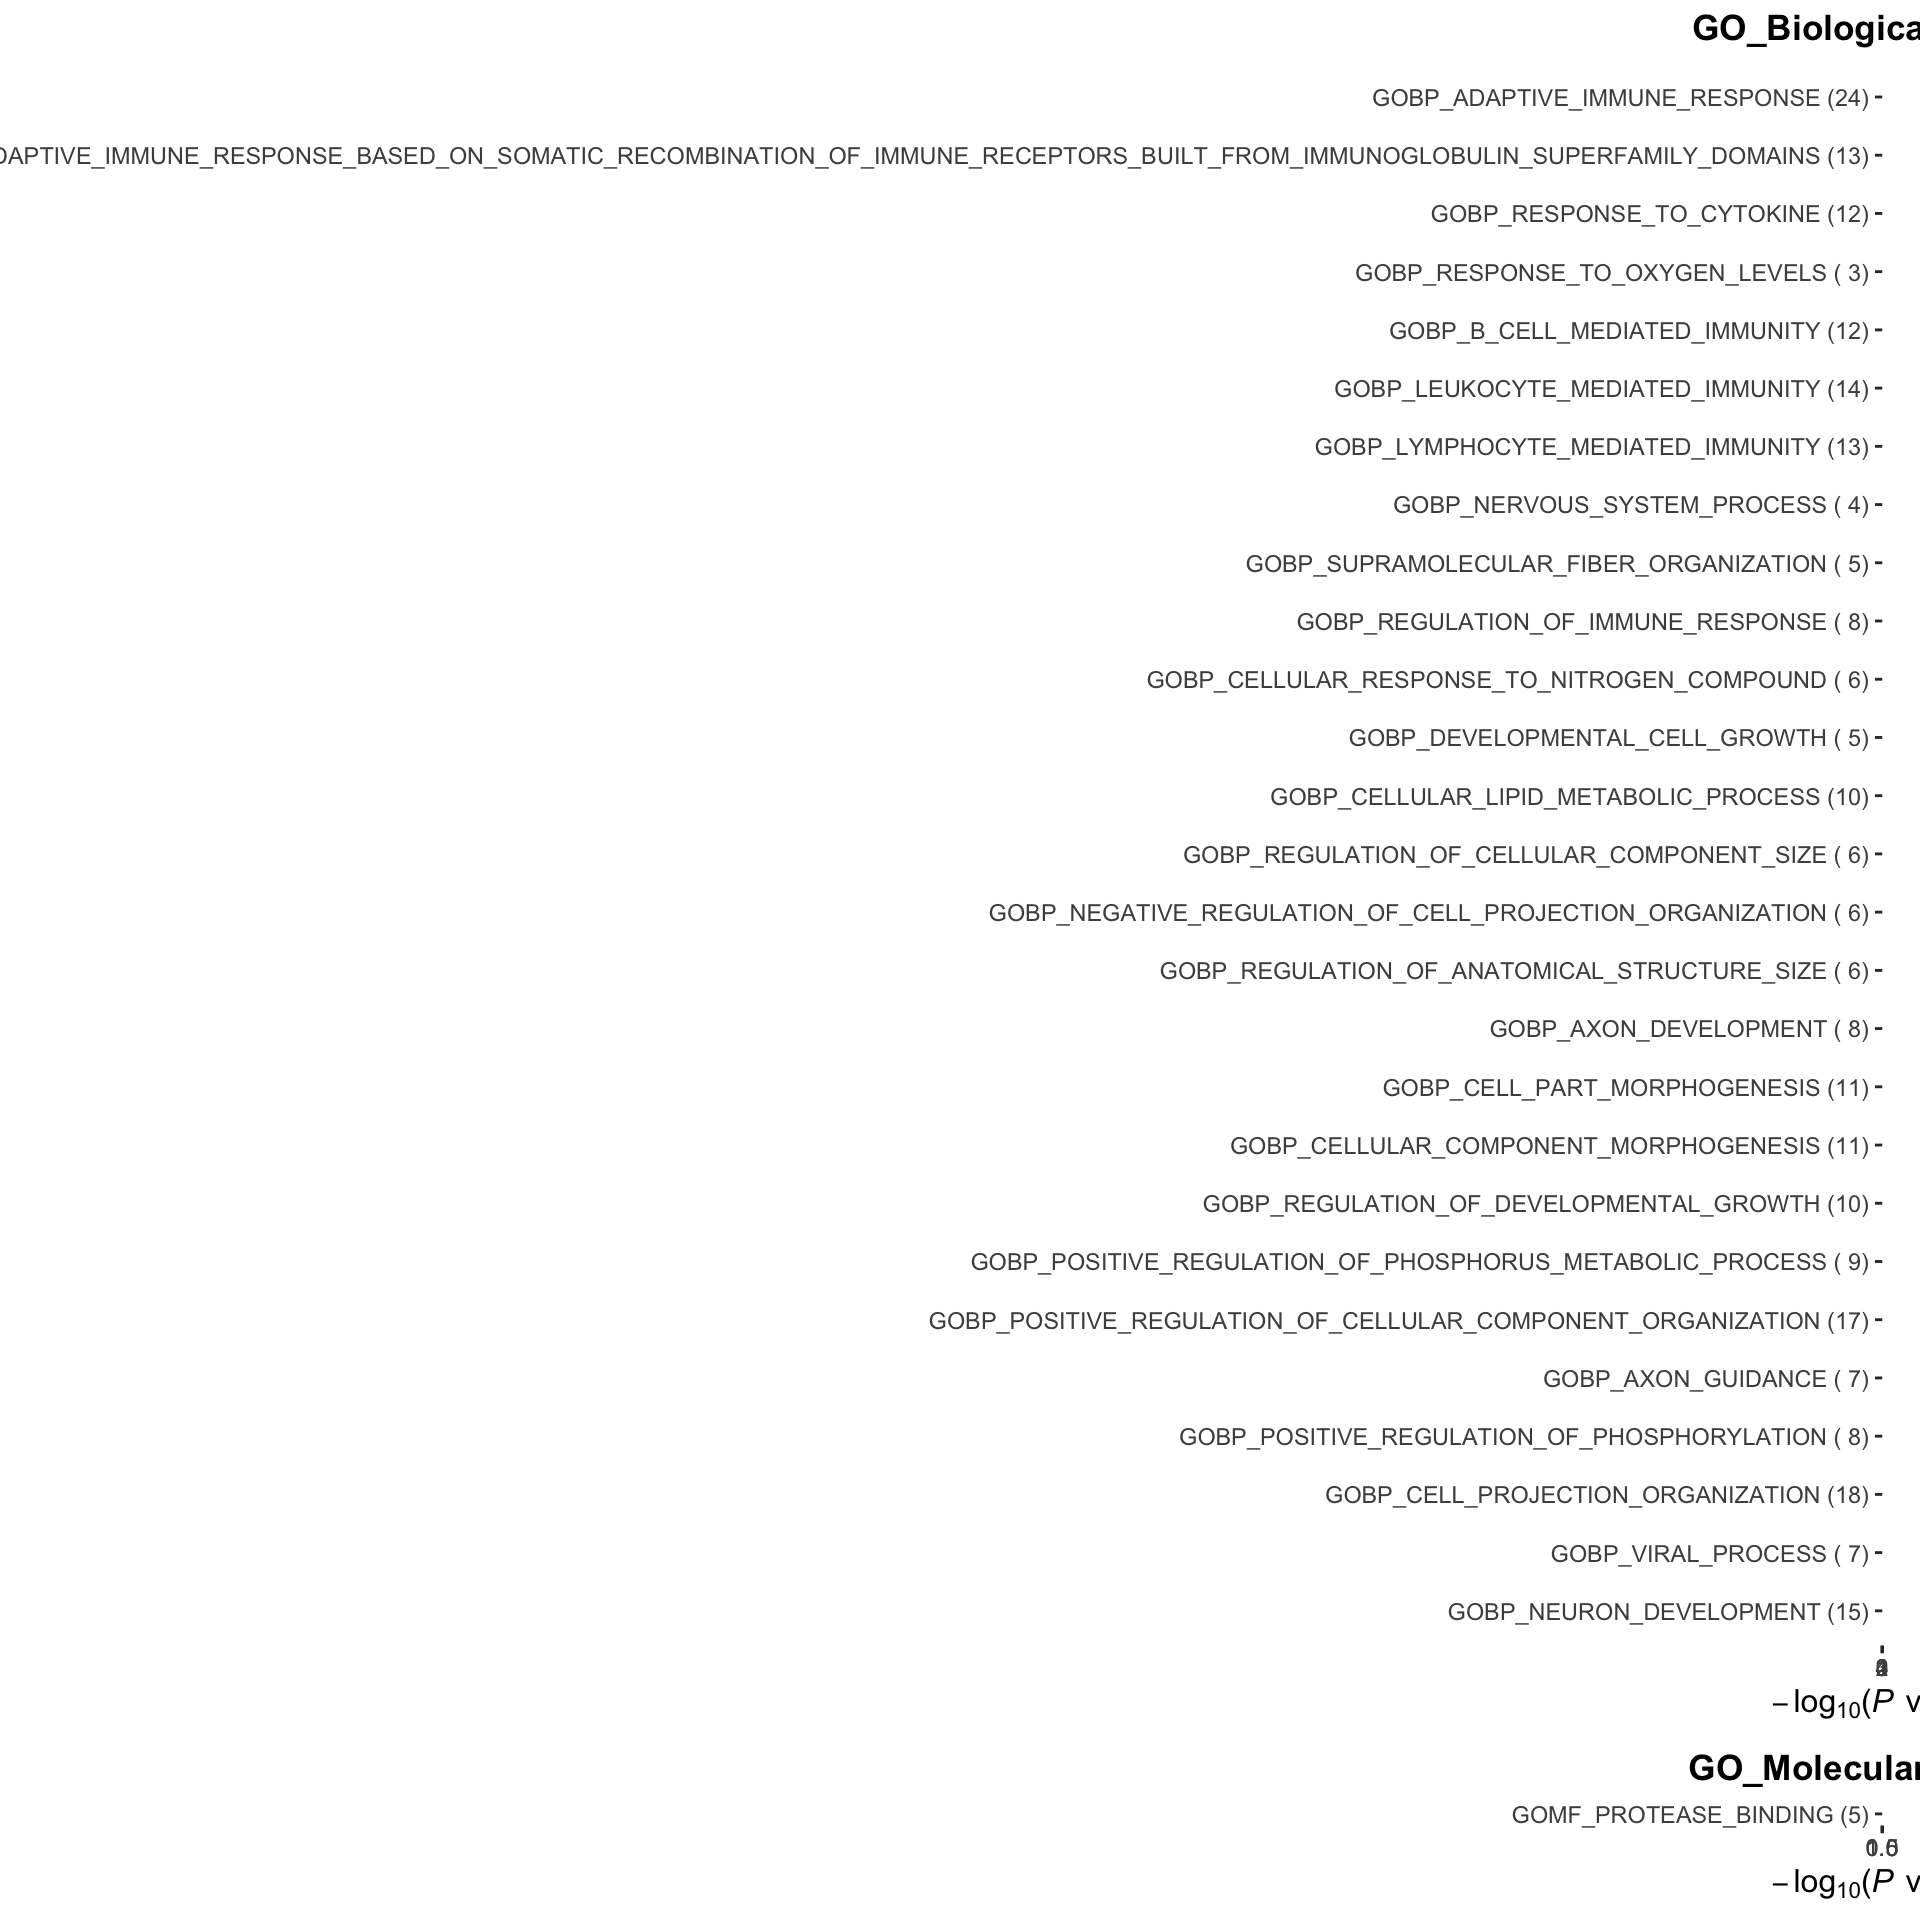
At endpoint (visit 10)
Subsetting
#subset for patients in the placebo group
protSub <- prepareProt(seProt_corr, filterCondi = list(Treatment ="0", Visit = "10", nodeGroup="B"), perNA = 0.5)
[1] "Number of proteins: 368, number of samples: 21"#protSub <- seProt_corr[,seProt_corr$Treatment %in% 1 & seProt_corr$Visit %in% 3 & !is.na(seProt_corr$delta_UEMS)]
print("How many proteins and samples")[1] "How many proteins and samples"dim(protSub)[1] 368 21Differential expression
design <- model.matrix(~ delta_UEMS, colData(protSub))

resTab <- testDiff(protSub, design, coef = "delta_UEMS", assayName = "imputed")

allResList[["corrOutcome_visit10_controlB"]] <- resTab
hist(resTab$pval)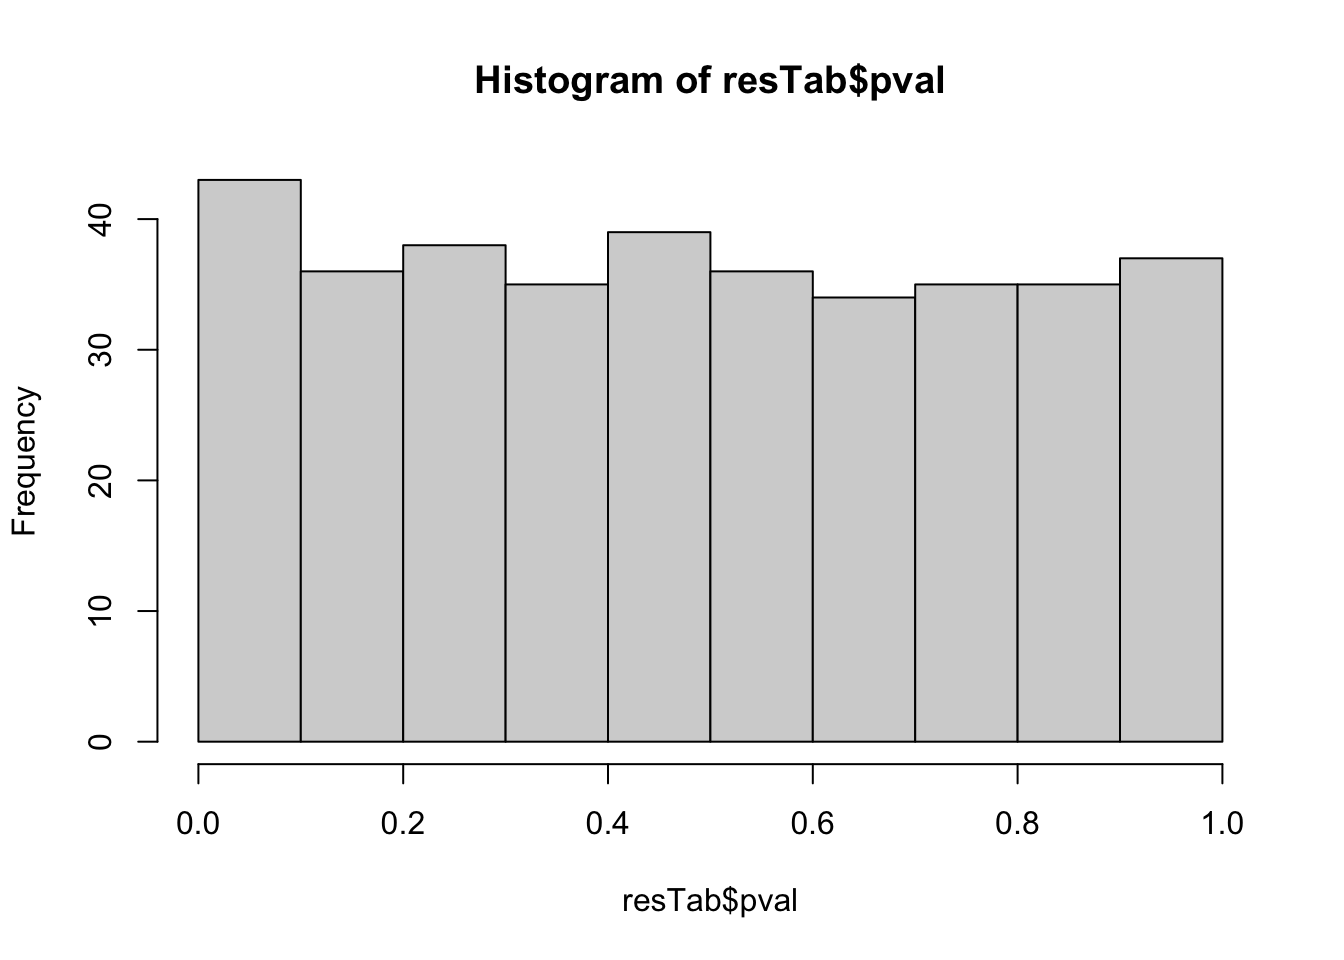
Table of proteins passed raw P-value < 0.05
filter(resTab, pval <= 0.05) %>% mutate(across(where(is.numeric), formatC, digits=2)) %>%
  select(name, symbol, pval, adj_pval, diff, n_obs) %>%
  DT::datatable()
Correlation plot
exprMat <- assays(protSub)[[2]]
pList <- lapply(seq(20), function(i) {
    rec <- resTab[i,]
    plotTab <- tibble(expr = exprMat[rec$name,],
                      nodeGroup = protSub$nodeGroup,
                      delta_UEMS = protSub$delta_UEMS)
    ggplot(plotTab, aes(x=delta_UEMS, y=expr)) +
        geom_point(aes(col = nodeGroup)) +
        ggtitle(sprintf("%s (P=%s)",rec$symbol,formatC(rec$pval, digits = 2))) +
        #scale_color_gradient(low="green",high="red") +
        geom_smooth(method = "lm") +
        theme_bw() +
        theme(plot.title = element_text(hjust = 0.5, face = "bold"))
})

cowplot::plot_grid(plotlist = pList, ncol=4)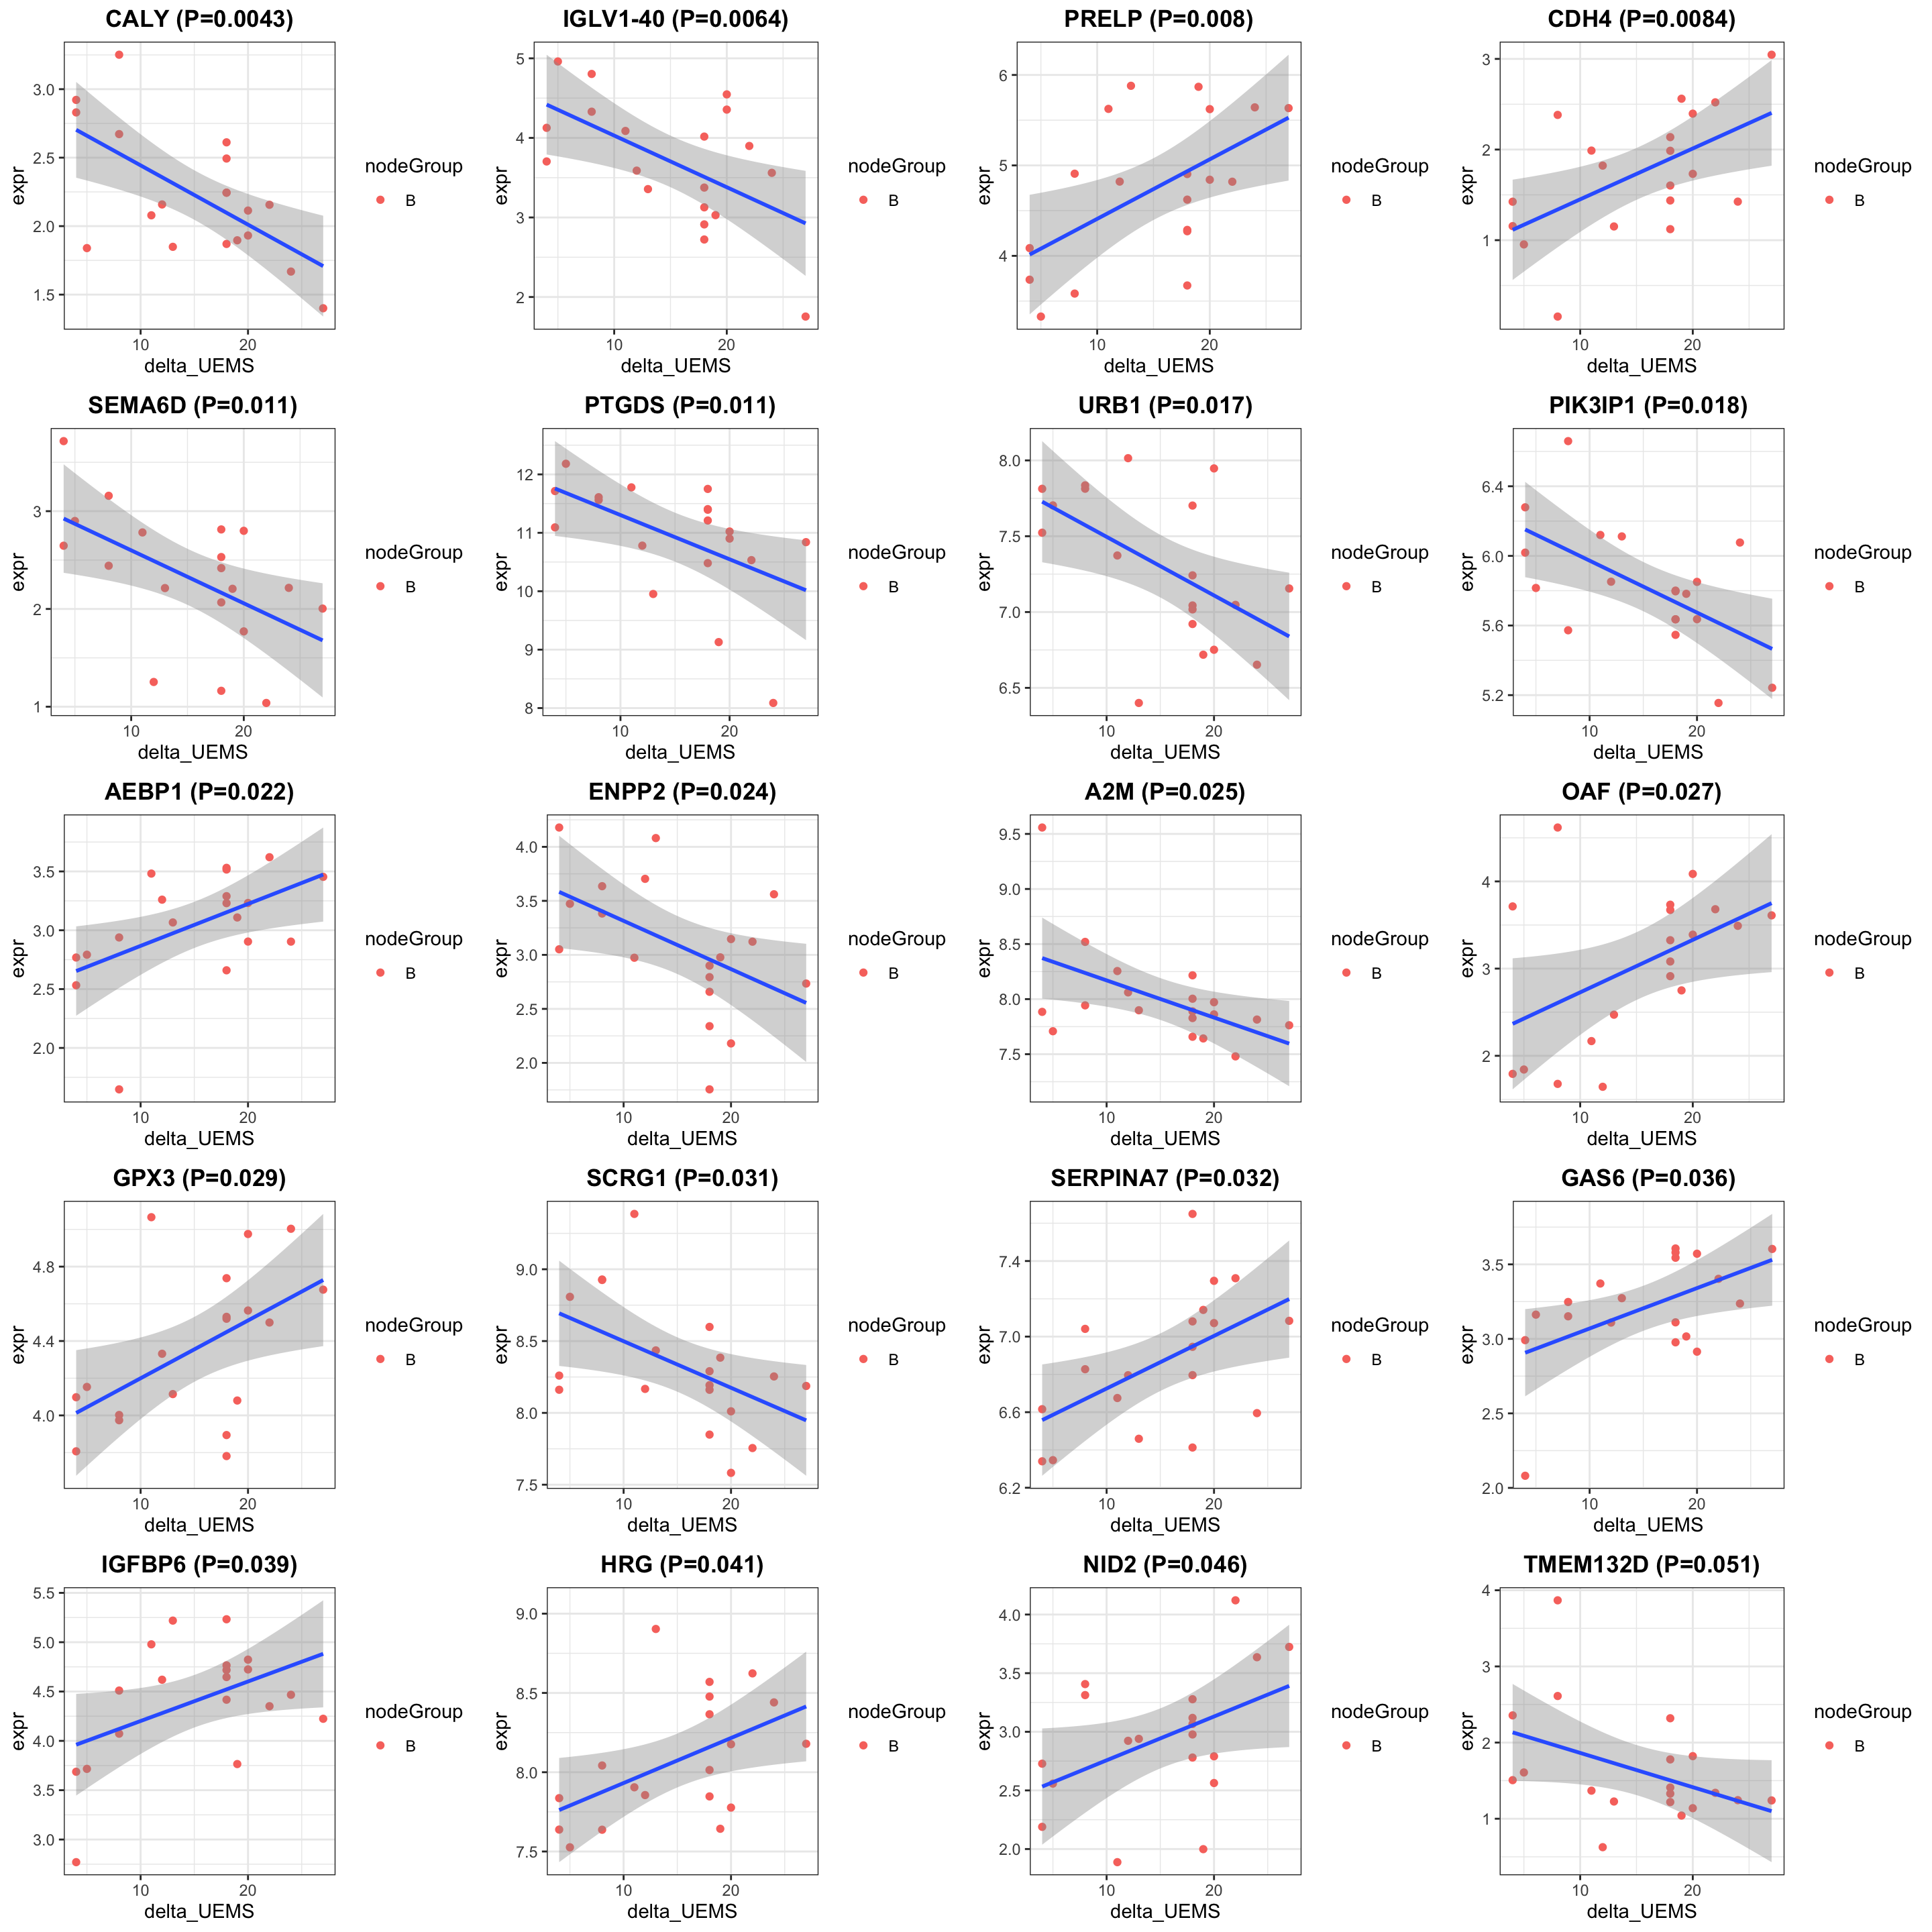
Enrichment analysis
gmts = list(GO_BiologicalProcess = "../data/gmts/c5.go.bp.v2023.2.Hs.symbols.gmt",
            GO_MolecularFunction = "../data/gmts/c5.go.mf.v2023.2.Hs.symbols.gmt")
plotList <- runGeneSetEnrichment(resTab, gmts, genePCut  = 1, pCutSet = 0.05, setFdr = FALSE, method = "gsea")
plotList$plot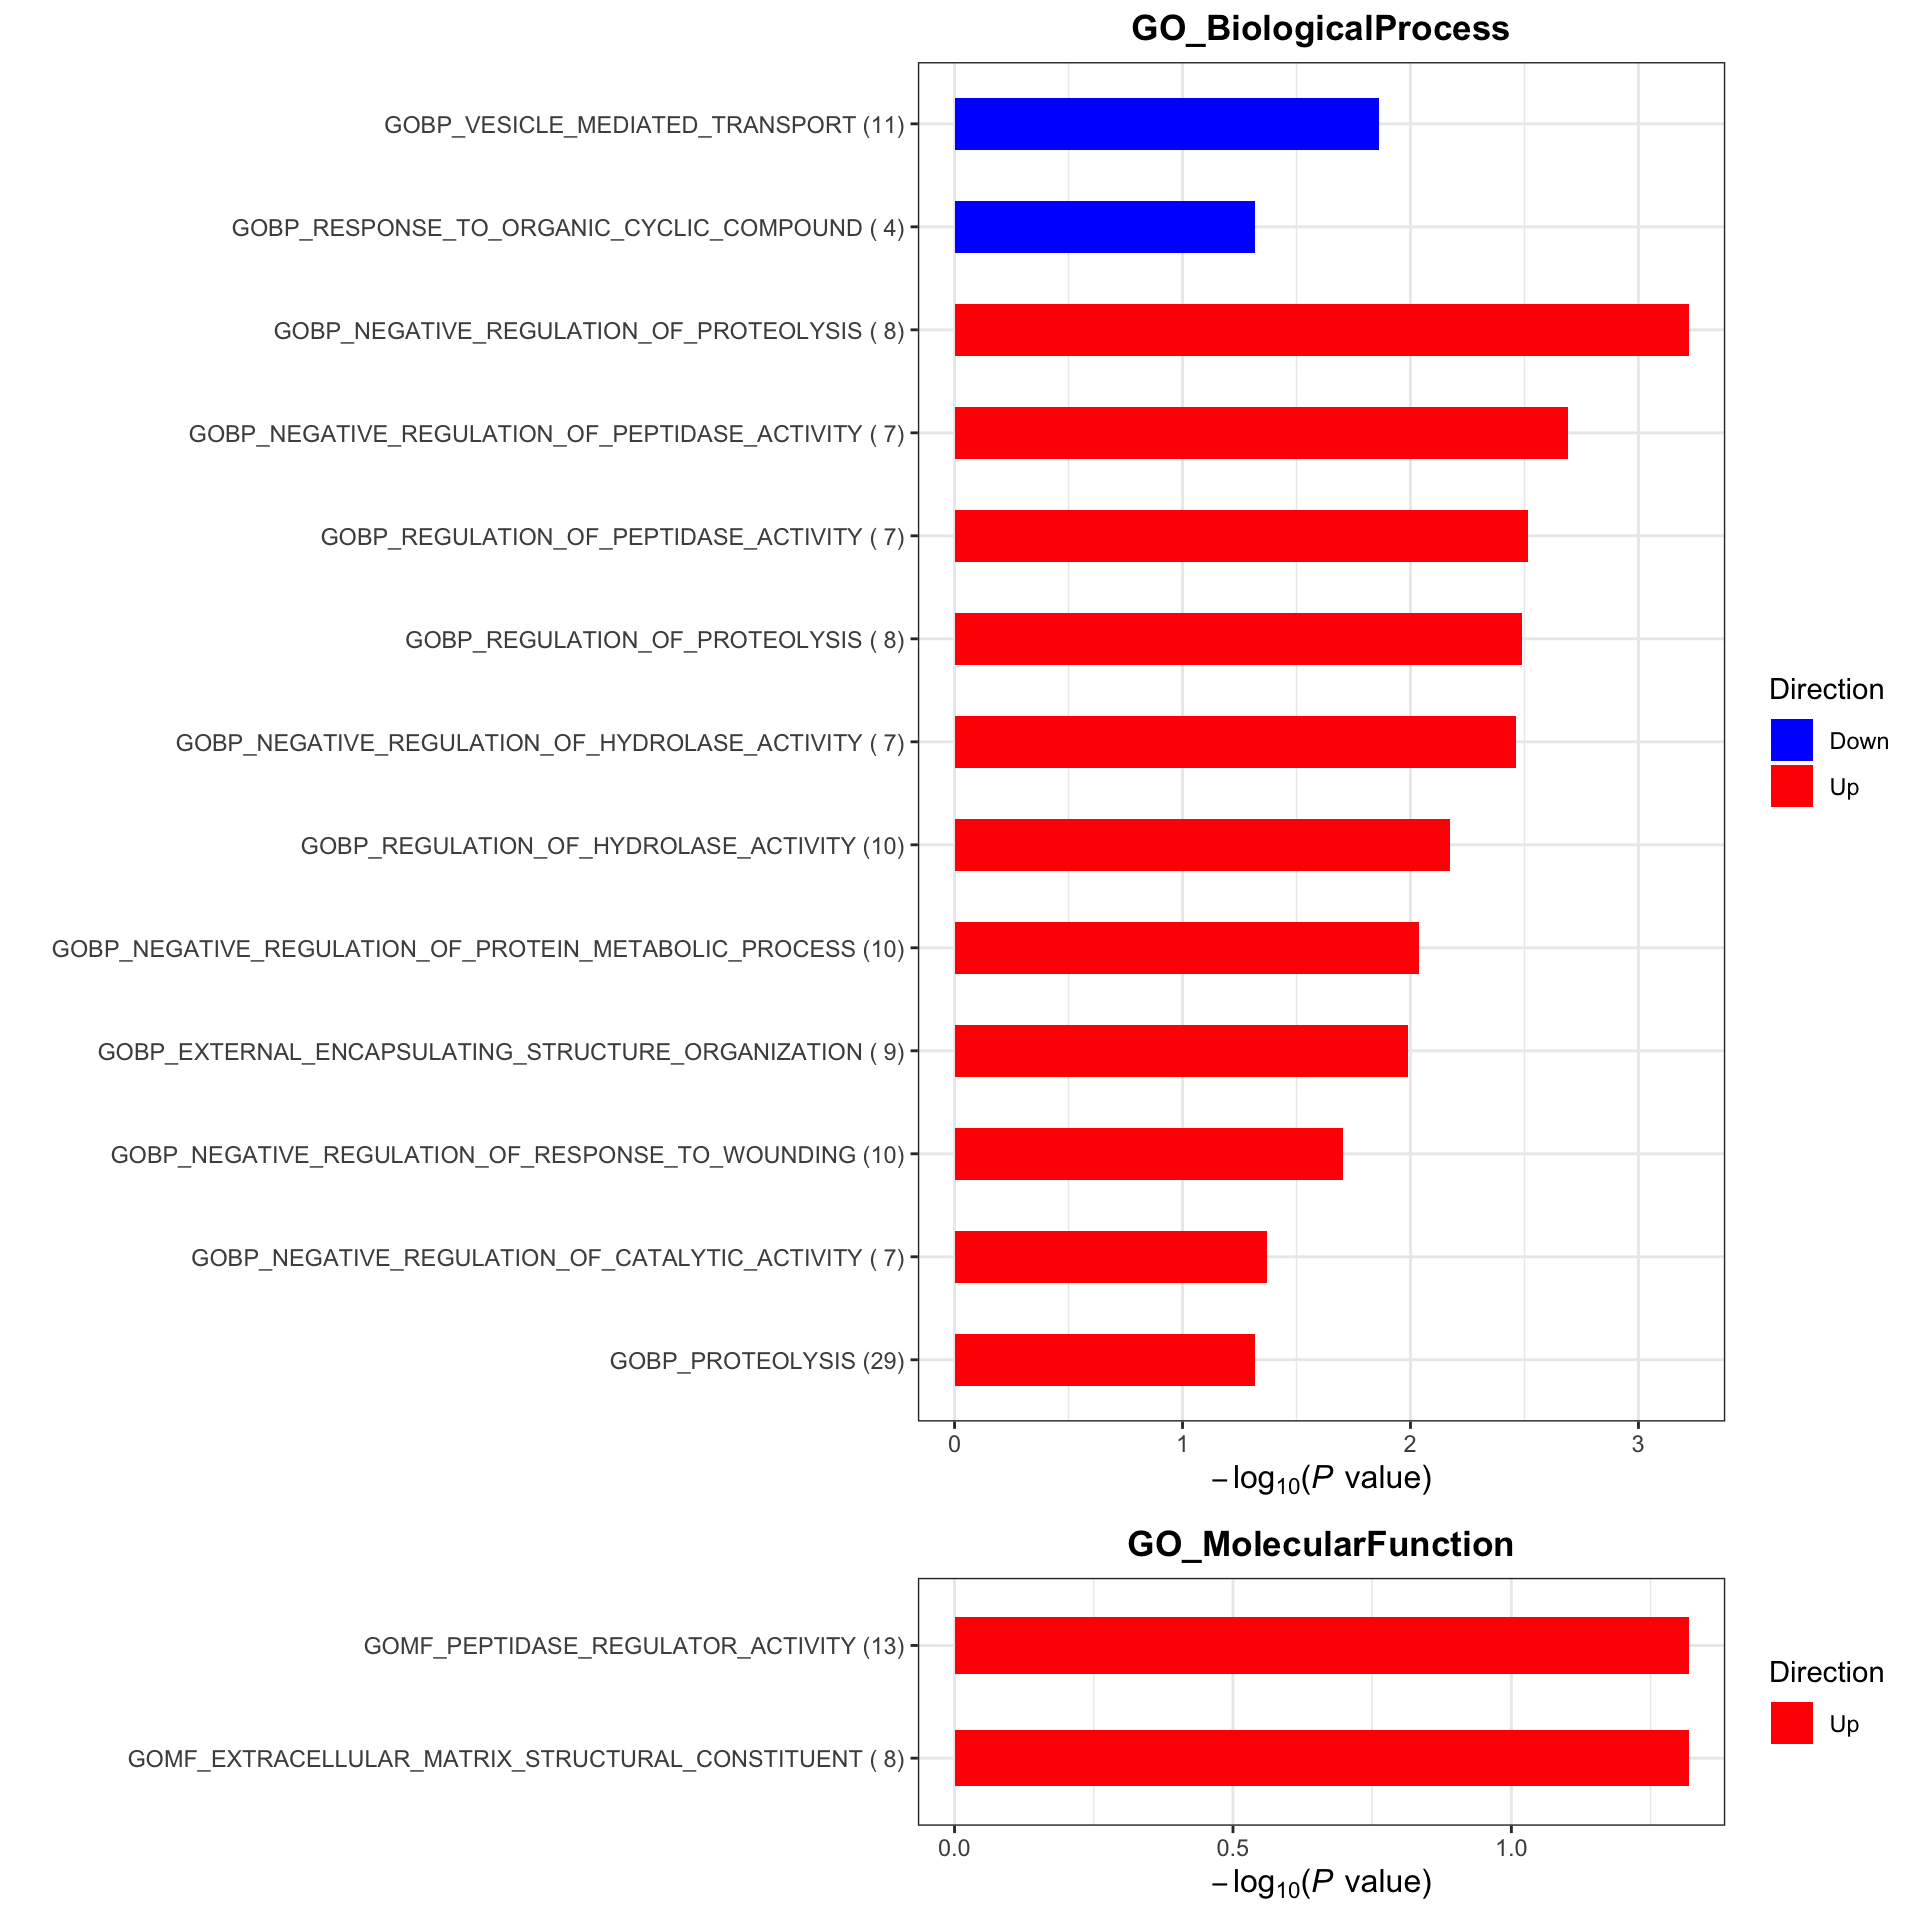
Change between baseline and visit 8 (visit 8 - visit3)
Subsetting
#subset for patients in the placebo group
protSub <- prepareProt(seProt_corr, filterCondi = list(Treatment = "0", Visit = c(3,8), nodeGroup="B"), perNA = 0.5)
[1] "Number of proteins: 375, number of samples: 47"protSub.before <- protSub[, protSub$Visit %in% 3 & !is.na(protSub$delta_UEMS)]
protSub.after <- protSub[,protSub$Visit %in% 8 & !is.na(protSub$delta_UEMS)]
overPat <- intersect(protSub.after$PSN, protSub.before$PSN)
protSub.before <- protSub.before[,match(overPat, protSub.before$PSN)]
protSub.after <- protSub.after[,match(overPat, protSub.after$PSN)]
colnames(protSub.after) <- overPat
colnames(protSub.before) <- overPat
protSub <- protSub.before
assays(protSub)[[1]] <- assays(protSub.after)[[1]] - assays(protSub.before)[[1]]
assays(protSub)[[2]] <- assays(protSub.after)[[2]] - assays(protSub.before)[[2]]
#remove feature with too many missings
#protSub <- protSub[rowSums(is.na(assay(protSub)))/ncol(protSub) < 0.5,]
print("How many proteins and samples")[1] "How many proteins and samples"dim(protSub)[1] 375 21Differential expression
design <- model.matrix(~ delta_UEMS, colData(protSub))

resTab <- testDiff(protSub, design, coef = "delta_UEMS", assayName = "imputed")

allResList[["corrOutcome_diff83_controlB"]] <- resTab

hist(resTab$pval)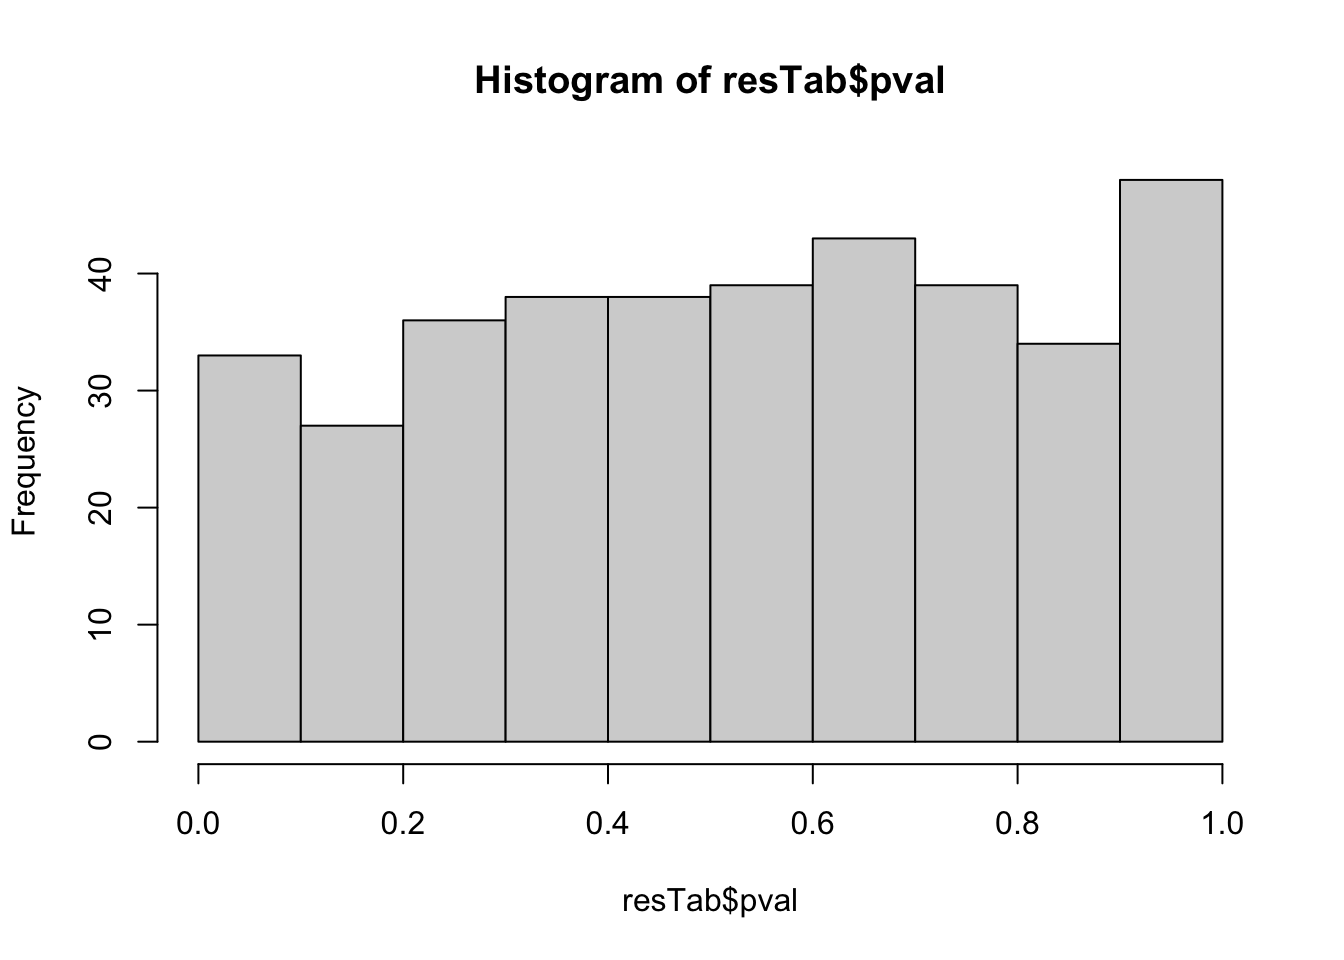
Table of proteins passed raw P-value < 0.05
filter(resTab, pval <= 0.05) %>% mutate(across(where(is.numeric), formatC, digits=2)) %>%
  select(name, symbol, pval, adj_pval, diff) %>%
  DT::datatable()
Correlation plot
exprMat <- assays(protSub)[[2]]
pList <- lapply(seq(20), function(i) {
    rec <- resTab[i,]
    plotTab <- tibble(expr = exprMat[rec$name,],
                      nodeGroup = protSub$nodeGroup,
                      delta_UEMS = protSub$delta_UEMS)
    ggplot(plotTab, aes(x=delta_UEMS, y=expr)) +
        geom_point(aes(col = nodeGroup)) +
        ggtitle(sprintf("%s (P=%s)",rec$symbol,formatC(rec$pval, digits = 2))) +
        #scale_color_gradient(low="green",high="red") +
        geom_smooth(method = "lm") +
        theme_bw() +
        theme(plot.title = element_text(hjust = 0.5, face = "bold"))
})

cowplot::plot_grid(plotlist = pList, ncol=4)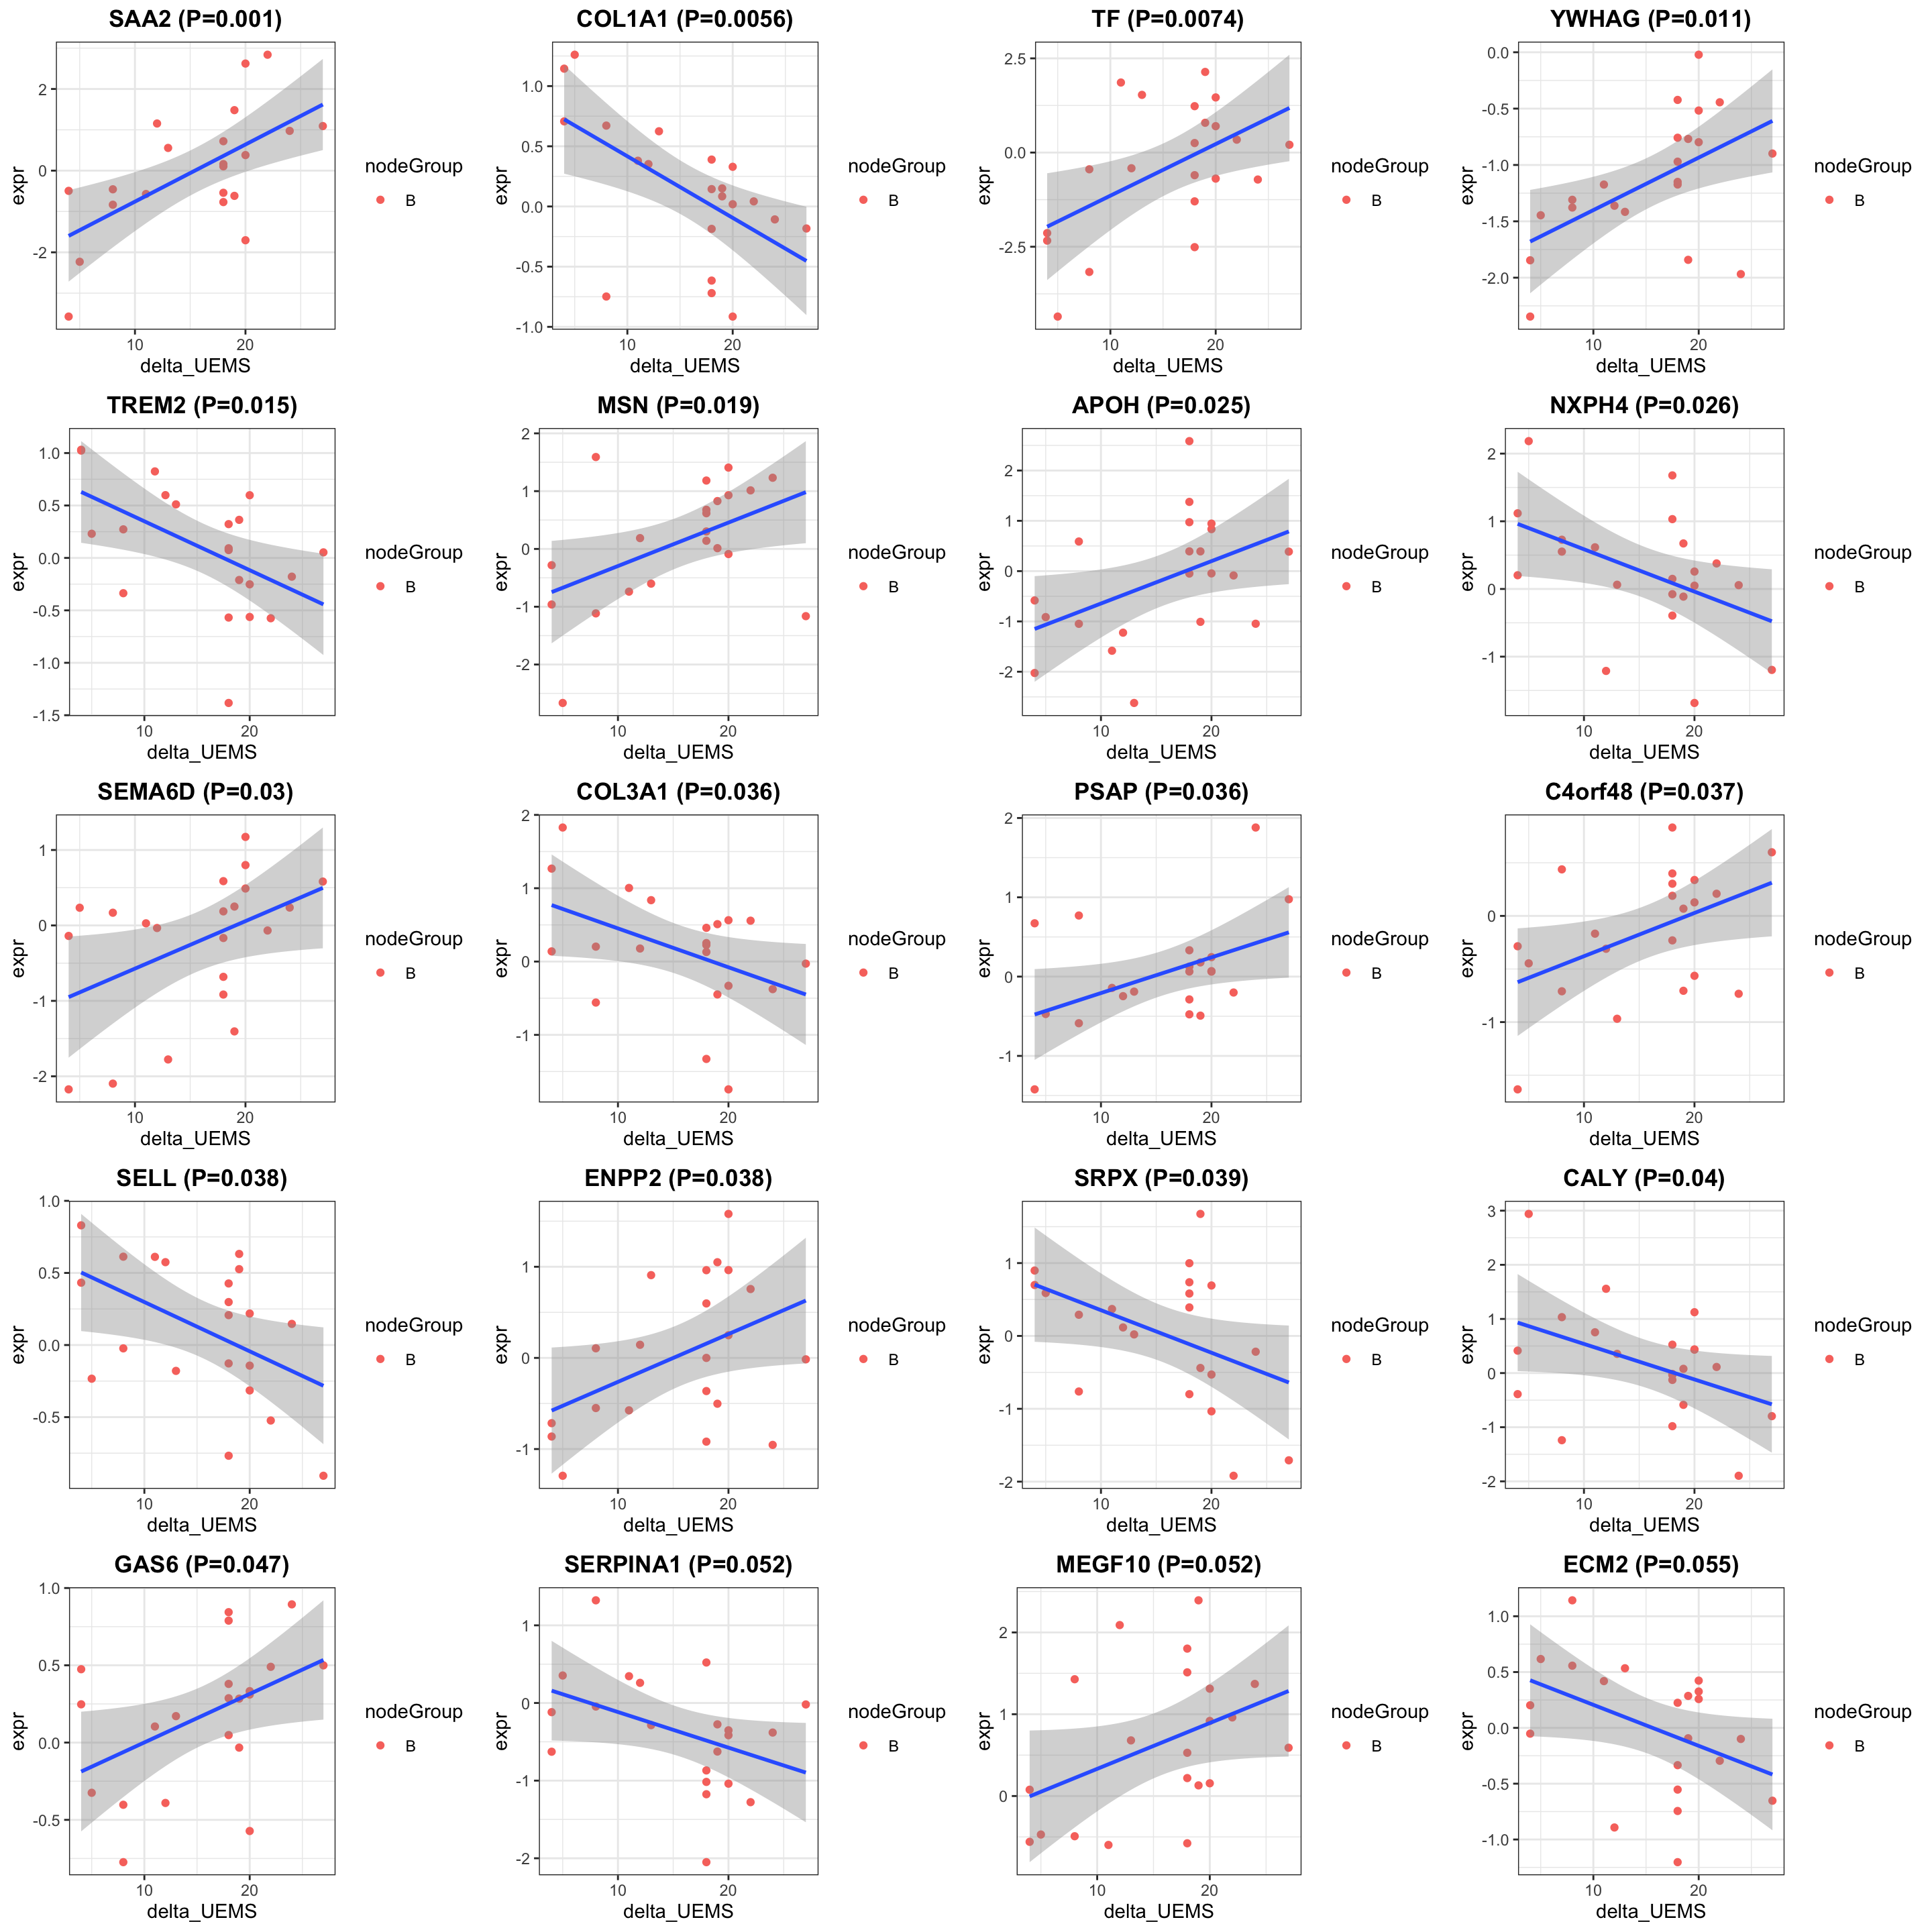
Enrichment analysis
gmts = list(GO_BiologicalProcess = "../data/gmts/c5.go.bp.v2023.2.Hs.symbols.gmt",
            GO_MolecularFunction = "../data/gmts/c5.go.mf.v2023.2.Hs.symbols.gmt")
plotList <- runGeneSetEnrichment(resTab, gmts, genePCut  = 1, pCutSet = 0.05, setFdr = FALSE, method = "gsea")
plotList$plot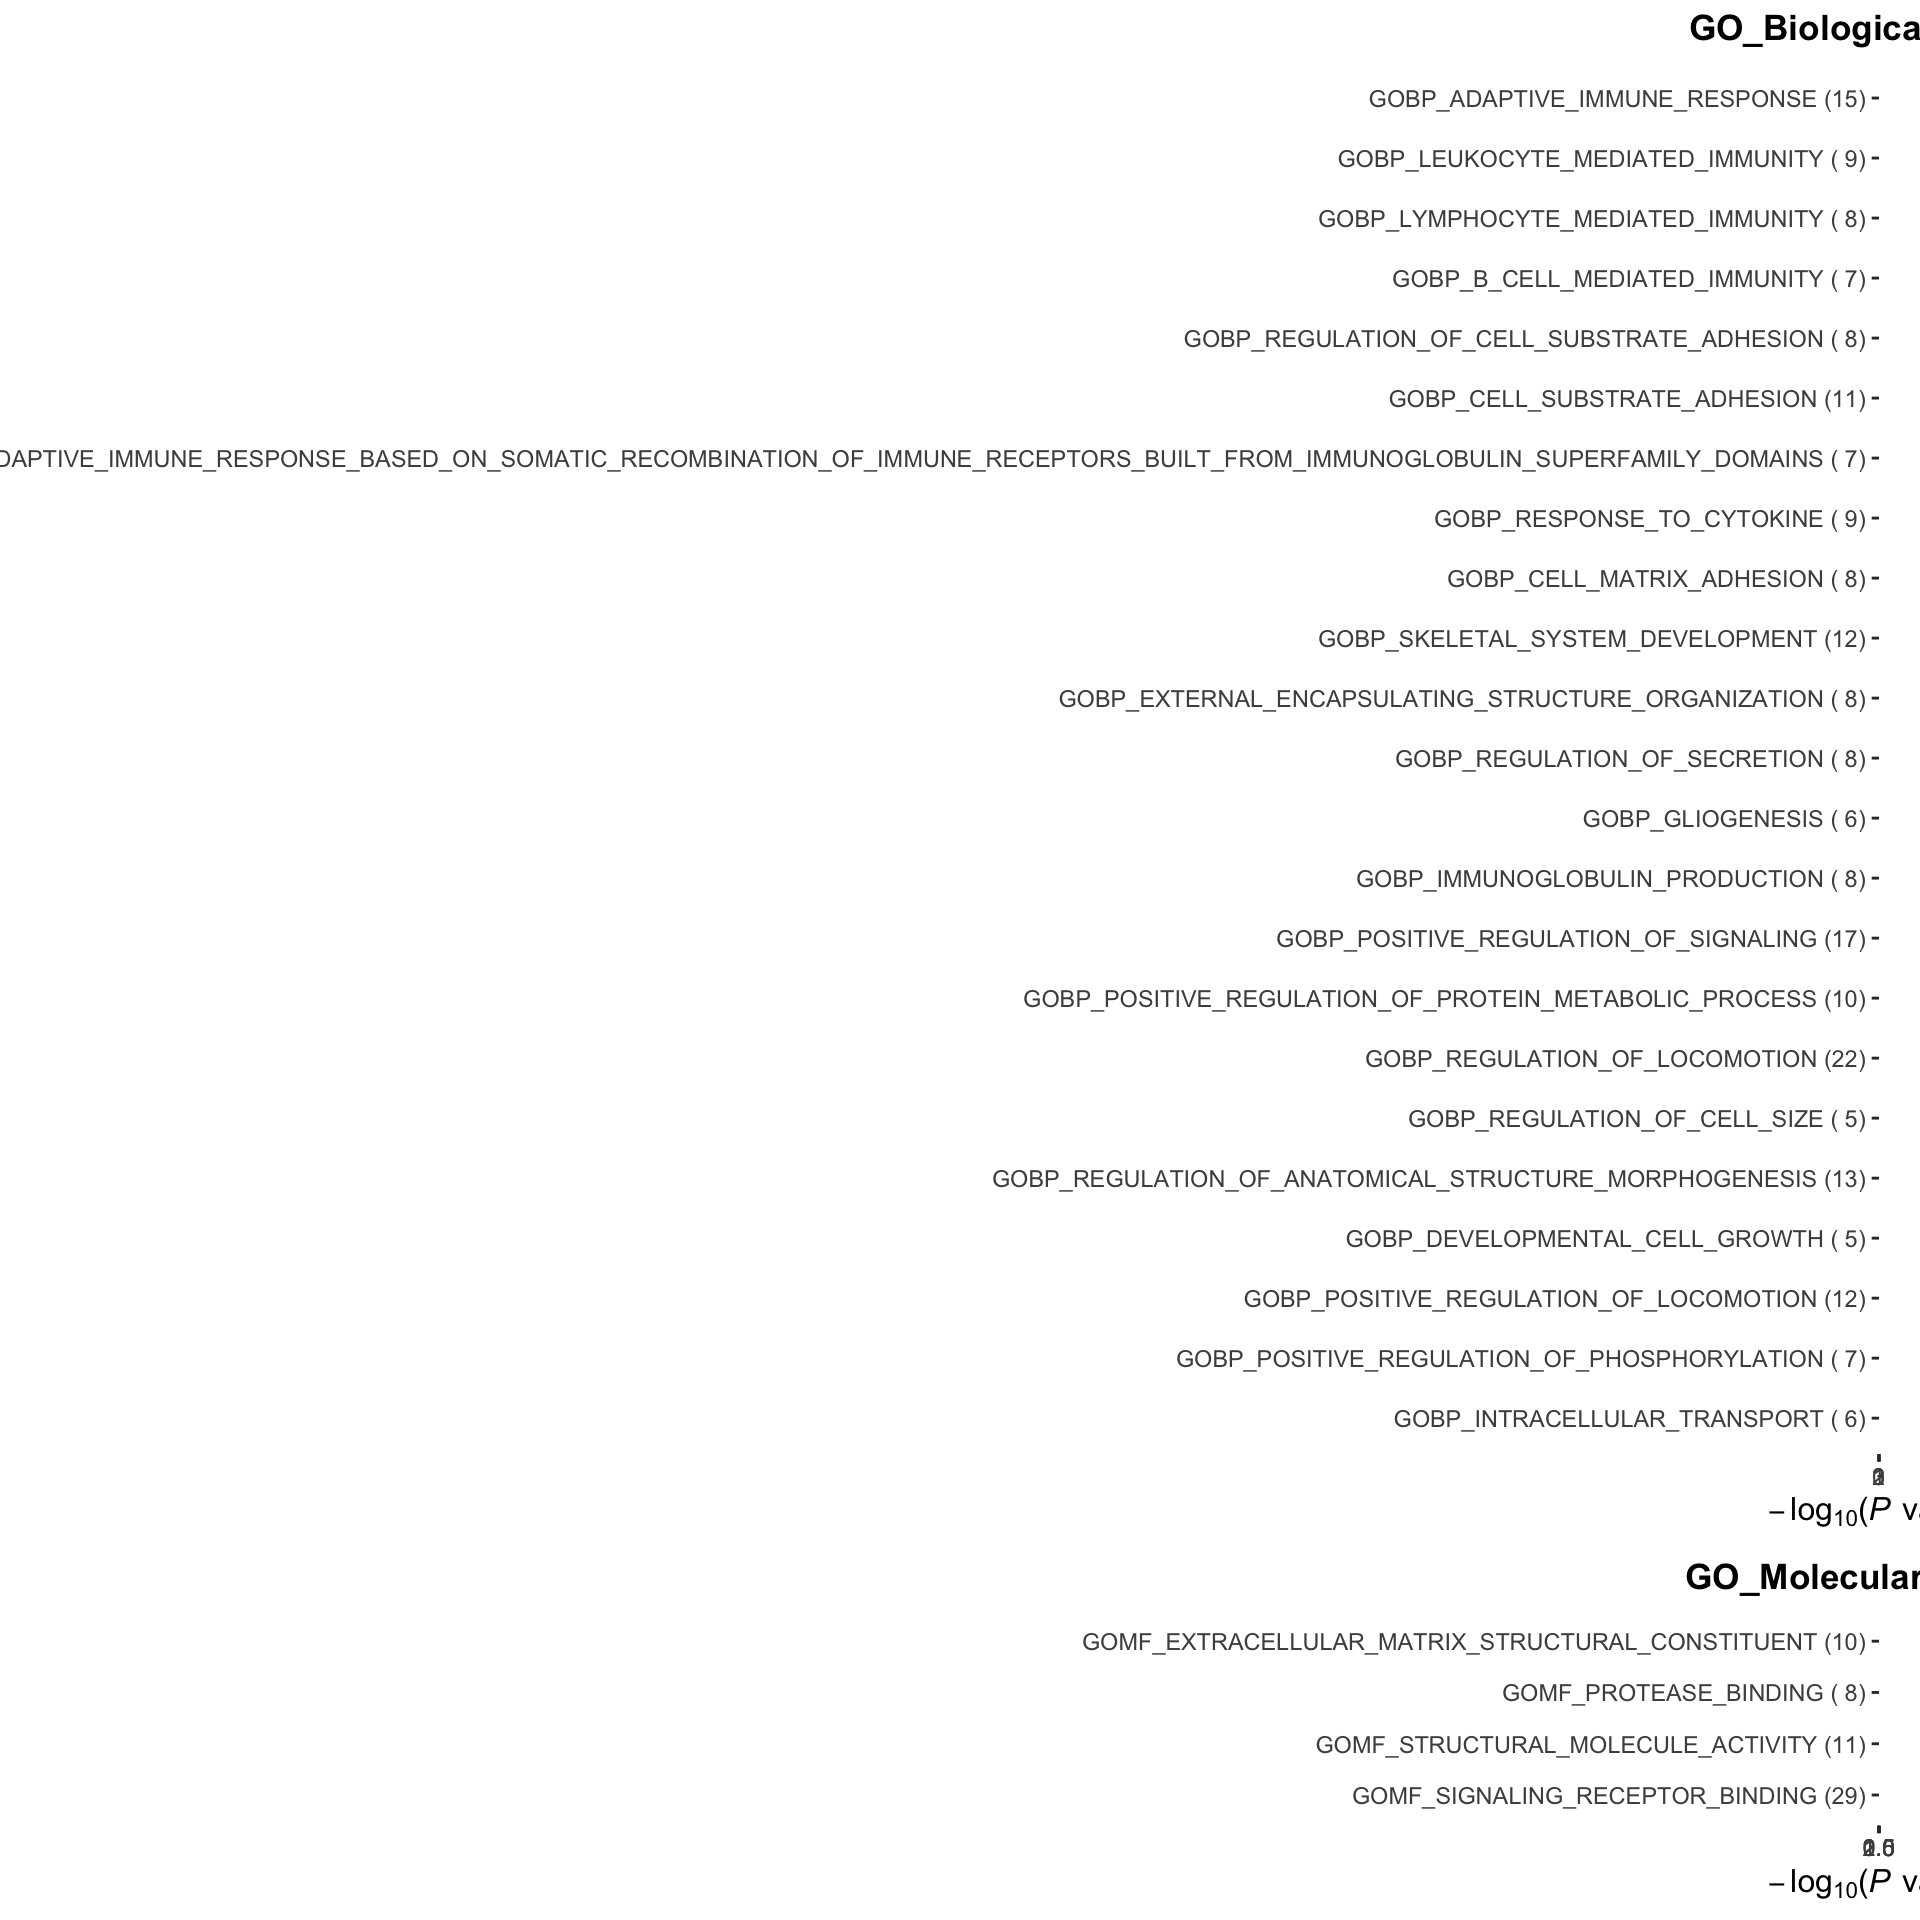
Compare the results between treated and untreated
This may help identify treatment specific protein changes
Baseline
treatTab <- allResList$corrOutcome_baseline_treated %>%
    mutate(condi = "treated")
controlTab <- allResList$corrOutcome_baseline_control %>%
    mutate(condi = "control")

compareTab <- bind_rows(treatTab, controlTab)
fcTab <- select(compareTab, name, symbol, diff, condi) %>%
    pivot_wider(names_from = condi, values_from = diff) %>%
    dplyr::rename(coef_treated = treated, coef_control = control)
pTab <-  select(compareTab, name, symbol, pval, condi) %>%
    pivot_wider(names_from = condi, values_from = pval)%>%
    dplyr::rename(p_treated = treated, p_control = control)

plotTab <- left_join(fcTab, pTab, by = c("name","symbol")) %>%
    mutate(sig = case_when(
        p_treated < 0.05 & p_control < 0.05 ~ "both",
        p_treated < 0.05 & p_control > 0.05 ~ "only_treated",
        p_treated > 0.05 & p_control < 0.05 ~ "only_control",
        TRUE ~ "none",

    ))

ggplot(plotTab, aes(x=coef_control, y = coef_treated)) +
    geom_point(aes(color = sig)) +
    geom_abline(slope = 1, intercept = 0, color = "red", linetype ="dashed") +
    xlim(-0.06,0.06) +
    ylim(-0.06,0.06) +
    scale_color_manual(values = list(none = "grey", both = "green", only_treated = "red", only_control = "blue")) +
    ggrepel::geom_text_repel(data = filter(plotTab, sig != "none"), aes(label = symbol, color = sig)) +
theme_full 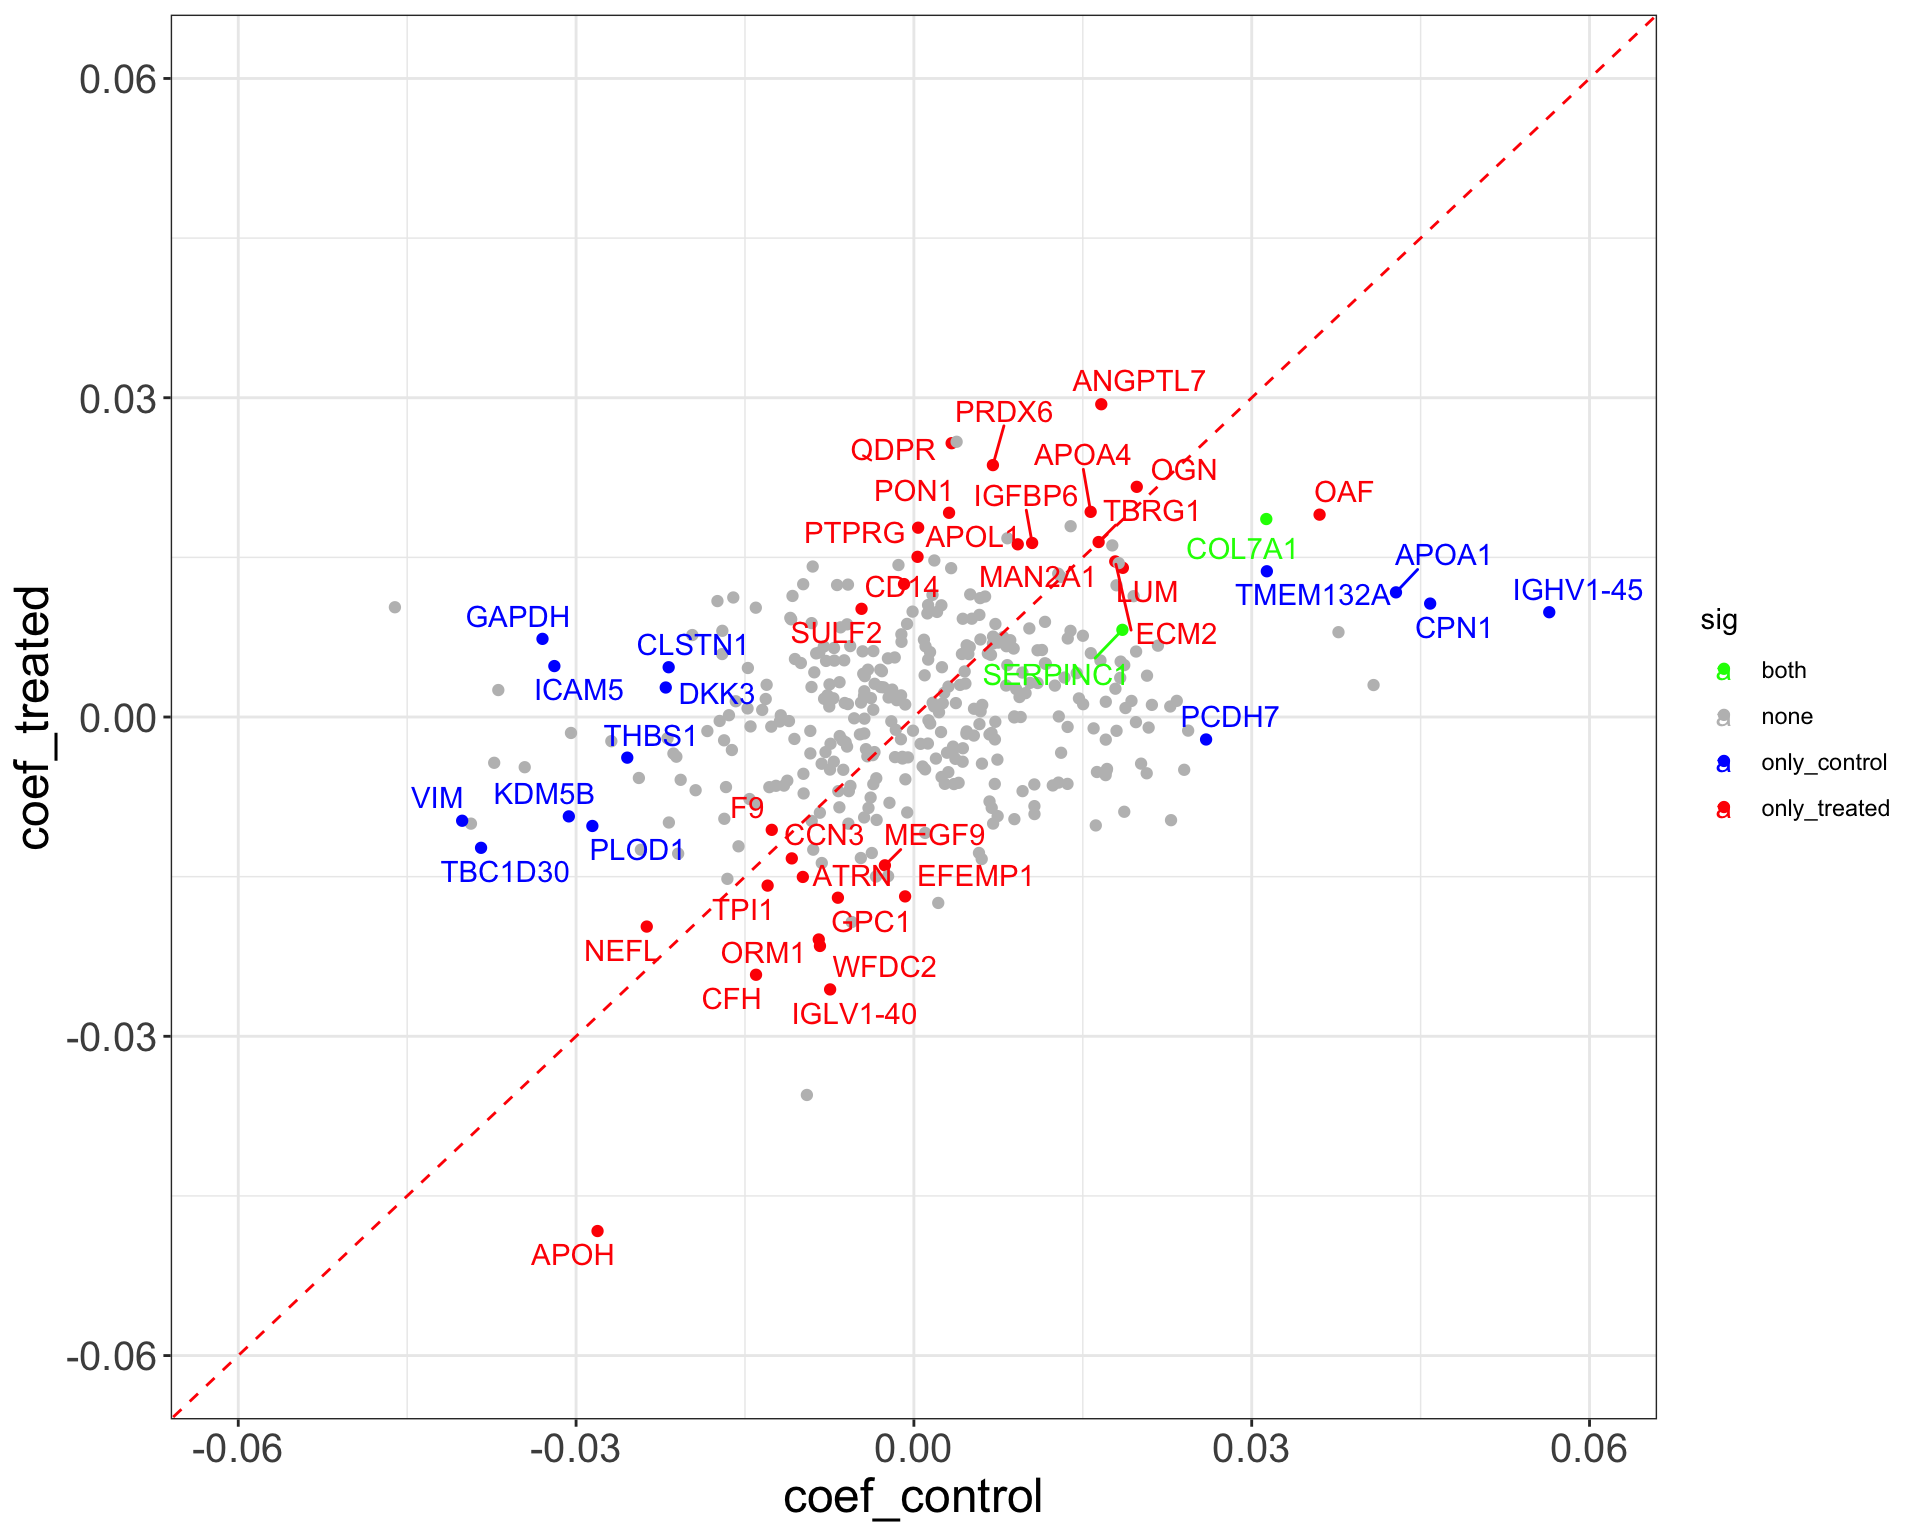
Visit 8
treatTab <- allResList$corrOutcome_visit8_treated %>%
    mutate(condi = "treated")
controlTab <- allResList$corrOutcome_visit8_control %>%
    mutate(condi = "control")

compareTab <- bind_rows(treatTab, controlTab)
fcTab <- select(compareTab, name, symbol, diff, condi) %>%
    pivot_wider(names_from = condi, values_from = diff) %>%
    dplyr::rename(coef_treated = treated, coef_control = control)
pTab <-  select(compareTab, name, symbol, pval, condi) %>%
    pivot_wider(names_from = condi, values_from = pval)%>%
    dplyr::rename(p_treated = treated, p_control = control)

plotTab <- left_join(fcTab, pTab, by = c("name","symbol")) %>%
    mutate(sig = case_when(
        p_treated < 0.05 & p_control < 0.05 ~ "both",
        p_treated < 0.05 & p_control > 0.05 ~ "only_treated",
        p_treated > 0.05 & p_control < 0.05 ~ "only_control",
        TRUE ~ "none",

    ))

ggplot(plotTab, aes(x=coef_control, y = coef_treated)) +
    geom_point(aes(color = sig)) +
    geom_abline(slope = 1, intercept = 0, color = "red", linetype ="dashed") +
    xlim(-0.06,0.06) +
    ylim(-0.06,0.06) +
    scale_color_manual(values = list(none = "grey", both = "green", only_treated = "red", only_control = "blue")) +
    ggrepel::geom_text_repel(data = filter(plotTab, sig != "none"), aes(label = symbol, color = sig)) +
theme_full 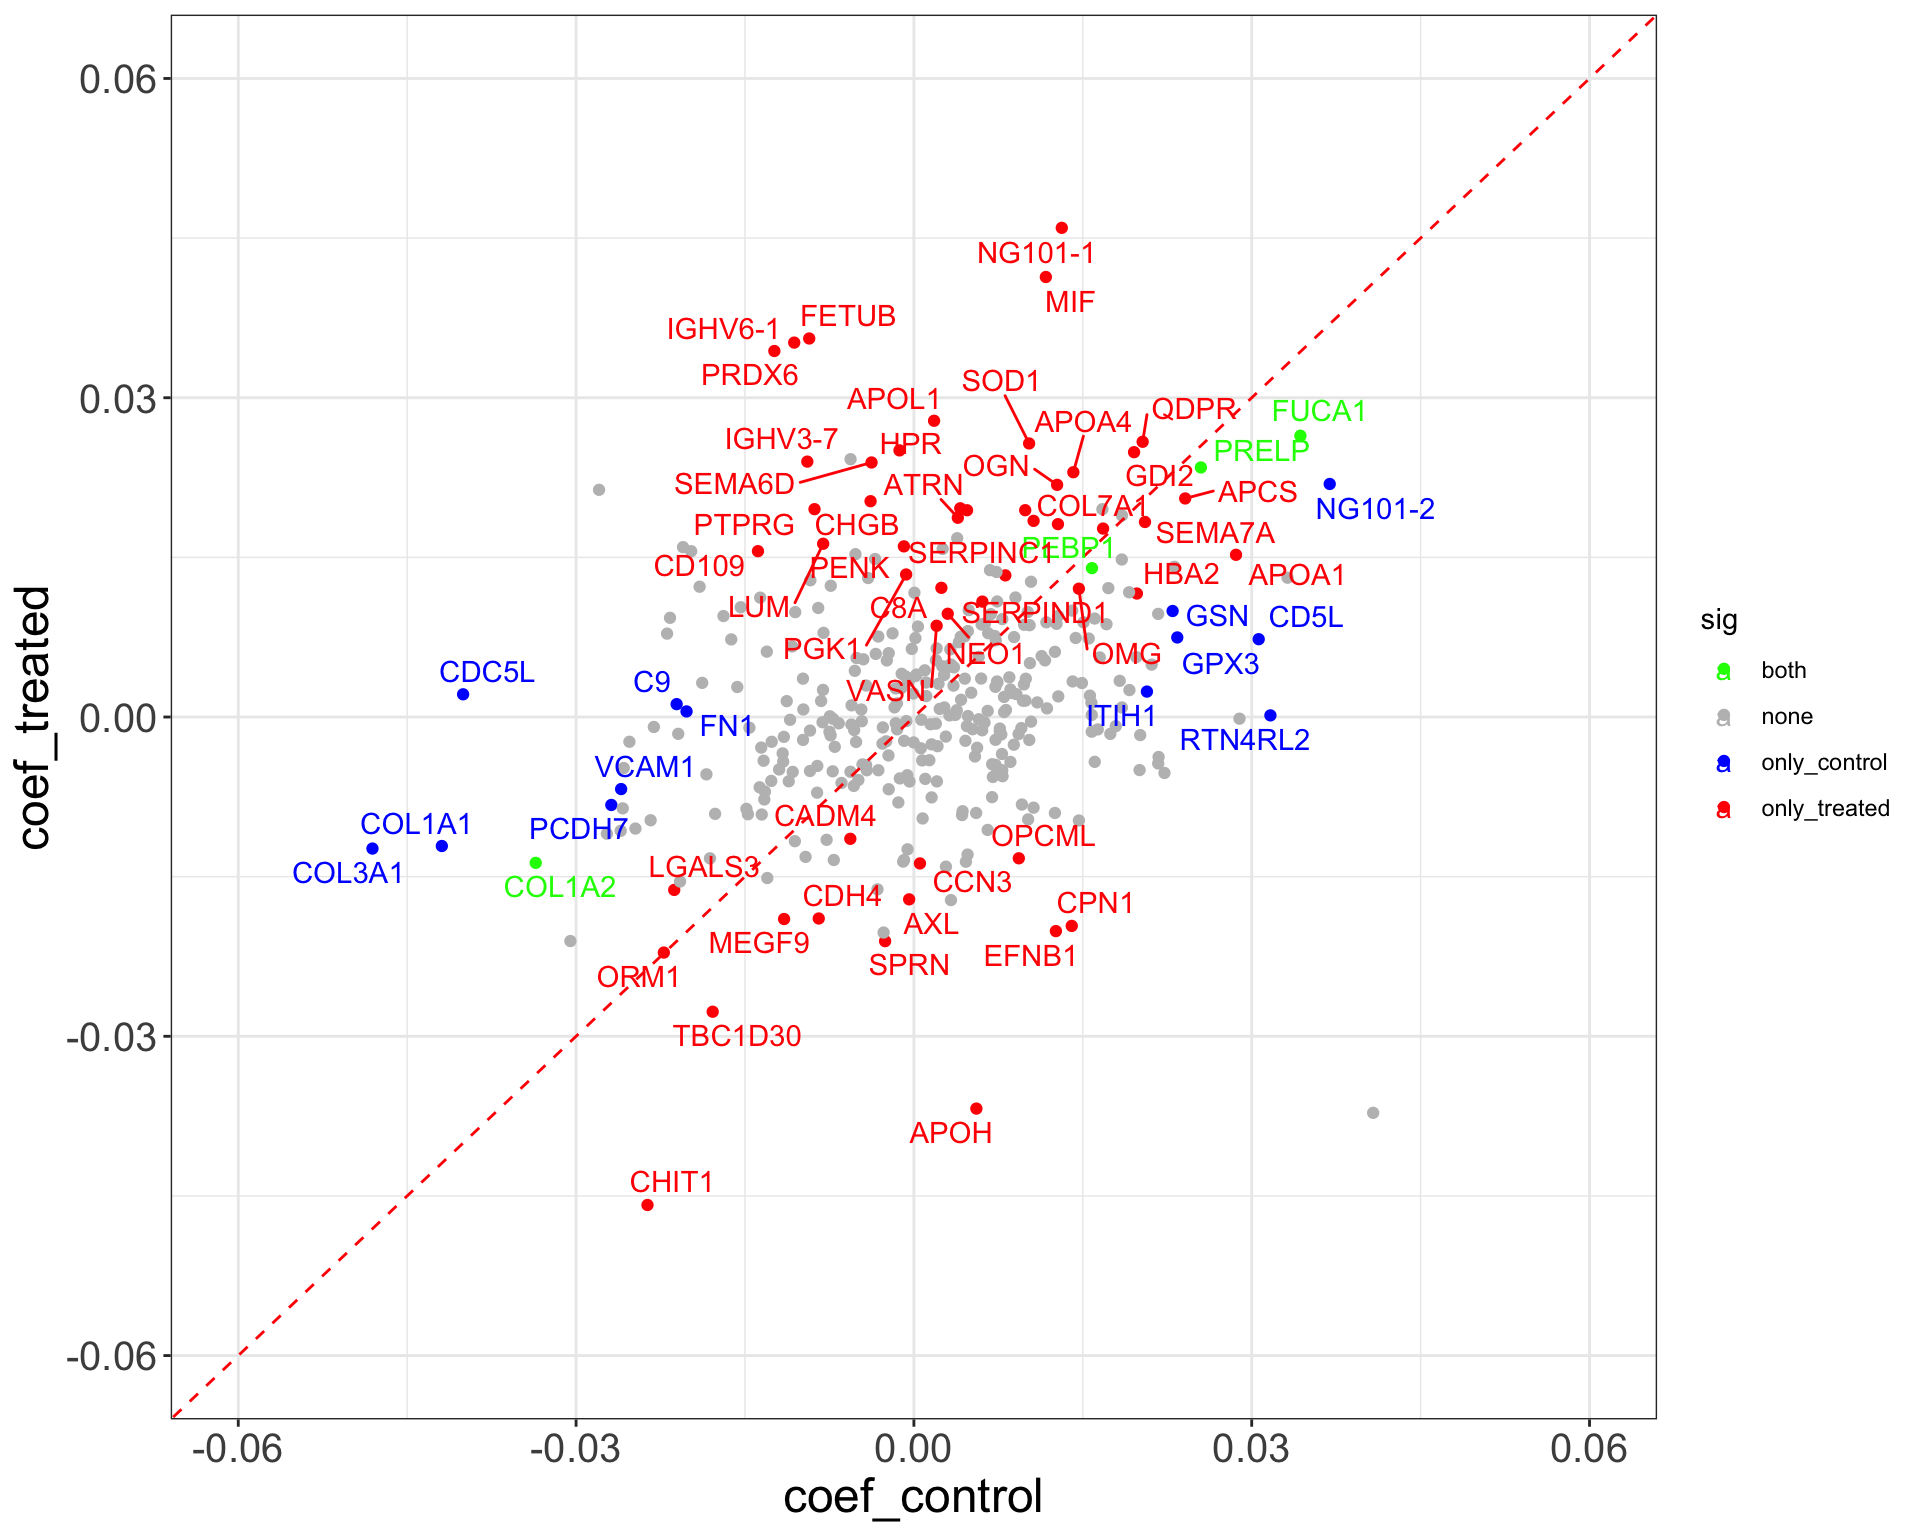
Difference between visit 8 and baseline (visit 3)
treatTab <- allResList$corrOutcome_diff83_treated %>%
    mutate(condi = "treated")
controlTab <- allResList$corrOutcome_diff83_control %>%
    mutate(condi = "control")

compareTab <- bind_rows(treatTab, controlTab)
fcTab <- select(compareTab, name, symbol, diff, condi) %>%
    pivot_wider(names_from = condi, values_from = diff) %>%
    dplyr::rename(coef_treated = treated, coef_control = control)
pTab <-  select(compareTab, name, symbol, pval, condi) %>%
    pivot_wider(names_from = condi, values_from = pval)%>%
    dplyr::rename(p_treated = treated, p_control = control)

plotTab <- left_join(fcTab, pTab, by = c("name","symbol")) %>%
    mutate(sig = case_when(
        p_treated < 0.05 & p_control < 0.05 ~ "both",
        p_treated < 0.05 & p_control > 0.05 ~ "only_treated",
        p_treated > 0.05 & p_control < 0.05 ~ "only_control",
        TRUE ~ "none",

    ))

ggplot(plotTab, aes(x=coef_control, y = coef_treated)) +
    geom_point(aes(color = sig)) +
    geom_abline(slope = 1, intercept = 0, color = "red", linetype ="dashed") +
    xlim(-0.06,0.06) +
    ylim(-0.06,0.06) +
    scale_color_manual(values = list(none = "grey", both = "green", only_treated = "red", only_control = "blue")) +
    ggrepel::geom_text_repel(data = filter(plotTab, sig != "none"), aes(label = symbol, color = sig)) +
theme_full 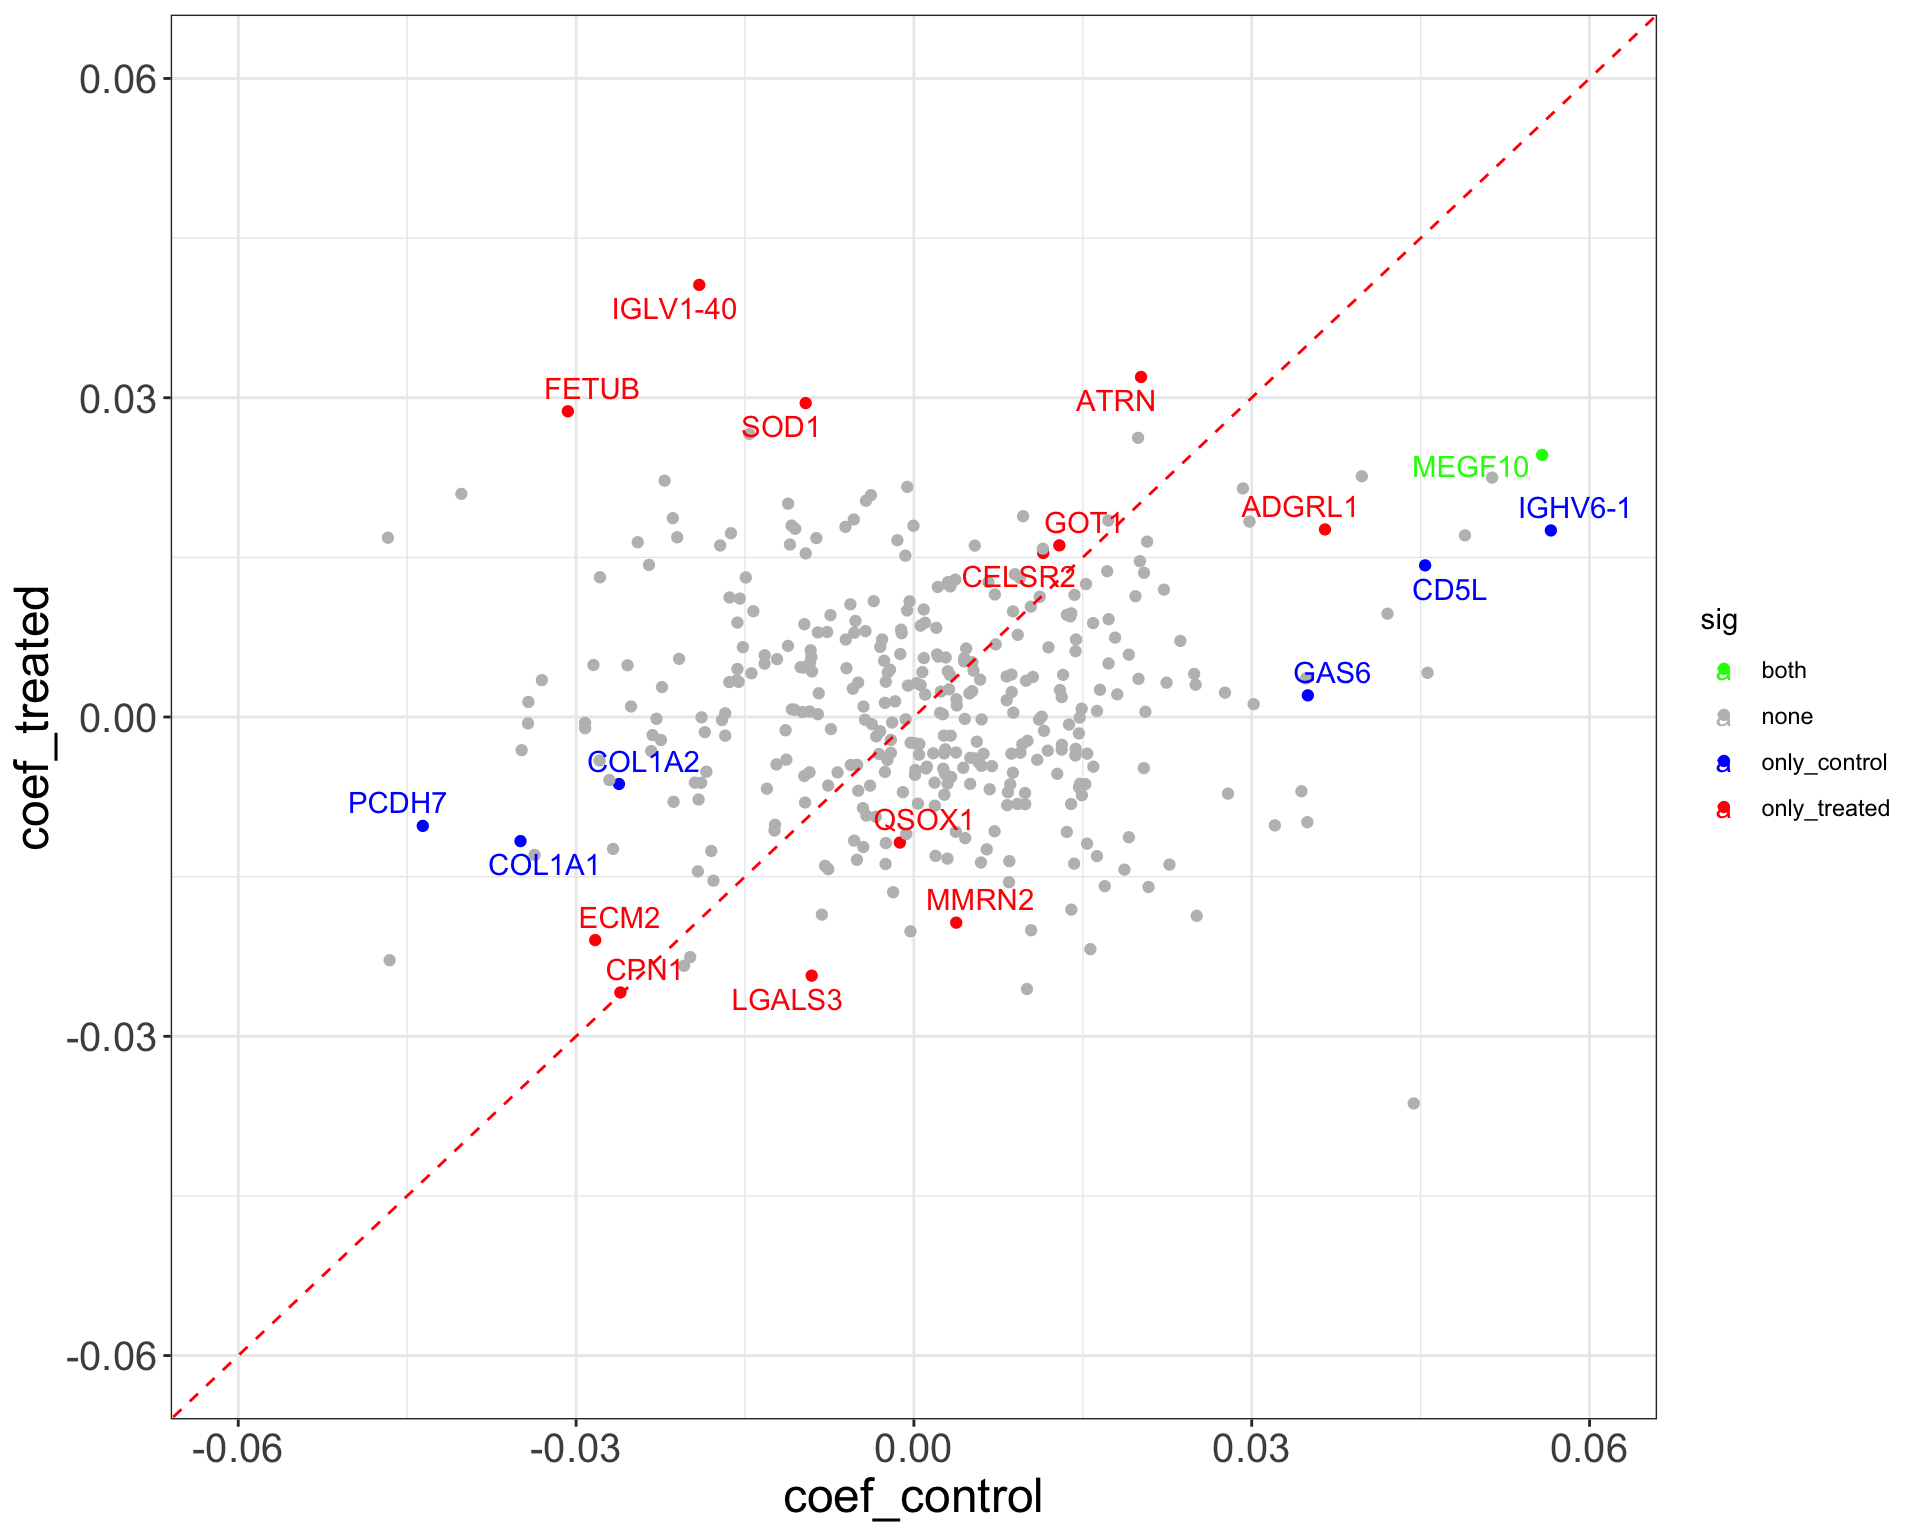
Comparison of number of significant associations
listSigProt <- list(
    Baseline_treated = filter(allResList$corrOutcome_baseline_treated, pval < 0.05)$symbol,
     Baseline_control = filter(allResList$corrOutcome_baseline_control, pval < 0.05)$symbol,
     Visit8_treated = filter(allResList$corrOutcome_visit8_treated, pval < 0.05)$symbol,
     Visit8_control = filter(allResList$corrOutcome_baseline_control, pval < 0.05)$symbol,
     Diff_treated = filter(allResList$corrOutcome_diff83_treated, pval < 0.05)$symbol,
     Diff_control = filter(allResList$corrOutcome_diff83_control, pval < 0.05)$symbol
)

UpSetR::upset(UpSetR::fromList(listSigProt), nsets = 6)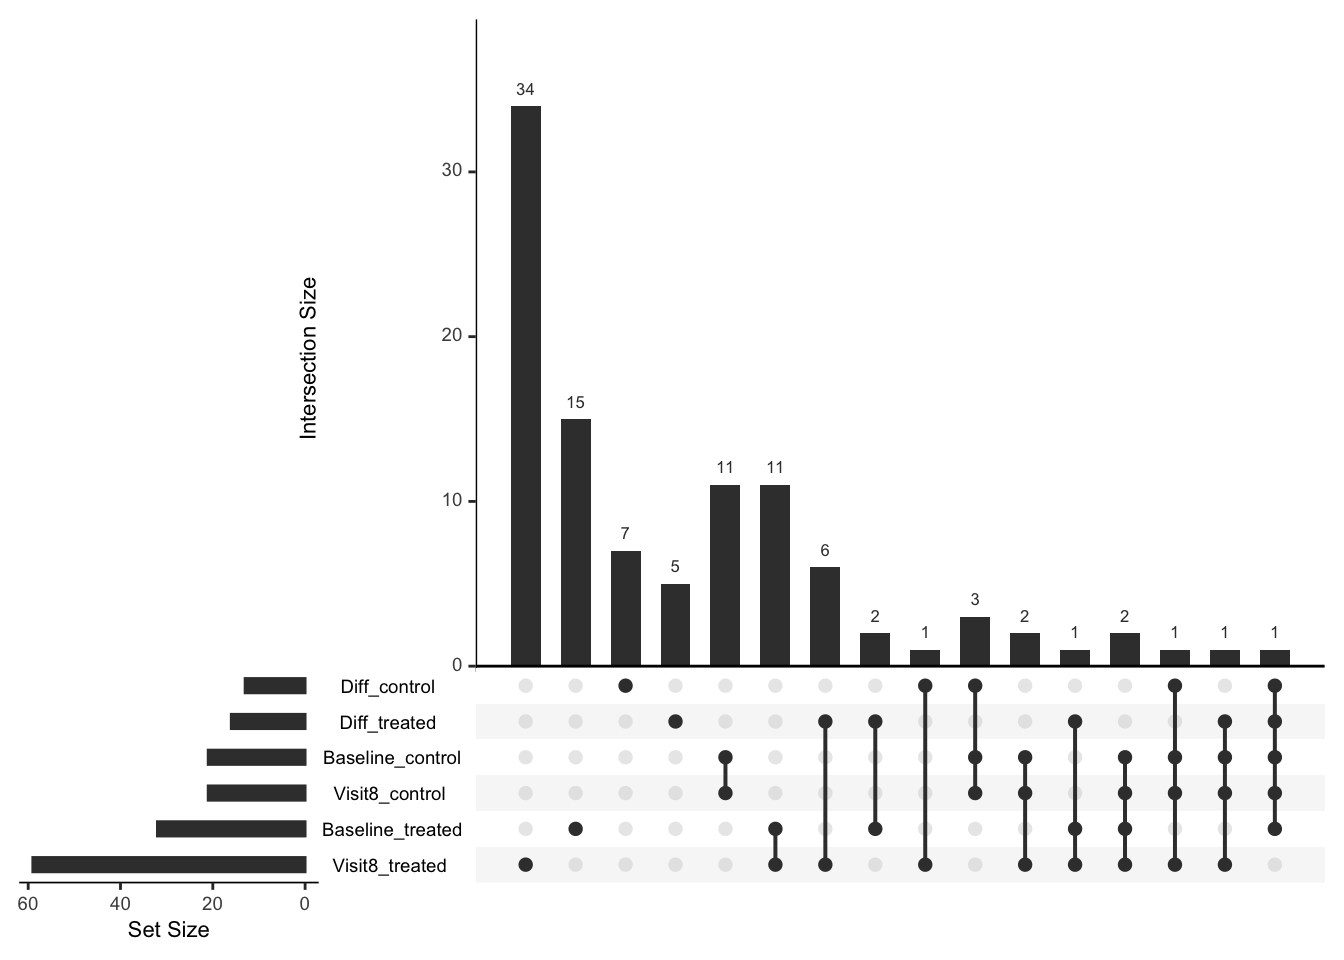
Compare the results between treated and untreated (only in node group B)
Baseline
treatTab <- allResList$corrOutcome_baseline_treatedB %>%
    mutate(condi = "treated")
controlTab <- allResList$corrOutcome_baseline_controlB %>%
    mutate(condi = "control")

compareTab <- bind_rows(treatTab, controlTab)
fcTab <- select(compareTab, name, symbol, diff, condi) %>%
    pivot_wider(names_from = condi, values_from = diff) %>%
    dplyr::rename(coef_treated = treated, coef_control = control)
pTab <-  select(compareTab, name, symbol, pval, condi) %>%
    pivot_wider(names_from = condi, values_from = pval)%>%
    dplyr::rename(p_treated = treated, p_control = control)

plotTab <- left_join(fcTab, pTab, by = c("name","symbol")) %>%
    mutate(sig = case_when(
        p_treated < 0.05 & p_control < 0.05 ~ "both",
        p_treated < 0.05 & p_control > 0.05 ~ "only_treated",
        p_treated > 0.05 & p_control < 0.05 ~ "only_control",
        TRUE ~ "none",

    ))

ggplot(plotTab, aes(x=coef_control, y = coef_treated)) +
    geom_point(aes(color = sig)) +
    geom_abline(slope = 1, intercept = 0, color = "red", linetype ="dashed") +
    xlim(-0.06,0.06) +
    ylim(-0.06,0.06) +
    scale_color_manual(values = list(none = "grey", both = "green", only_treated = "red", only_control = "blue")) +
    ggrepel::geom_text_repel(data = filter(plotTab, sig != "none"), aes(label = symbol, color = sig)) +
theme_full 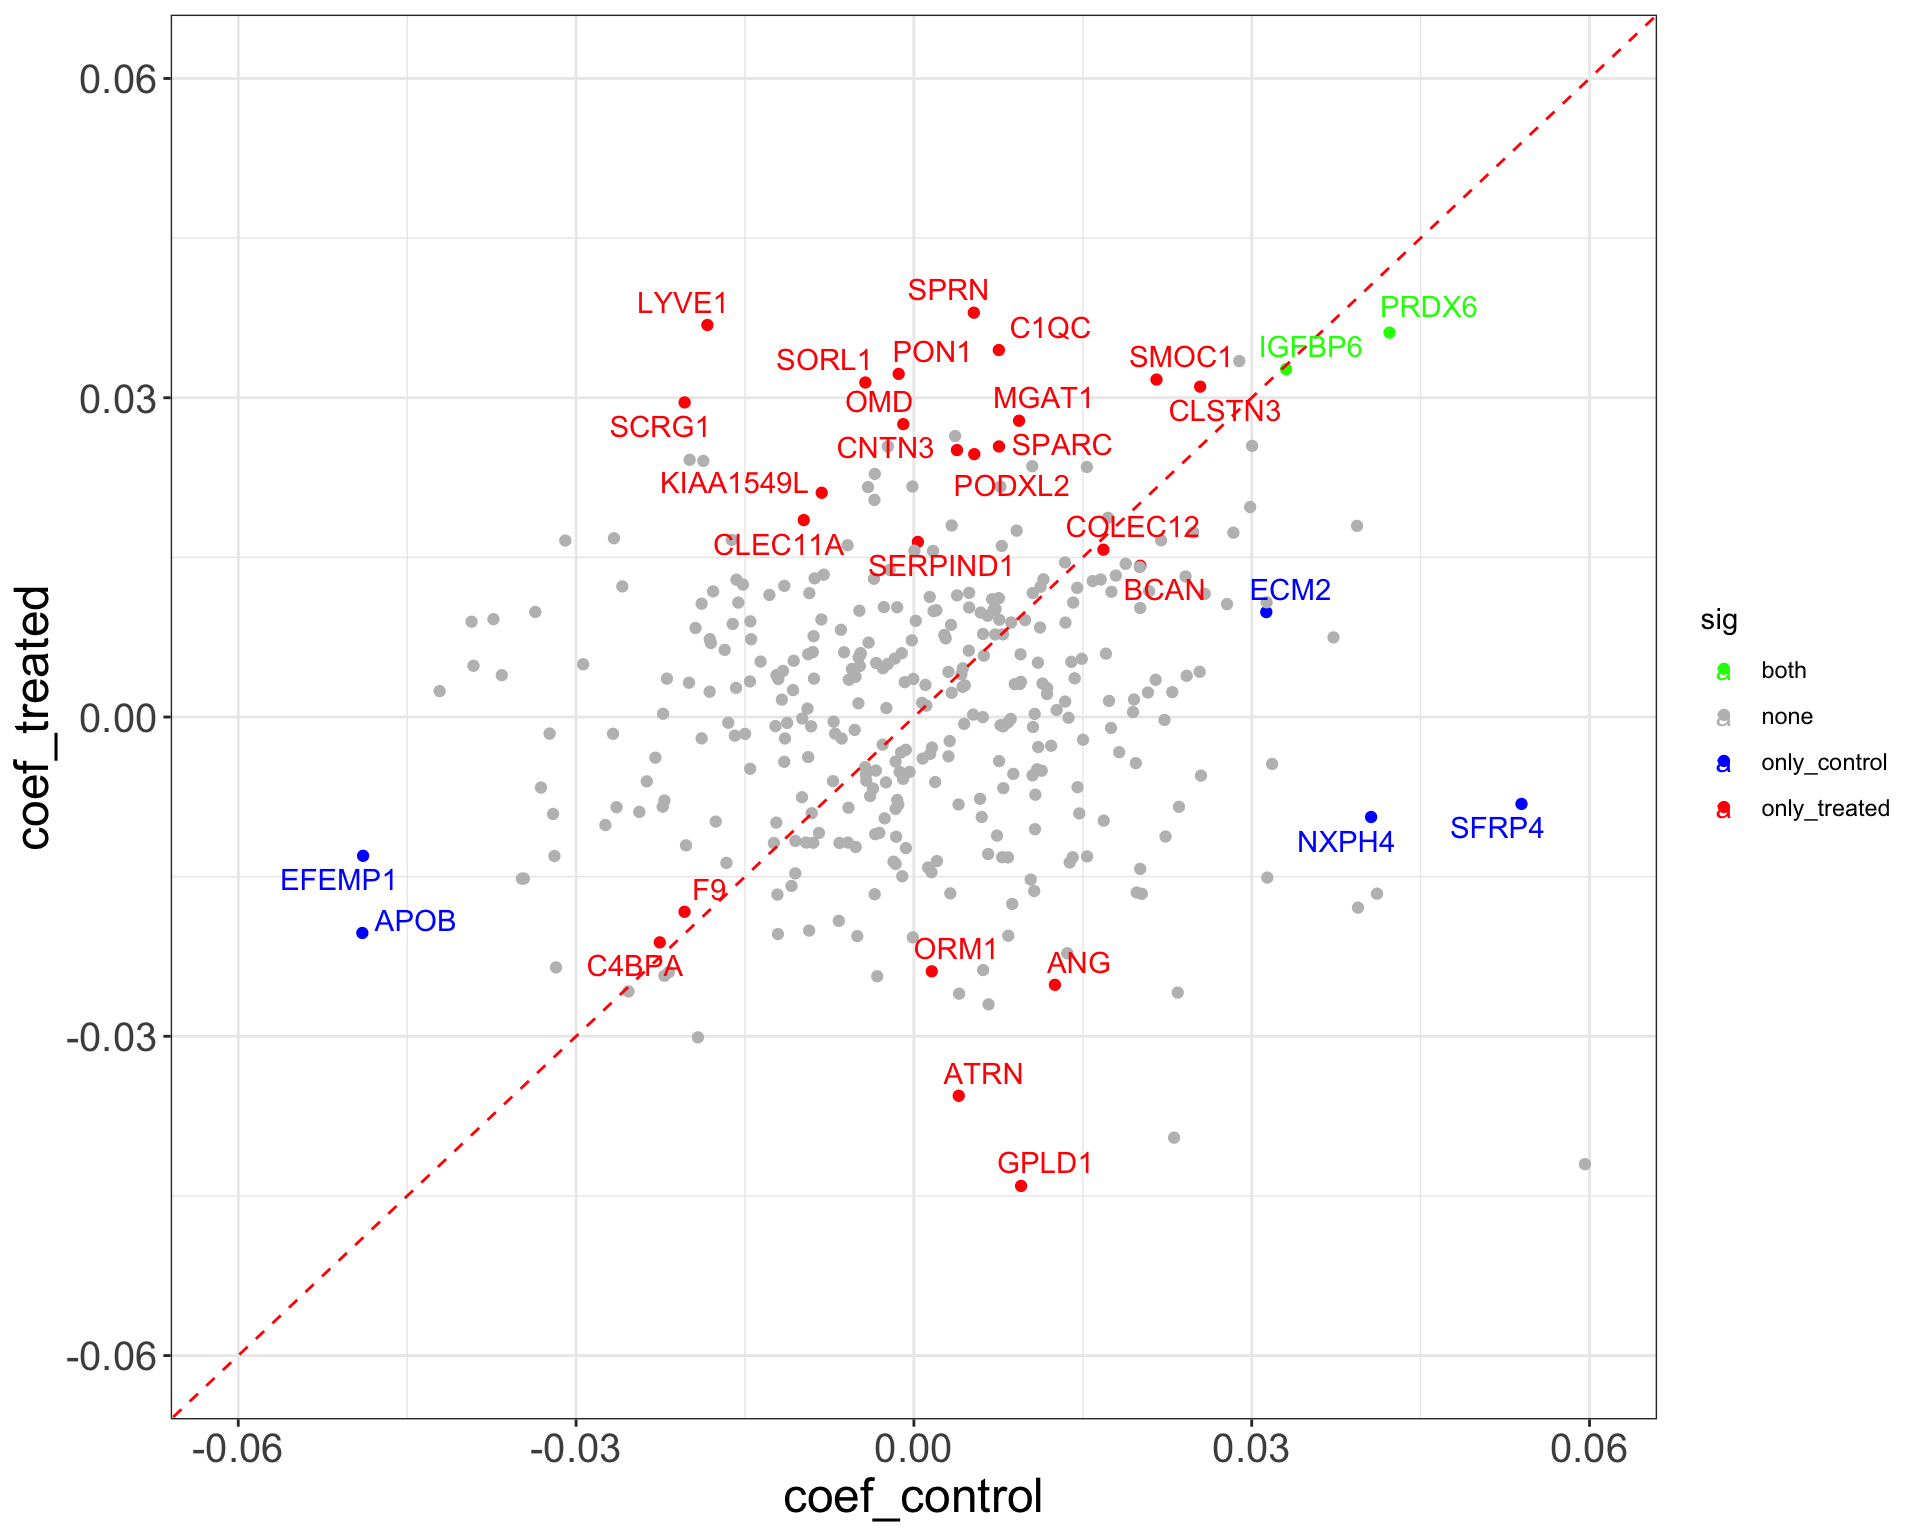
Visit 8
treatTab <- allResList$corrOutcome_visit8_treatedB %>%
    mutate(condi = "treated")
controlTab <- allResList$corrOutcome_visit8_controlB %>%
    mutate(condi = "control")

compareTab <- bind_rows(treatTab, controlTab)
fcTab <- select(compareTab, name, symbol, diff, condi) %>%
    pivot_wider(names_from = condi, values_from = diff) %>%
    dplyr::rename(coef_treated = treated, coef_control = control)
pTab <-  select(compareTab, name, symbol, pval, condi) %>%
    pivot_wider(names_from = condi, values_from = pval)%>%
    dplyr::rename(p_treated = treated, p_control = control)

plotTab <- left_join(fcTab, pTab, by = c("name","symbol")) %>%
    mutate(sig = case_when(
        p_treated < 0.05 & p_control < 0.05 ~ "both",
        p_treated < 0.05 & p_control > 0.05 ~ "only_treated",
        p_treated > 0.05 & p_control < 0.05 ~ "only_control",
        TRUE ~ "none",

    ))

ggplot(plotTab, aes(x=coef_control, y = coef_treated)) +
    geom_point(aes(color = sig)) +
    geom_abline(slope = 1, intercept = 0, color = "red", linetype ="dashed") +
    xlim(-0.06,0.06) +
    ylim(-0.06,0.06) +
    scale_color_manual(values = list(none = "grey", both = "green", only_treated = "red", only_control = "blue")) +
    ggrepel::geom_text_repel(data = filter(plotTab, sig != "none"), aes(label = symbol, color = sig)) +
theme_full 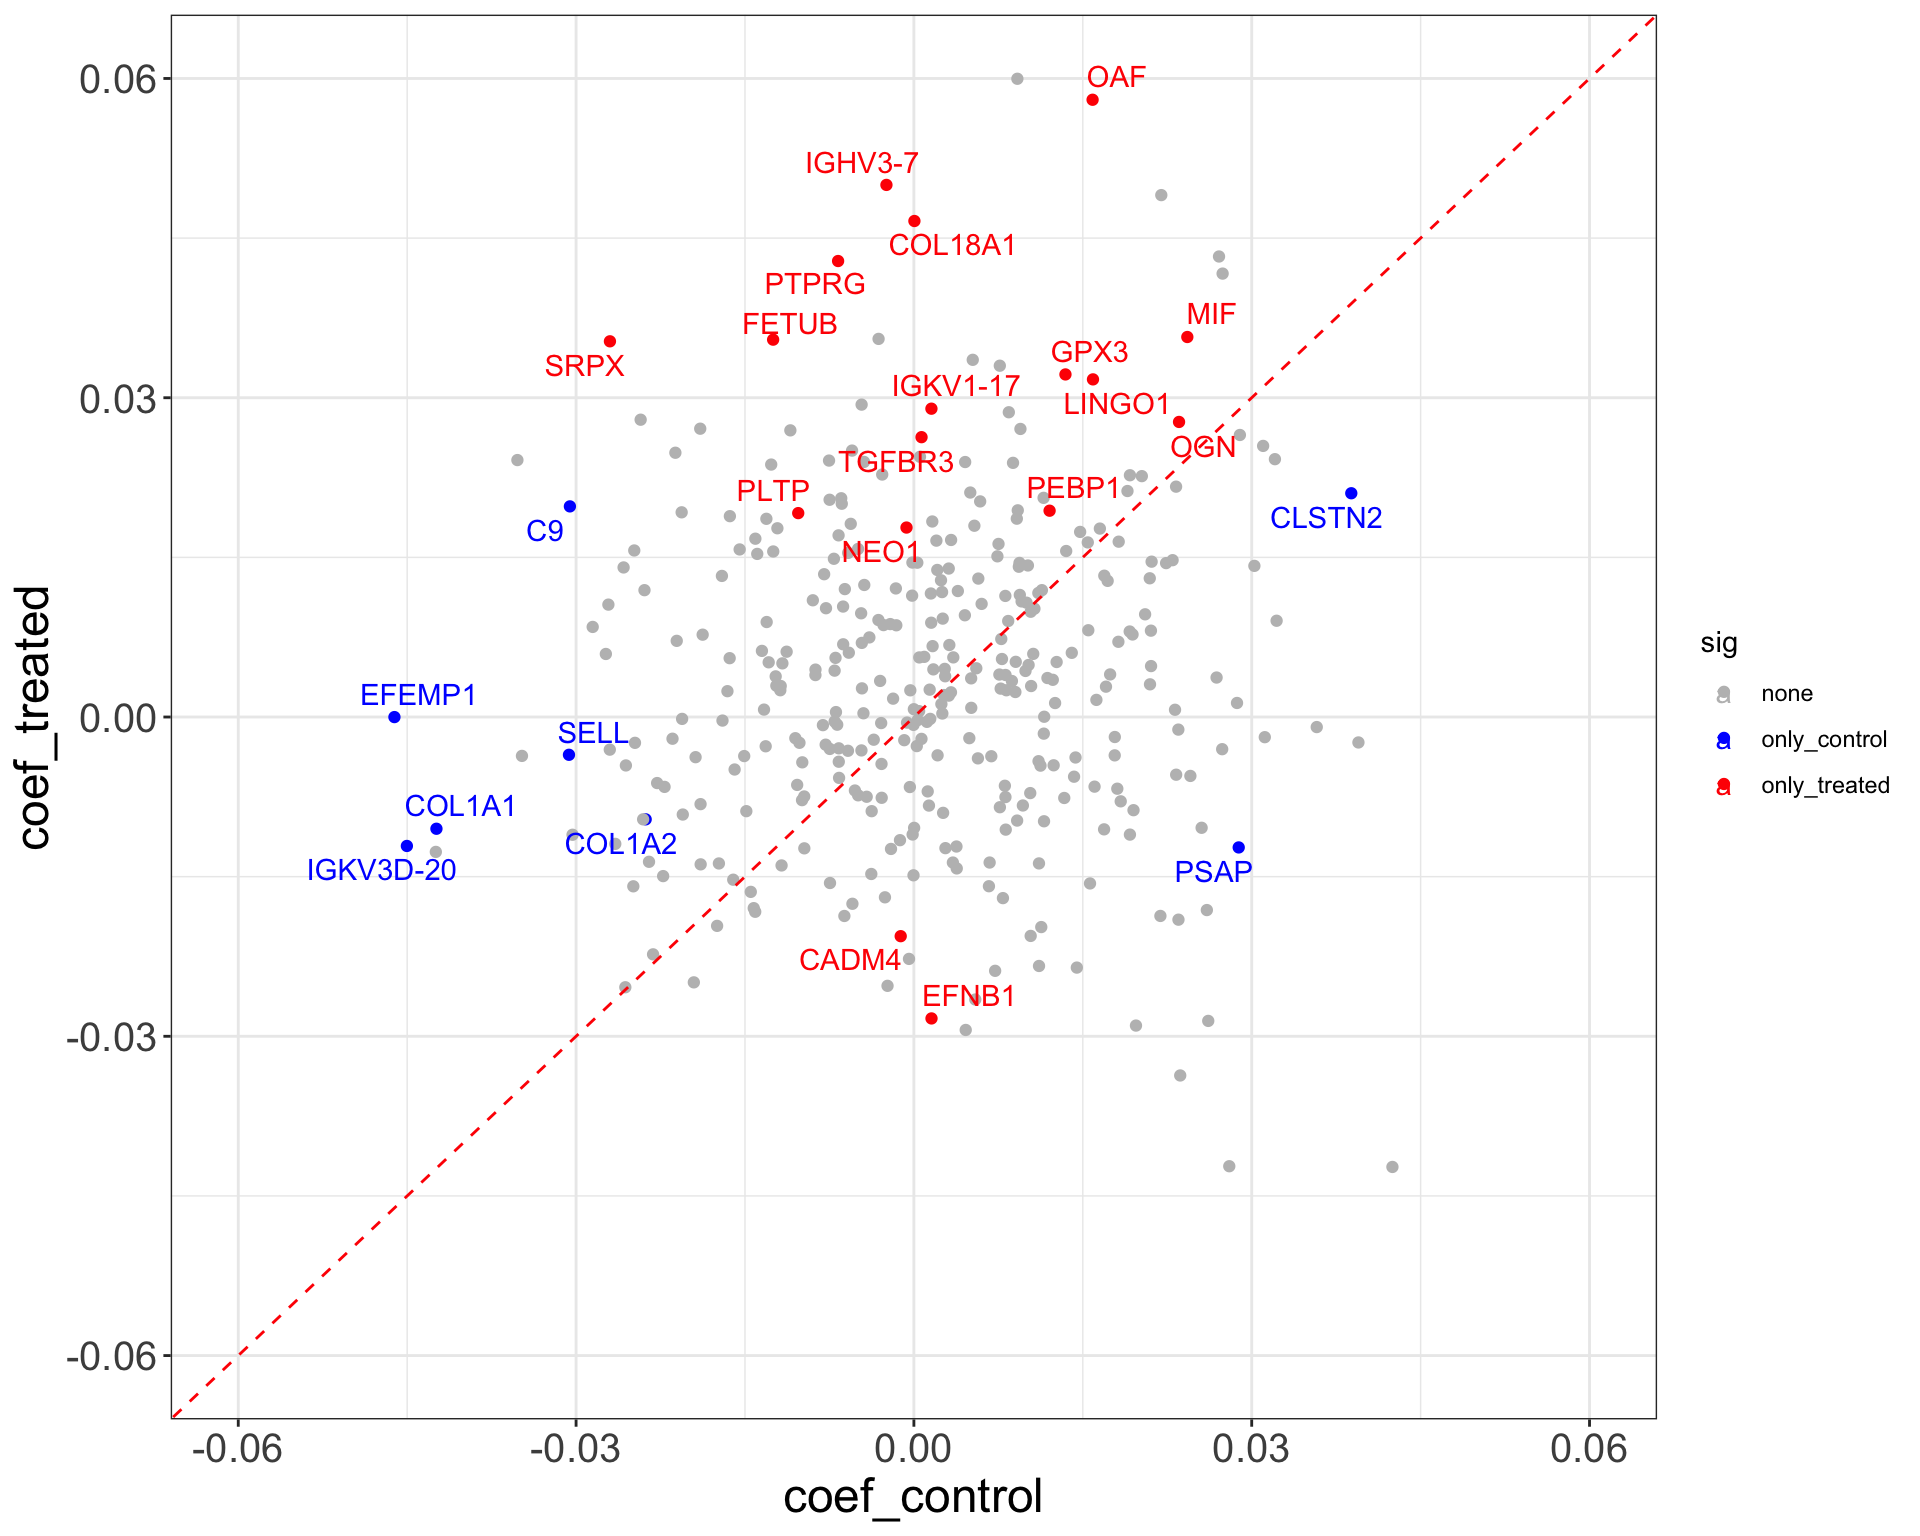
Difference between visit 8 and baseline (visit 3)
treatTab <- allResList$corrOutcome_diff83_treatedB %>%
    mutate(condi = "treated")
controlTab <- allResList$corrOutcome_diff83_controlB %>%
    mutate(condi = "control")

compareTab <- bind_rows(treatTab, controlTab)
fcTab <- select(compareTab, name, symbol, diff, condi) %>%
    pivot_wider(names_from = condi, values_from = diff) %>%
    dplyr::rename(coef_treated = treated, coef_control = control)
pTab <-  select(compareTab, name, symbol, pval, condi) %>%
    pivot_wider(names_from = condi, values_from = pval)%>%
    dplyr::rename(p_treated = treated, p_control = control)

plotTab <- left_join(fcTab, pTab, by = c("name","symbol")) %>%
    mutate(sig = case_when(
        p_treated < 0.05 & p_control < 0.05 ~ "both",
        p_treated < 0.05 & p_control > 0.05 ~ "only_treated",
        p_treated > 0.05 & p_control < 0.05 ~ "only_control",
        TRUE ~ "none",

    ))

ggplot(plotTab, aes(x=coef_control, y = coef_treated)) +
    geom_point(aes(color = sig)) +
    geom_abline(slope = 1, intercept = 0, color = "red", linetype ="dashed") +
    xlim(-0.06,0.06) +
    ylim(-0.06,0.06) +
    scale_color_manual(values = list(none = "grey", both = "green", only_treated = "red", only_control = "blue")) +
    ggrepel::geom_text_repel(data = filter(plotTab, sig != "none"), aes(label = symbol, color = sig)) +
theme_full 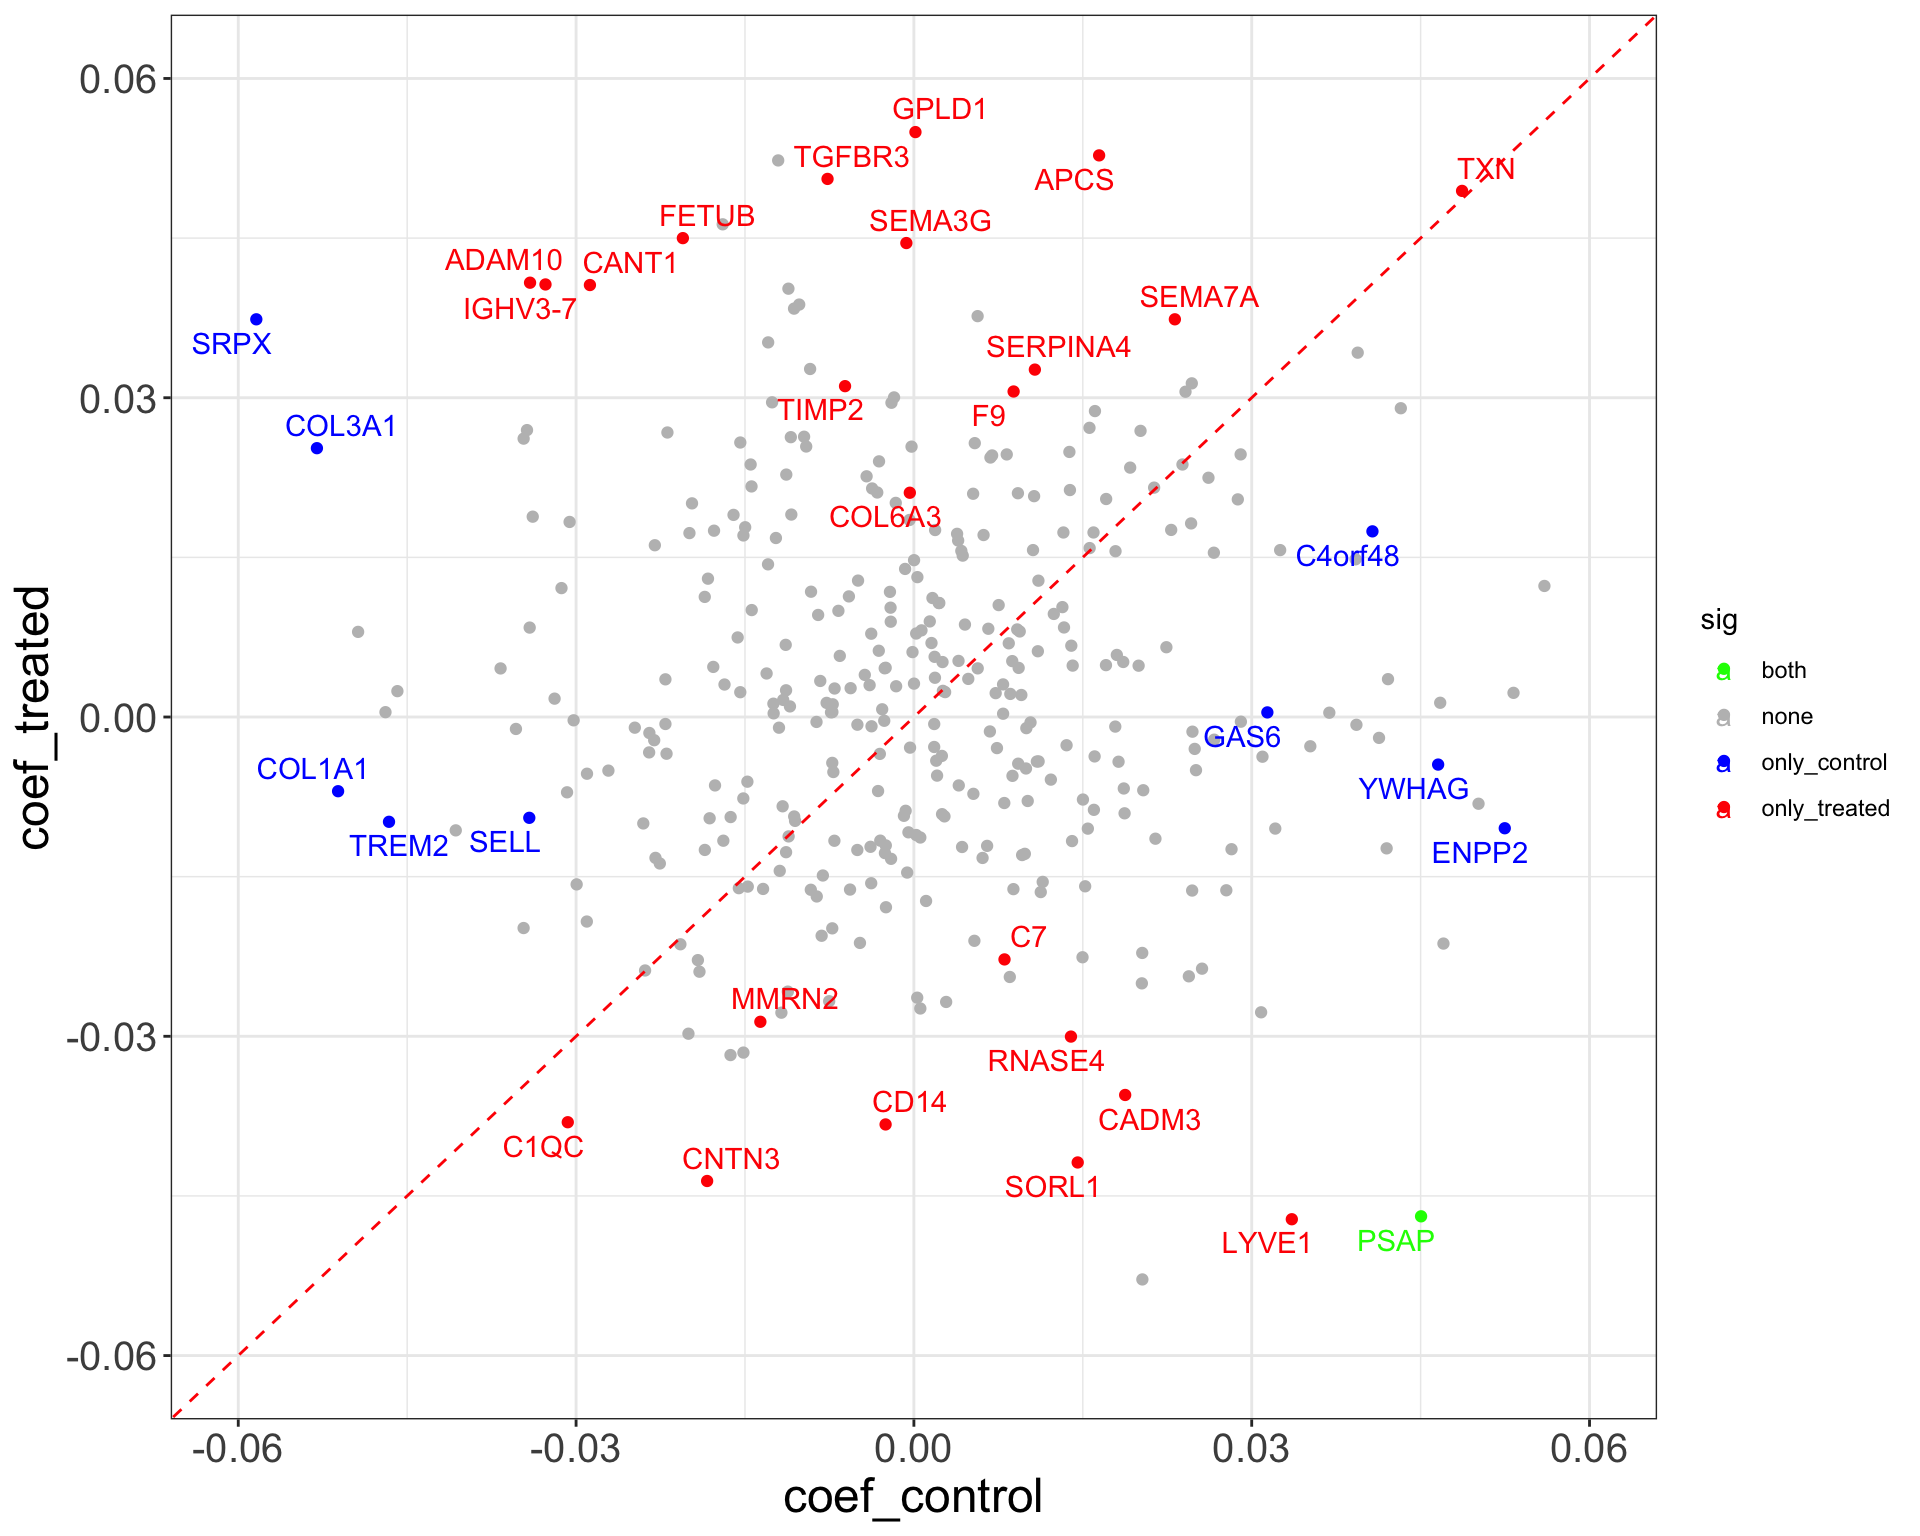
Comparison of number of significant associations
listSigProt <- list(
    Baseline_treated = filter(allResList$corrOutcome_baseline_treatedB, pval < 0.05)$symbol,
     Baseline_control = filter(allResList$corrOutcome_baseline_controlB, pval < 0.05)$symbol,
     Visit8_treated = filter(allResList$corrOutcome_visit8_treatedB, pval < 0.05)$symbol,
     Visit8_control = filter(allResList$corrOutcome_baseline_controlB, pval < 0.05)$symbol,
     Diff_treated = filter(allResList$corrOutcome_diff83_treatedB, pval < 0.05)$symbol,
     Diff_control = filter(allResList$corrOutcome_diff83_controlB, pval < 0.05)$symbol
)

UpSetR::upset(UpSetR::fromList(listSigProt), nsets = 6)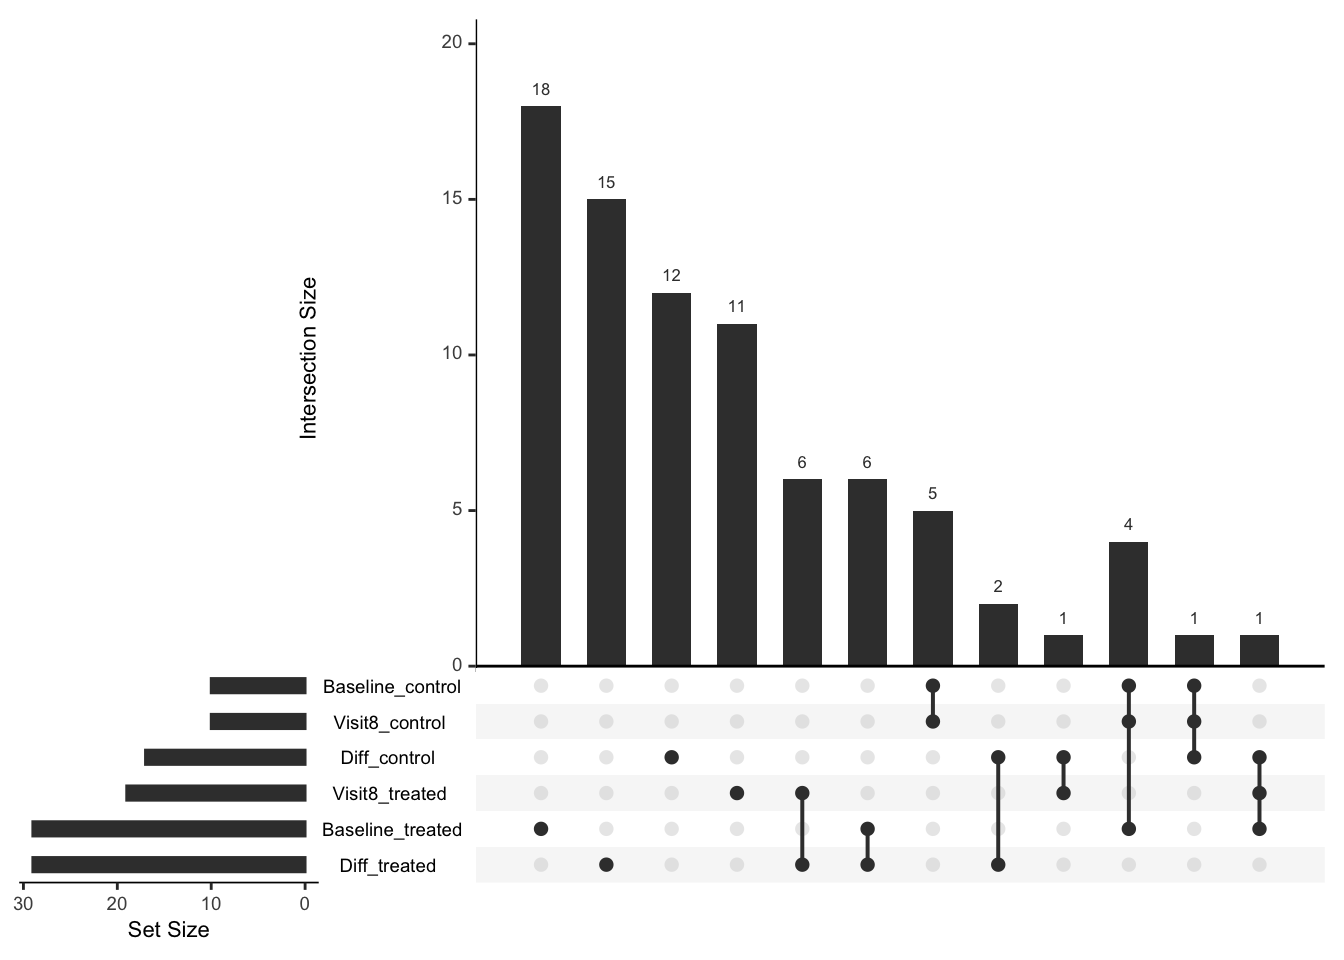
#Save result list
save(allResList, file = "../output/allResList.RData")
sessionInfo()R version 4.2.0 (2022-04-22)
Platform: x86_64-apple-darwin17.0 (64-bit)
Running under: macOS Big Sur/Monterey 10.16
Matrix products: default
BLAS: /Library/Frameworks/R.framework/Versions/4.2/Resources/lib/libRblas.0.dylib
LAPACK: /Library/Frameworks/R.framework/Versions/4.2/Resources/lib/libRlapack.dylib
locale:
[1] en_US.UTF-8/en_US.UTF-8/en_US.UTF-8/C/en_US.UTF-8/en_US.UTF-8
attached base packages:
[1] stats4 stats graphics grDevices utils datasets methods
[8] base
other attached packages:
[1] forcats_0.5.1 stringr_1.4.1
[3] dplyr_1.1.4.9000 purrr_0.3.4
[5] readr_2.1.2 tidyr_1.2.0
[7] tibble_3.2.1 ggplot2_3.4.1
[9] tidyverse_1.3.2 limma_3.52.2
[11] proDA_1.10.0 SummarizedExperiment_1.26.1
[13] Biobase_2.56.0 GenomicRanges_1.48.0
[15] GenomeInfoDb_1.32.2 IRanges_2.30.0
[17] S4Vectors_0.34.0 BiocGenerics_0.42.0
[19] MatrixGenerics_1.8.1 matrixStats_0.62.0
loaded via a namespace (and not attached):
[1] googledrive_2.0.0 fgsea_1.22.0 colorspace_2.0-3
[4] ellipsis_0.3.2 rprojroot_2.0.3 XVector_0.36.0
[7] fs_1.5.2 rstudioapi_0.13 farver_2.1.1
[10] ggrepel_0.9.1 DT_0.23 fansi_1.0.6
[13] lubridate_1.8.0 xml2_1.3.3 codetools_0.2-18
[16] splines_4.2.0 cachem_1.0.6 knitr_1.39
[19] jsonlite_1.8.3 workflowr_1.7.0 broom_1.0.0
[22] dbplyr_2.2.1 BiocManager_1.30.18 compiler_4.2.0
[25] httr_1.4.3 backports_1.4.1 assertthat_0.2.1
[28] Matrix_1.5-4 fastmap_1.1.0 gargle_1.2.0
[31] cli_3.6.2 later_1.3.0 htmltools_0.5.4
[34] tools_4.2.0 gtable_0.3.0 glue_1.7.0
[37] GenomeInfoDbData_1.2.8 fastmatch_1.1-3 Rcpp_1.0.9
[40] cellranger_1.1.0 jquerylib_0.1.4 vctrs_0.6.5
[43] nlme_3.1-158 crosstalk_1.2.0 xfun_0.31
[46] rvest_1.0.2 lifecycle_1.0.4 googlesheets4_1.0.0
[49] zlibbioc_1.42.0 scales_1.2.0 BiocStyle_2.24.0
[52] hms_1.1.1 promises_1.2.0.1 parallel_4.2.0
[55] yaml_2.3.5 gridExtra_2.3 UpSetR_1.4.0
[58] sass_0.4.2 stringi_1.7.8 highr_0.9
[61] BiocParallel_1.30.3 rlang_1.1.3 pkgconfig_2.0.3
[64] bitops_1.0-7 evaluate_0.15 lattice_0.20-45
[67] htmlwidgets_1.5.4 labeling_0.4.2 cowplot_1.1.1
[70] tidyselect_1.2.1 plyr_1.8.7 magrittr_2.0.3
[73] R6_2.5.1 generics_0.1.3 DelayedArray_0.22.0
[76] DBI_1.1.3 pillar_1.9.0 haven_2.5.0
[79] withr_3.0.0 mgcv_1.8-40 RCurl_1.98-1.7
[82] modelr_0.1.8 crayon_1.5.2 utf8_1.2.4
[85] tzdb_0.3.0 rmarkdown_2.14 grid_4.2.0
[88] readxl_1.4.0 data.table_1.14.8 git2r_0.30.1
[91] reprex_2.0.1 digest_0.6.30 httpuv_1.6.6
[94] munsell_0.5.0 bslib_0.4.1