Scientific writing tips
Select content and rhetoric structure
1. Find the right pitch for your story. Research happens in the thin grey zone between the well-known and the totally unknown. Make sure you describe your specific achievement: what has been known, what used to be unknown or controversial, and how does your result change that?
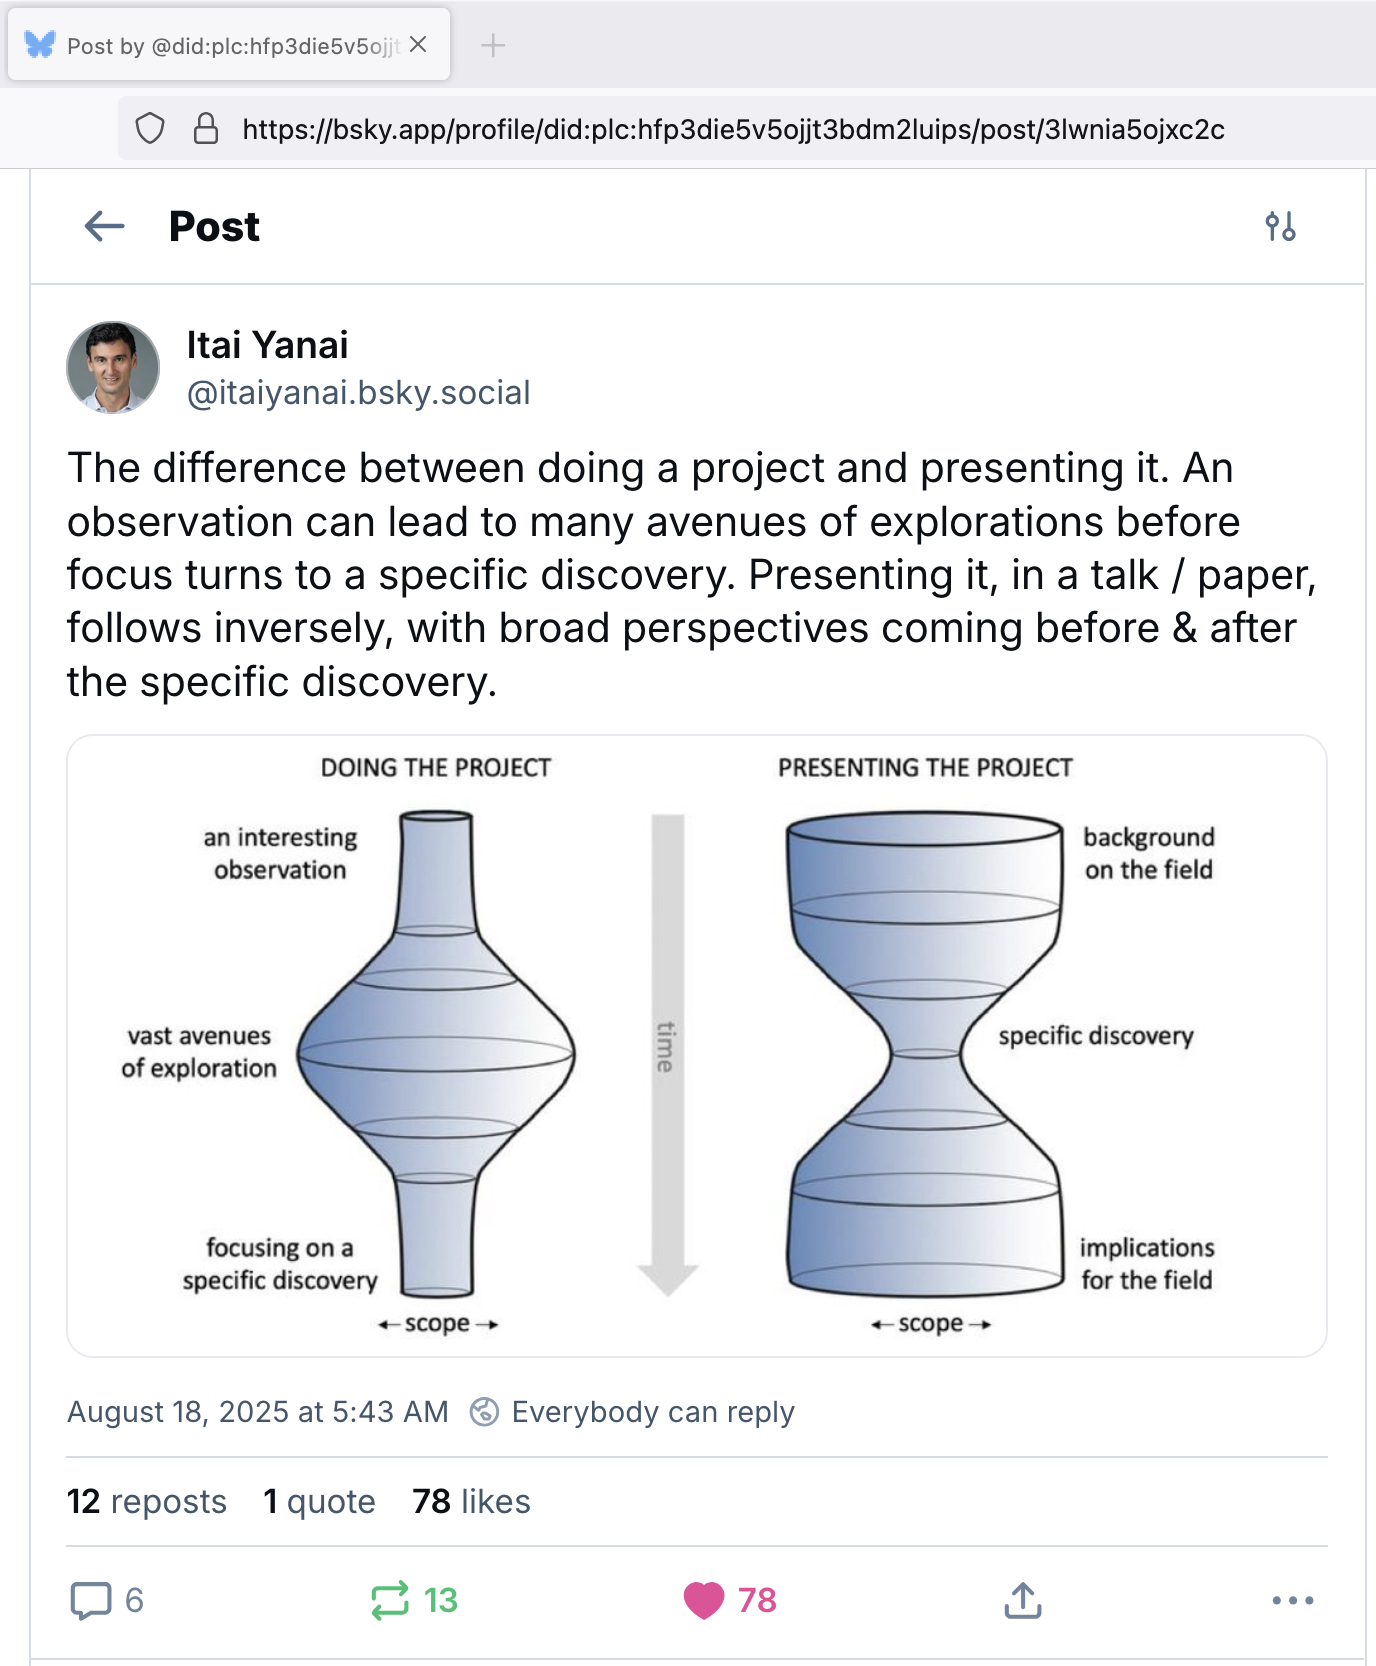
2. The difference between doing a project and presenting it. An observation (a dataset) can lead to many avenues of exploration before focus turns to a specific discovery. Presenting it, in a talk or paper, follows inversely, with broad perspectives coming before and after the specific discovery. (From Itai Yanai)
3. In the Introduction, describe what is known and relevant previous work. Find the right scope and framing. It is rarely necessary to start with Darwin in the 1860s or the invention of digital computers. But it is helpful to give a wide enough background for a target audience that has not been completely immersed in the topic for the last three years. Papers can work in multiple ways, here are some:
- there is a controversy or a contradiction in the existing literature, which you resolve;
- there is glaring open question, and you answer it;
- ‘everybody’ believes or assumes something, but you are the first to prove it from data;
- some sufficiently important people claimed something, and you show it is wrong, or more complicated.
4. Avoid overclaims. These can quickly and efficiently bring up editors and reviewers against you. Pick your words wisely, neither under- nor overselling your conclusions.
5. In the Results section, focus on what you did. Musings about what you or someone could have done instead, or why you did not, are (if at all) for Intro or Discussion.
6. The Results section should proceed step by step, in the right order, without gaps. E.g., in an experimental paper, from choice of measurement technology, to sample acquisition, to specification of the data generated and quality control. Then, state the biological questions you asked, how you translated each into a statistical procedure, a visualization and a numerical summary, and how you interpret the result. Always step by step. Such that each intermediate step or result is explained before it is used by another step. Use short, simple sentences, and plain language (‘Hemingway style’).
7. Define each term. Stick with the conventions of your field. Consult textbooks, reviews, or an LLM to find out. Only if you have a very good reason, make up your own definitions. Try to keep your paper self-contained and provide all necessary definitions in your text. Also provide a reference that readers can consult to learn more.
8. Be decisive. Make each point once, properly, then move on. Avoid being repetitive. If the subject matter demands that we look at the same thing from different angles, then say so, and make it a clear part of the text outline. But if it is possible to make a point with one convincing and forceful argument, do that. A frequent defect is authors repeating the same underlying motivation or hypothesis over and over again for each new experimental step.
9. Make sure there is logical progression. Avoid appearing circular. E.g., start a paragraph with stating a conclusion, and then provide your logical, fact-based argument for it, based on your premises and data. Or, start with the premises, and then go through the logical chain of data analysis steps to arrive at a conclusion. But do not put the conclusion, or the premises, both at the start and end of a paragraph. The reader will likely end up being puzzled about what was actually achieved. This also forces you to be clear:
- what are your premises
- what do the data precisely show
- what new statement results from them
- what are necessary versus sufficient conditions (e.g., are your data simply consistent with a certain hypothesis, or do they single-handedly and decisively prove it?)
10. If a previous paper in the field—even if, and in particular, a ‘high impact’ one—used sloppy terminology or sloppy methods, don’t just uncritically regurgitate that. Improve, or at least take a stand. In science, we are not paid to be sheep following the herd, but to do it right.
11. Don’t use your data to ‘show’ statements that are obvious, evident, true even without any data. If your conclusion contains words such as ‘could’ or ‘may’: these possibilities existed before. Does your data make them substantially more likely?
12. Don’t be boring.
Words
13. Present experimental observations and measurements in the past tense. Use present tense for presuppositions, interpretations and conclusions. The statements in past tense are the facts, the real, hard substance, the novelty of an experimental or observational science paper.
14. Use active voice. Avoid passive voice. So you can make it clear what you did, what others did, or what already pre-existed from your previously reported work.
15. Words: Use one term per concept, and one concept per term. Avoid synonyms and lexical variation. These only add unnecessary mental load on the reader (‘Do they really mean the same? Do they mean to leave room for some subtle distinction? Do they even know what they mean?’). Similarly, do not use the same word for different concepts. An example is using the same word for measurements and for the underlying, unobserved fact or quantity that the experiment is meant to probe. E.g., in RNA-seq, you may have collected for each gene the number of matching sequencing reads, and want it to reflect the mRNA abundance, or even the encoded protein’s activity. We hope that they are related. But they are not the same. There are many technical and biological steps in between them. It is part of the scientific approach (and logic and common sense) to care about such distinctions. Experienced scientists also know when it’s fine to gloss over, and how to find the fine line between necessary precision and pedantry.
16. Be explicit and quantitative. Don’t say ‘few’ or ‘many’, but state the numbers and/or fractions quantitatively. Avoid most adjectives (e.g., high, good, efficient) and adverbs (e.g., fast). Instead, state the relevant physical quantities (e.g., speed, length, time interval) or numerical metrics (e.g., percent overlap, confusion table). Adverbs and adjectives are rarely needed in Results and Methods sections of papers.
17. Be careful with comparatives. Only use them if it is clear what you are comparing to, and if that comparison is important. Otherwise, this can lead you into rhetorical rabbit holes. It is often better to just use the regular form. E.g., you can say ‘We present an improved method for X’ if there is a clear reference method and benchmark result. Otherwise ‘We present an effective and powerful method for X’ may serve you better.
18. Avoid dangling participles. Even if the intended meaning is clear. You may think you sound sophisticated, but it undermines you. Similarly for dangling pronouns.
19. Spell out abbreviations. Always. You may think that abbreviations make a text more readable, by shortening it. The opposite is the case. Many readers do not read the paper linearly from beginning to end, and instead jump around or start in the middle. Even if you think a certain abbreviation is obvious, you will be surprised by how many readers you lose with it.
20. Putting terms in quotes tends to look ‘unprofessional’ and can in most cases be avoided by being careful about the choice of words.
21. If multiple spellings are possible for a term (e.g., hyphenation, capitalization), pick one and stick with it.
22. In biomedical studies, use the word ‘patient’ if you mean the actual person, i.e., a human being with life history, family, feelings, undergoing medical treatment. Use another word if you are just referring to blood samples or tissue biopsies.
23. Keep it simple and laconic. Buzzwords and overuse of technical jargon sound pompous and undermine you. Avoid cliché words and phrases like ‘utilize’, ‘Interestingly, …’
24. You don’t need to dump on other people’s work in order to make your work look good. It’s not a null sum game. You can talk respectfully about prior attempts at your question, and still claim a major advance.
25. Keep it lean. Periodically, go over the text and ask for every single sentence and every single word whether it is necessary. Does it carry new and relevant information? If not, remove it. E.g., prune for occurences of phrases of the form ‘To achieve X, we did (different word for X)’. Don’t say ‘X represents Y’ when it’s just ‘X is Y’. Doing so exposes you as careless of logical thinking.
26. Use a spell-checker.
27. Mathematical notation is a powerful and elegant language to perform and present exact logical and quantitative reasoning. Like any other language, it takes time and effort to learn it. Do not be afraid to ask others to proofread and help. Refer to ISO 80000-2 (Quantities and units - Part 2: Mathematical signs and symbols to be used in the natural sciences and technology).
Logistics
28. If your paper involves data that you have generated: start early with uploading the data to the appropriate public repository, e.g., EMBL-EBI. The better the journal, the stricter their data reporting requirements. Assembling your data (and metadata) to meet the reporting standards of the repository and/or the journal can take days or weeks. After data upload, sometimes several rounds of back-and-forth with the operators of the database ensue, until the data are really accessible. You do not want to expend the time for this while a journal editor or reviewer are already impatiently waiting.
29. Respect Occam’s razor: in analysis pipelines, remove inessential steps (transformations, filtering, etc.); in simulations, remove inessential model ornaments, parameters, keep parameter ranges as small needed. Think about what you really want to show. Do not do something just because others did it or because you once thought it was needed and have not bothered to throw it out.
30. Use a tool that allows collaborative editing in a team and keeps version history. There are several options. I like Quarto manuscripts and a version control system like Git for quantitative work that involves data visualizations and/or maths. For short, simple documents and a WYSIWYG experience, Onlyoffice cloud seems to be an option.
Graphics
31. Colors are a great way of encoding a categorical or continuous variable in your data. Choose the color map carefully. There is good advice on this on the internet. If your paper has multiple plots mentioning the same variable, make sure the color map is the same. Similarly, use distinct color maps for different variables.
32. Pay attention to font sizes. Make sure all text in figures is large enough to be legible. Avoid clutter and repetition. Make choice of font, font style and sizes consistent across figure panels and figures. In practice, this is surprisingly hard. Have a look at Constantin Ahlmann-Eltze’s exactplot package.
33. For plots in which - and -axis show the same physical or conceptual units, make sure the aspect ratio is consistent, i.e., usually 1:1.
Further reading
- Stephen King’s excellent On Writing: A Memoir of the Craft
- The Economist’s Style Guide
The generic abstract of a scientific article
- Why is it important? (1)
- What is “it”? (1)
- But what is the problem with it? (1)
- What did you do about the problem? (1)
- What was your result? (n)
- What are some wider implications? (1)
In parentheses: number of sentences
Use these tips with an AI assistant
These writing guidelines are also available as a SKILL.md file - a structured instruction file that AI coding assistants (GitHub Copilot, Claude, and others) can load to help you review or improve your scientific writing.
How to use with Claude (full instructions):
- Download the ZIP file below.
- In Claude, go to Customize > Skills and click “+” → “Create skill” → “Upload a skill”.
- Upload the ZIP - the skill will appear in your Skills list.
- Toggle it on, then ask Claude to review your draft, suggest improvements, or check your manuscript against these guidelines.
How to use with GitHub Copilot:
- Download the ZIP file below and extract it.
- Place the
SKILL.mdin.github/skills/scientific-writing-tips/SKILL.mdin your repository. - In VS Code, type
/scientific-writing-tipsin the Copilot Chat to activate the skill.